

Abstract
A major drawback of single cell ATAC (scATAC) are the so-called dropout events, i.e. open chromatin regions with no reads due to loss of DNA material during the scATAC-seq protocol. We propose scOpen, a computational method for quantifying the open chromatin status of regulatory regions from scATAC-seq experiments. We demonstrate that scOpen improves all down-stream analysis steps of scATAC-seq data as clustering, visualisation and chromatin conformation. Moreover, we show the power of scOpen and single cell-based transcription factor footprinting analysis (scHINT) to dissect regulatory changes in the development of fibrosis in the kidney. This identified a novel role of Runx1 promoting fibroblast to myofibroblast differentiation driving kidney fibrosis.
Introduction
The simplicity and low cell number requirements of assay for transposase-accessible chromatin using sequenc-ing (ATAC-seq)1 made it the standard method for detection of open chromatin enabling the first study of open chromatin of cancer cohorts2. Moreover, careful consideration of digestion events by the enzyme (Tn5), allowed insights on regulatory elements as positions of nucleosomes1, 3, transcription factor binding sites and the activity level of transcription factors4. The combination of ATAC-seq with single cell sequencing (scATAC-seq)5 further expanded ATAC-seq applications by measuring the open chromatin status of thousands of single cells from healthy6 and diseased tissues7. Computational tasks for analysis of scATAC-seq include detection of novel cell types with clustering (scABC8, cisTopic9); identification of transcription factors regulating individual cells (chromVAR10); and prediction of co-accessible DNA regions in groups of cells (Cicero11).
Usually, the first step in the analysis of scATAC-seq is detection of open chromatin regions by calling peaks on the scATAC-seq data by ignoring cell information. In a second step a matrix is built by counting the number of digestion events (reads) per cell in each of the previously detected regions. This matrix usually has a very high dimension (> 106 regions) and a maximum of two digestion events are expected for a region per cell. As with scRNA-seq12–14, scATAC-seq is effected by dropout events due to loss of DNA material during library preparation. These characteristics imply that scATAC-seq count matrices are extremely sparse, i.e. 3% of non-zero entries. In contrast, scRNA-seq have less severe sparsity (> 10% of non-zeros) than scATAC-seq due to smaller dimension (<20.000 genes for mammalian genomes) and lower dropout rates for genes with high or moderate expression levels. So far, only few computational approaches9, 15 addresses the extreme sparsity and low count characteristics of scATAC-seq data.
We here present scOpen, which uses positive-unlabelled (PU) learning16 to find dropout events and to estimate the probability that a region is open in a particular cell. scOpen algorithm models dropout rates in a cell specific manner and can analyse large scATAC-seq matrices in a few minutes. The resulting probability matrix can then be used as input for usual computational methods for scATAC-seq data as clustering, visualisation and chromatin conformation (Fig. 1a). Moreover, we adapted the footprint based transcription factor activity score from HINT-ATAC4 to infer TFs regulating clusters of scATAC-seq cells (scHINT). We demonstrate the power of scOpen and scHINT by the analysis of regulatory networks driving the development of fibrosis with a novel scATAC-seq time-course dataset of 31,000 cells in murine kidney fibrosis identifying Runx1 as a novel regulator of myofibroblast differentiation.

a, scOpen receives as input a sparse count matrix with number of reads per cell, where regions can be derived by peak calling based on an aggregated scATAC-seq library. After matrix binarisation, scOpen performs PU-learning to find the probability of a region to be open in a cell by detection of dropout events. This matrix can then be given as input for usual scATAC-seq methods for clustering, visualisation and interpretation of regulatory features. b, Evaluation of clustering accuracy by applying distinct imputation/denoising methods to the scATAC-seq matrix in three benchmarking datasets. ARI values (y-axis) of 1 indicate a perfect agreement of the clustering with the true labels. c, Scatter plot comparing clustering results (ARI) of the three benchmarking datasets by providing raw (x-axis) and scOpen estimated matrices (y-axis) as input for state-of-art scATAC-seq methods (scABC, chromVAR, Cicero and cisTopic). d, Odds ratio (y-axis) of Cicero predicted co-accessible sites (n = 3853260) also supported by pol-II ChIA-PET (solid line) and PC Hi-C (dashed line) vs. distance between sites (x-axis). Red lines correspond to raw matrices and blue to scOpen estimated matrix. Odds ratio superior than 1 indicates a positive relationship. e, Visualisation of co-accessibility scores (y-axis) of Cicero predicted with raw (red) and scOpen (blue) estimated matrices contrasted with scores based on RNA pol-II ChIA-PET (purple) and promoter capture Hi-C (green) around the CD79A locus (x-axis). For ChIA-PET, the log-transformed frequencies of each interaction PET cluster represent co-accessibility scores, while the negative log-transformed p-values from the CHiCAGO software indicates Hi-C scores.
Results
scOpen outperforms imputation methods on scATAC-seq cell clustering
We first tested if scOpen improves clustering of scATAC-seq data. For this, we made use of three public scATAC-seq data sets: blood cell progenitors (hematopoiesis)6; subsets of T cells 7 and a combination of six cell lines5. The use of a standard peak calling pipeline17 detected 50,000 to 120,000 open chromatin regions with 3-4% of non-zero entries, confirming the extreme sparsity of scATAC-seq data (Supplementary Table 1). We compared scOpen with imputation and matrix denoising methods proposed for scRNA-seq (MAGIC12, SAVER18, scImpute19, DCA20 and scBFA15); two scATAC-seq imputation method (cisTopic9 and SCALE21); and the raw count matrix. These matrices were given as input to a clustering method and evaluated with Adjusted Rand Index (ARI)22 regarding the agreement with known cell labels as before9. Notably, scOpen outperforms all competing methods by presenting the highest ARI values in all three data sets (Fig. 1b). The combination of ranks order methods as follow: scOpen, cisTopic, raw and scBFA (Supplementary Tab. 2). Altogether competing methods proposed for scATA-seq had highly variable results: cisTopic performed well in Hematopoiesis and T cells, but failed in discerning some of the cell lines (Supplementary Fig. 1). SCALE21 performed well in cell lines, but rather poorly on other data sets. The discriminative power of scOpen is also supported by t-SNE23 projections of these data sets, which indicate a clear separation of the majority of cell types (Supplementary Fig. 1-3). Altogether, these results support that scOpen outperforms state-of-the-art imputation methods.
scOpen estimated matrix improves scATAC-seq analysis
Next, we tested the benefit of using scOpen estimated matrices as input for usual scATAC-seq methods, e.g., scABC8,chromVAR10,cisTopic9 and Cicero11. Therefore we compared the clustering accuracy (ARI) of these four methods with either raw or scOpen estimated matrices. scABC is the only evaluated method offering clustering as a final result, while other methods (chromVAR, Cicero and cisTopic) first transform the scATAC-seq matrix to either transcription factors, genes or topics feature spaces. These features are provided as input for clustering as described before9. In 11 out of 12 combinations of methods and datasets, we observed a higher ARI whenever scOpen matrix was provided as input (Fig. 1c) as reflected in t-SNE plots (Supplementary Fig. 4-6). Moreover, the highest ARI for a given dataset always involved the use of scOpen estimated matrix. Prior to estimating gene centric open chromatin scores, Cicero first predicts co-accessible pairs of DNA regions in groups of cells. We compared Cicero predicted conformation with Hi-C and ChIA-PET on GM12878 cells as in11 and observed that the use of scOpen matrix improves the detection of GM12878 interactions at both global (Fig. 1d) and individual levels (Fig. 1e). Taken together, these results indicate that the use of scOpen estimated matrices improves downstream analysis of state of the art scATAC-seq methods.
scOpen and footprinting analysis identifies novel hematopoietic progenitor subpopulations
Visualisation of the scOpen estimated matrix using t-SNE indicates both known and novel sub-types of hematopoietic progenitor cells (Fig. 2a)6. To further explore this, we estimated the optimal number of clusters with gap statistic24, which indicates a total of 10 groups with sub-groups of known cell types (Supplementary Fig. 7a-b). While HSC/MPP, CMP and GMP sub-clusters resemble differentiation stages previously reported by Buenrostro and colleagues6, we observed that the MEP progenitors form two sub-populations of cells (Fig. 2a; Supplementary Fig. 7c), which have not been described before6, 9. Moreover, top performing imputation approaches (cisTopic and sBFA) did not detected these sub-clusters (Supplementary Fig. 7d). We characterised regulatory features (transcription factors) controlling these sub-clusters with chromVAR10 and HINT-ATAC differential footprinting analysis4. We observed a good agreement between TFs activity scores predicted by chromVAR and HINT-ATAC (average R = 0.59; Supplementary Fig. 8). Both HINT-ATAC and chromVAR indicate that the dimmer GATA:TAL has high activity at MEP1 but also at MEP2 clusters. Only HINT-ATAC detects high activity scores of KLF and NFY25 family factors in MEP1 cells (Fig. 2b-c; Supplementary Fig. 8). Both GATA1 and TAL1 are important regulators of erythroid and megakaryocyte specification; KLF1 is known to bias differentiation towards erythroid cells26, 27. Moreover, we observed higher open chromatin signals in the promoter of the megakaryocyte marker EPOR (and KLF1) in MEP1 cells, while the erythroid marker GP1BA has higher open chromatin in MEP2 cells (Fig. 2d). These results indicate that MEP1 and MEP2 represent sub-populations of cells primed towards erythroid or megakaryocyte cell types, respectively. In short, we show how the combined use of scOpen and footprinting analysis with HINT-ATAC are able to detect and characterise two novel sub-group of cells.
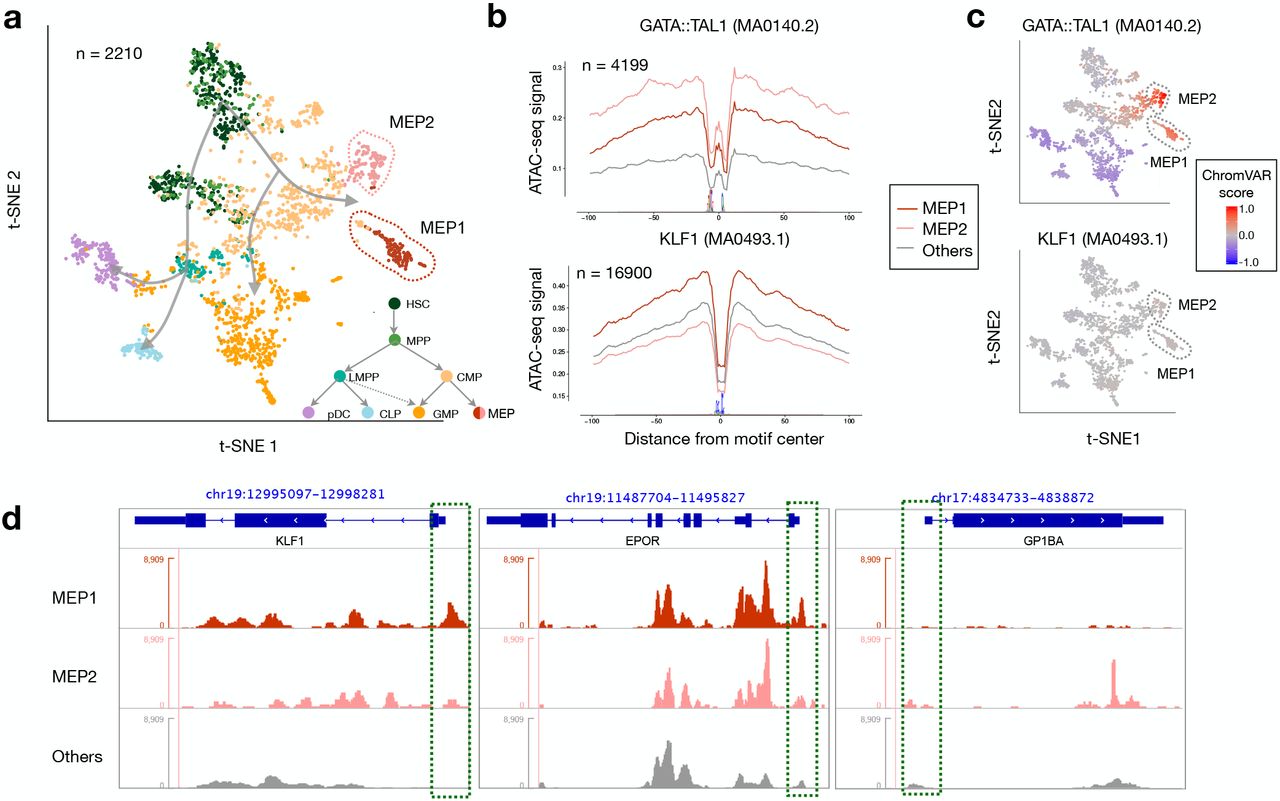
a, Visualisation of t-SNE projection of scOpen estimated matrix for hematopoiesis (HSC, hematopoietic stem cells; MPP, multipotent progenitors; LMPP, lymphoid primed multipotent progenitor; CMP, common myeloid progenitors; CLP, common lymphoid progenitors; pDC, plasmacytoid dendritic cells; GMP, granulocyte macrophage progenitors; MEP, megakaryocyte–erythroid progenitors). The t-SNE positions cells according to the known differentiation paths of these progenitor cells. Particular interesting are two sub-groups of MEP cells (MEP1 and MEP2), which have not been characterised before. b, Transcription factor footprints (average ATAC-seq around predicted binding sites) for the dimmer GATA1:TAL1 and KLF1 for MEP1, MEP2 and other cells. Logo of underlying sequences is shown below. c, chromVAR activity scores also reveal high GATA1:TAL1 activity, but no change in activity is found for KLF1 motifs. d, Normalised pseudo-bulk ATAC-seq coverage reveals distinct chromatin accessibility at promoters (green boxes) at erythroid (KLF1 and EPOR) and megakaryocyte (GP1BA) marker genes.
Novel insights into chromatin accessibility in key fibrosis driving cells by scOpen
Next, we evaluated scOpen in its power to improve detection of cells in a complex disease data set. For this, we performed whole mouse kidney scATAC-seq in C57Bl6/WT mice in homeostasis (day 0) and at two time points after injury with fibrosis: 2 days and 10 days after Unilateral Ureteral Obstruction (UUO)28, 29. Experiments recovered a total of 31,670 high quality cells (average of 14,752 reads per cell) and displayed a high reproducibility (R > 0.99) between biological duplicates (Supplementary Fig. 9; Supplementary Tab. 1). After data aggregation, 252,146 peaks were detected, resulting in a highly dimensional and sparse scATAC-seq matrix (3.2% of non-zeros). Next, we performed data integration for batch effect removal30 using either raw matrix, cisTopic or scOpen estimated matrix (Supplementary Fig. 10). For benchmarking purpose, we annotated the scATAC-seq profiles using the label transfer approach30 from an independent study of single nucleus RNA-seq of the same kidney fibrosis model31. Notably, we observed that clusters on scOpen estimated matrices are more similar to transferred labels (higher ARI) than clusters based on raw matrix or cisTopic imputation, with exception of Day 10 only data were cisTopic obtained higher ARI (Fig. 3a; Supplementary Fig. 10). Of note, imputation of integrated data took 40 minutes for scOpen, 1 day for cisTopic, while scBFA failed to execute due to memory related issues. This again supports not only the discriminative power, but the scalability of scOpen to mitigate scATAC-seq sparsity in large data sets.

a, ARI values (y-axis) contrasting clustering results and transferred labels using either raw or scOpen estimated scATAC-seq. Clustering was performed by only considering UUO kidney cells on day 0 (WT), day 2 or day10 or the integrated data set (all days). b, UMAP visualisation of the integrated UUO scATAC-seq with major kidney cell types: myofibroblasts, fibroblasts, descending loop of Henle and thin ascending loop of Henle (DL & TAL); macrophages (Mac), Lymphoid (T and B cells), endothelial cells (EC), thick ascending loop of Henle (TAL), distal convoluted tubule (DCT), collecting duct-principal cell (CD-PC), intercalated cell (IC), podocyte (Pod) and proximal tubule cells (Injured PT; PT S1-S2 (1) ;PT S1-S2 (2); PT S3). c, Proportion of cells of selected clusters on either day 0, day 2 or day 10 experiments. d, Heatmap with TF activity score (z-transformed) for TFs (y-axis) and selected clusters (x-axis). Activity scores forms three major TFs groups (left) associated to PT (n = 112), fibroblast (n = 56) or immune cells (n = 158). We highlight TFs with decrease in activity scores in injured PTs (Rxra and Hnf4a), with high TF activity scores in injured PTs and myofibroblasts (Batf:Jun; Smad2:Smad3) and myofibroblasts and immune cells (Creb1; Nfkb1). e, Transcription factor footprints (average ATAC-seq around predicted binding sites) for Rxra, Smad2::Smad3 and Nfkb1 factors for selected clusters. Logo of underlying sequences is shown below. f, Transcription factor footprints for Rxra, Smad2::Smad3 and Nfkb1 factors for injured PT cells in day 0, day 2 and day 10.
Clustering results of scOpen estimated matrices recovered all major kidney cell types including proximal tubular cells (PT), distal/connecting tubular cells, collecting duct and loop of Henle, endothelial cells, fibroblasts, immune cells, as well as the rare population of podocytes (Fig. 3b). Identity of clusters, which were initially characterised by transferred labels, are further supported by gene level scores of known marker genes (Supplementary Fig. 11). Of particular interest are cell types with population changes during progression of fibrosis (Fig. 3c; Supplementary Fig. 12). We observed an overall decrease of normal proximal tubular, glomerular and endothelial cells and increase of immune cells as expected in this fibrosis model with tubule injury, influx of inflammatory cells and capillary loss32, 33. Importantly, we detected an increased frequency of a PT sub-population, which we characterised as injured PT by an increased accessibility around the PT injury marker Kim1(Havrc1)34(Supplementary Fig. 13). Another key population of cells in kidney injury and fibrosis are the myofibroblasts that secrete matrix and drive fibrosis. Myofibroblasts were characterised by increased accessibility around Fbln2, Dcn, Fn1 and Acta235 (Supplementary Fig. 10&13). Importantly, competing imputation methods failed to detect myofibroblasts (Supplementary Fig. 14).
scHINT dissects cell specific regulatory changes in fibrosis
Next, we adapted HINT-ATAC4 to dissect regulatory changes in scATAC-seq clusters (scHINT). For each cluster, we created a pseudo bulk ATAC-seq library by combining reads from single cells in the cluster. We then performed footprinting analysis for each cluster and estimated TF activity scores for all footprint supported motifs. We only kept TFs with changes (high variance) in TF activity scores among clusters. We focused here on clusters associated to proximal tubular (PT), fibroblast/myofibroblasts and immune cells, as these represent key players in kidney remodelling and fibrosis after injury. As shown in Fig. 3d, the TF activity scores capture regulatory programs associated to these 3 major cell populations. Interestingly, injured PTs have overall lower TF activity scores of all TFs of the PT cluster. TFs with high decrease in activity in injured PTs include Rxra, which is important for the regulation of calcium homeostasis in tubular cells36, and Hnf4a, which is important in proximal tubular development37 (Fig. 3e; Supplementary Fig. 13). Footprint profiles of Rxra and Hnf4a in injured PTs display a gradual loss of TF activity over time indicating that injured PT acquire a dedifferentiated phenotype during fibrosis progression and tubular dilatation (Fig. 3f; Supplementary Fig. 15).
Interestingly, a group of TFs with high activity scores in injured PTs also have high TF activity scores in myofibroblasts (Smad2:Smad3 and Batf:Jun) or macrophages (Creb1) and lymphoid cells (Nfkb1) indicating shared regulatory programs in these cells. Smad proteins are downstream signals of TGFβ signalling, which is a known key player of fibroblast to myofibroblast differentiation and fibrosis 38. Interestingly, high activity of Smad2::Smad3 also indicate a role of TGFβ in the expansion of injured PTs. Nfkb1 is downstream of both TGFβ signalling and promotes macrophage infiltration to further induce myofibroblasts39. Interestingly, Smad2:Smad3 reach a peak in TF activity level in day 2 after UUO in injured PTs (Fig. 3f; Supplementary Fig. 15), which indicate these TFs are activated post-transcriptionally. Nfkb1, on the other hand, shows a gradual increase over time. This suggests that Nfkb1 is only transcriptionally activated as a downstream effect of TGFβ signalling (Fig. 3f).
Of particular interest is the detection of TFs associated with myofibroblast activation. Differential gene accessibility analysis30 contrasting fibroblast and myofibroblast cells indicated Runx1 as the gene with the highest increase in accessibility (Fig. 4a). Runx1, which has well known function in blood cells40, has the highest TF activity in lymphocytes followed by myofibroblasts and macrophages (Fig. 3d). Interestingly, Runx1 has a higher activity in my-ofibroblasts in contrast to fibroblasts (Fig. 4b) and displays a steady increase of activity during fibrosis development in myofibroblasts (Fig. 4c). To validate the role of Runx1 activity in myofibroblasts, we performed immunostainings and quantification of Runx1 signal intensity in transgenic PDGFRb-eGFP mice that genetically tag fibroblasts and myofibroblasts41. Runx1 staining in control mice (sham) revealed positive nuclei in PDGFRbeGFP+ mesenchymal cells and also tubular epithelial cells (Fig. 4d). In kidney fibrosis after UUO surgery (day 10), Runx1 staining intensity increased significantly in PDGFRb+ myofibroblasts (Fig. 4e-f). To validate a potential role of RUNX1 in myofibroblast differentiation in human, we performed lentiviral overexpression experiments in a human myofibroblast progenitor line to ask whether RUNX1 might be functionally involved in myofibroblast differentiation (Fig. 4g-h). RUNX1 overexpression lead to reduced proliferation (Fig. 4i) and increased expression of the hallmark extracellular matrix components Col1a1 and fibronectin (Fig. 4j), indicating an increased differentiation of the cells towards myofibroblasts. Altogether, these results uncover a complex cascade of regulatory events across cells during progression of fibrosis and reveal an yet unknown function of Runx1 in myofibroblast differentiation in kidney fibrosis.

a, Volcano plot showing gene differential accessibility between myofibroblasts (n = 26) and fibroblasts (n = 7). b-c, Footprinting profiles of Runx1 binding sites on fibroblasts and myofibroblasts (b) and myofibroblasts at distinct time points (c). d, Immuno-fluorescence (IF) staining of Runx1 (red) in PDGFRb-eGFP mouse kidney. In sham operated mice Runx1 staining shows a reduced intensity in PDGFRb-eGFP+ cells compared to remaining kidney cells (arrows). e, Immuno-fluorescence (IF) staining of Runx1 (red) in PDGFRb-eGFP mouse kidney at 10 days after UUO. Arrows indicate Runx1 staining in expanding PDGFRb-eGFP+ myofibroblasts. f, Runx1 nuclear intensity quantification of PDGFRb-eGFP+ cells in sham vs. UUO mice (n=3). g, Expression of Runx1 by qPCR after lentiviral Runx1 overexpression in a human kidney PDGRFb+ cell line (n=3). h, Immuno-fluorescence (IF) staining of Runx1 in human kidney PDGFRb+ cells lentivirally transduced with either empty vector (EV) or an Runx1 overexpression construct (Runx1). i, Population doublings of Runx1 overexpressing cells vs. control (EV) (n=3). j, Expression of Col1a1, fibronectin and acta2 by qPCR in the human PDGFRb-eGFP+ kidney cell line that had been transduced with either a Runx1 overexpression construct or a control construct (EV) (n=3). Scale bars = 50 m. **P < 0.01, and ****P < 0.0001 versus EV, by a two-side t-test. Bar graphs represent mean +/− SD, adjusted p-values by a two-side t-test.
Discussion
The enzyme used in ATAC-seq (Tn5) will generate a maximum of 2 fragments per cell in a small (~200bp) open chromatin region. Subsequent steps of the ATAC-seq protocol cause loss of a large proportion of these fragments. For example, only DNA fragments with the two distinct Tn5 adapters, which are only present in 50% of the fragments, are amplified in the PCR step42. Further DNA material losses are expected during single cell isolation, liquid handling, sequencing or by simple financial restrictions of sequencing. Assuming that 25% of accessible DNA can be successfully sequenced, we expect that 56%1 of accessible chromatin sites will not have a single digestion event causing the so-called dropout events. Despite this major signal loss, dropout events has been widely ignored in the scATAC-seq literature5–8, 10, 11.
scOpen is the first method for estimating the probability of open chromatin for single cell ATAC-seq data. We demonstrate here that clustering based on scOpen estimated matrices have a higher recovery of the correct cell labels, when compared to imputation methods for scRNA-seq12, 15, 18–20 and the few imputation methods tailored for scATAC-seq (cisTopic-impute9, SCALE21). A novel aspect of scOpen, which is not provided by competing methods, is its ability to model dropout rates in a cell specific manner. Moreover, we have demonstrated that the use of scOpen corrected matrices as input improves the accuracy of existing state-of-art scATAC-seq methods (cisTopic9, chromVAR10, Cicero11). These results support the importance of dropout event correction with scOpen in any computational analysis of scATAC-seq. Of note, a sparsity similar to scATAC-seq are also expected in single cell protocols based on DNA encroachments as scChIP-seq43, scCUT&Tag44, scBisulfite-seq45 just to cite a few. Modelling of dropout events in these protocols represents a future challenge.
The detection of transcription factors that impact on regulating cell differentiation and functions is another popular analysis of scATAC as performed by chromVAR10. For this, chromVAR considers the accessibility, i.e. number of ATAC-seq reads around motif predicted binding sites, inside ATAC-seq peaks. We have recently demonstrated the feasibility of footprinting analysis in bulk ATAC-seq data4 and its advantages compared to approaches considering all motifs inside ATAC-seq peaks, as chromVAR. We present here a footprinting based approach for inferring TF factors controlling groups of single cells (scHINT). In contrast to chromVAR, scHINT consider both accessibility and footprint profiles for measuring TF activity. We demonstrate that footprints helps the characterisation of two sub-groups of megakaryocyte-erytrocyte progenitors by detecting TFs not identified by chromVAR.
Moreover, we characterised complex cascades of regulatory changes associated to kidney fibrosis. Our analysis demonstrates that major expanding population of cells, i.e. injured PTs, myofibroblasts and immune cells, share regulatory programs, which are associated with de-/differentiation and proliferation of particular cell types. Of all methods evaluated, only scOpen estimated matrices allowed the identification of a cluster with myofibroblasts. Understanding myofibroblast differentiation is a key step to understand kidney fibrosis driving chronic kidney disease (CKD) already affecting more than 10% of the worldwide population46. Our downstream analysis revealed a role of Runx1 in driving myofibroblast differentiation in mouse kidney fibrosis, which was validated by staining in transgenic mice and by lentiviral overexpression studies in human PDGFRb+ kidney cells. Interestingly the role of Runx1 as driver of scar formation was recently described in the zebrafish heart47. After injury Runx1 was upregulated in endocardial cells and thrombocytes that expressed collagens shown by single-cell sequencing. The Runx1 mutant however showed reduced myofibroblast formation and enhanced recovery. To this end, inhibiting Runx1 could lead to reduced myofibroblast differentiation and increased endogenous repair after fibrogenic organ injuries in the kidney and heart. Our results shed novel light into mechanisms of myofibroblasts differentiation driving kidney fibrosis and CKD. Altogether, we demonstrate how scOpen and scHINT can be used to dissect complex regulatory process driving a complex disease such as fibrosis in a highly heterogeneous organ.
Methods
scOpen
scOpen uses positive-unlabelled (PU) learning of binary matrices to estimates the probability that a region is open at a particular cell16. Let X ∈ Rm×n be the scATAC-seq matrix, where Xi j is the number of read start sites in peak i and cell j; m is the total number of peaks and n is the number of cells. We simplify the problem by defining a binary open/closed chromatin matrix  , i.e.
 where 1 indicates an open chromatin region and 0 indicates a closed chromatin region or a dropout (non-observed) event.
The major task in PU learning is to complete the matrix  with additional positives (open regions) by detecting dropout events from the negative (or unlabelled) entries. For this, we estimate a matrix M ∈ [0, 1]m×n given the observation
  , where M parametrises a probability distribution that generates an unknown open/closed chromatin matrix Y such that

 where 0 ≤ Mij ≤ 1 represents the probability of the ith peak being open in cell j. For a given dropout rate (ρ), the process of observing
  can be specified as:


The number of reads per cell varies largely in scATAC-seq suggesting that the above dropout sampling process is unlikely uniform. Therefore we introduce a cell specific dropout rate:
 where sj is the number of observed open chromatins for cell j, smax (smin) is the maximum (minimum) number of open chromatin events in a cell from
  . ρmax is a pre-defined upper bound of dropout rate, which we set as 0.5 in scOpen. This parameter assumes a non-linear association between the number of open regions in a cell and the drop-out probability.
The PU learning problem is based on estimating the matrix M by minimisation of the following optimisation problem:
 where
where  is the nuclear norm of matrix M, and σi denotes the ith largest singular value of M. The first item is the unbiased estimator of square loss for each element in M16 and λ is the regularisation parameter, which aims to prevent the model from over-fitting and set to 1 as default value. We assume that M is a low-rank matrix with rank k and the above problem can be written as:
 where W ∈ ℝm×k, H ∈ ℝk×n. This constrained optimisation problem is solved by using cyclic coordinate decent methods. This method iteratively updates the variable wit in W to z by solving the following one-variable sub-problem. Likewise, the elements in H can be updated with similar update rule. The above iteration is carried out until a termination criterion is met, e.g. number of iteration performed.
The above constraints imposed long computational time requirements for large scATAC-seq matrices, due to the need to check consistence of all constraints at each optimisation step. We therefore relax 0 ≤ (WH)ij ≤ 1 to 0 ≤ z.

Afterwards, we calculate M as the product of W and H by ceiling values to 1. This algorithm has a theoretical time complexity of the algorithm is O((m + n)k) for a single iteration.
In our experiments, the ceiling operation was only performed to 0.2% of non-zero entries. Moreover, our constraint relaxation lowered the computational time, i.e. 70 folds in the hematopoiesis data set (5 minutes vs 350 minutes), by reducing the number of optimisation iterations.
scATAC-seq benchmarking datasets
The cell line dataset was obtained by combining single cell ATAC-seq data of BJ, H1-ESC, K562, GM12878, TF1 and HL-60 from 5, which was downloaded from gene expression omnibus (GEO) with accession number GSE65360. The hematopoiesis dataset includes scATAC-seq experiments of sorted progenitor cells populations: hematopoietic stem cells (HSC), multipotent progenitors (MPP), lymphoid-primed multi-potential progenitors (LMPP), common myeloid progenitors (CMP), common lymphoid progenitors (CLP), granulocyte-macrophage progenitors (GMP), megakaryocyte–erythroid progenitors (MEP) and plasmacytoid dendritic cells (pDC)6. Sequencing libraries were obtained from GEO with accession number GSE96769. In both datasets, the original cell types were used as true labels for clustering as in previous work8, 9. Finally, the T cell dataset is based on human Jurkat T cells, memory T cells, naive T cells and Th17 T cells obtained from GSE1078167. Labels of memory, naive and Th17 T cells were provided in Satpathy et al.7 by comparing scATAC-seq profiles with bulk ATAC-seq of corresponding T cell subpopulations.
For each dataset, we processed the data similarly as in10. First, the adapter sequences and low-quality ends were trimmed from FastQ files using Trim Galore48. Reads were mapped to the genome hg19 using Bowtie249 with the following parameters (−X 2000 −−very−sensitive −−no−discordant), allowing paired end reads of up to 2 kb to align. Next, reads mapped to chrY, mitochondria and unassembled “random” contigs were removed. Duplicates were also removed with Picard50 and reads were further filtered for alignment quality of >Q30 and required to be properly paired using samtools51. All reads were adjusted by offsetting +4 bp for forward strand and −5bp for reverse strand to represent the cleavage event centre1, 4. We only kept reads from cells with at least 500 unique fragments. We then created a pseudo-bulk ATAC-seq library by merging the filtered scATAC-seq profiles and called peaks using MACS217 with the following parameters (−−keep−dup auto −−call−summits). The peaks were extended ±250bp from the summits as in1 and peaks overlapping with ENCODE blacklists (http://mitra.stanford.edu/kundaje/akundaje/release/blacklists/hg19-human/) were removed. Finally, a read count matrix was constructed with custom python script by counting the number of read start sites per cell in each peak, of which each row represents one peak and each column represents one cell. See Supplementary Table 1 for complete statistics associated to these data sets.
Benchmarking of imputation methods
We compared the performance of scOpen with 7 distinct imputation approaches (MAGIC, SAVER, scImpute, DCA, cisTopic, scBFA and SCALE) in terms of clustering accuracy. In short, we performed imputation with these algorithms (see details below) on the benchmarking datasets, applied PCA (50 PCs) and clustered cell using k-medoids and Person correlation as in9, where k was set to the number of true cell types in each dataset. For visualisation purposes, we used t-SNE23. We used adjusted Rand index (ARI) to evaluate the clustering results22 with labels from benchmarking data sets. The adjusted Rand index measures similarity between two data clustering by correcting the chance of grouping elements. Specifically, given two partitions of a dataset D with n cells, U = {U1,U2, · · ·Ur} and V = {V1,V2, · · · ,Vs}, the number of common cells for each cluster i and j can be written as:
 where i ∈ {1, 2, · · · , r} and j ∈ {1, 2, · · · , s}. The ARI can be calculated as follows:
 where
where  and
and  , respectively. The ARI has a maximum value 1 and an expected value 0, with 1 indicating that the data clustering are the exactly same and 0 indicating that the two data clustering agree randomly.
cisTopic-impute
cisTopic is a probabilistic model to simultaneously identify cell states (topic-cell distribution) and cis-regulatory topics (region-topic distribution) from single cell epigenomics data9. We downloaded it from https://github.com/aertslab/cisTopic and ran it with different numbers of topics (from 5 to 50). The optimal number of topics was selected based on the highest log-likelihood as suggested in9. We then multiplied the topic-cell and the region-topic distributions to obtain the predictive distribution9, which describes the probability of each region in each cell and is used as imputed matrix for clustering and visualisation. We call this method as cisTopic-impute.
DCA
DCA is a deep auto-encoder network for denoising scRNA-seq data by taking the count structure, over-dispersed nature and sparsity of the data into account20. We obtained DCA from https://github.com/theislab/dca and ran it with default setting.
MAGIC
MAGIC is an algorithm for alleviating sparsity and noise of single cell data using diffusion geometry12. We downloaded MAGIC from https://github.com/KrishnaswamyLab/MAGIC and applied it on the count matrix with default setting. Prior to MAGIC, the input was normalised by library size and root squared, as suggested by the authors12.
SAVER
SAVER is a method that recovers the true expression level of each gene in each cell by borrowing information across genes and cells18. We obtained SAVER from https://github.com/mohuangx/SAVER and ran it on the normalised tag count matrix with the default parameters.
scImpute
scImpute is a statistical method to accurately and robustly impute the dropouts in scRNA-seq data19. We downloaded scImpute from https://github.com/Vivianstats/scImpute and executed it using the default setting except for the number of cell clusters which is used to determine the candidate neighbours of each cell by scImpute. We defined this as the true cluster number for each benchmarking dataset.
SCALE
SCALE combines the variational auto-encoder (VAE) and the Gaussian Mixture Model (GMM) to model the distribution of high-dimensional sparse scATAC-seq data21. We downloaded it from https://github.com/jsxlei/SCALE and ran it with default setting. We used option –impute to get the imputed data.
scBFA
scBFA is a detection-based model to remove technical variation for both scRNA-seq and scATAC-seq by analysing feature detection patterns alone and ignoring feature quantification measurements15. We obtained scBFA from https://github.com/quon-titative-biology/scBFA and ran it on the raw count matrix.
Benchmarking of scATAC-seq methods
Next, we compared the performance of state-of-art scATAC-seq methods (scABC, chromVAR and Cicero) when presented with either scOpen estimated or raw scATAC-seq matrix. All methods were evaluated regarding clustering accuracy (as in “Evaluation of imputation methods”). Note that scABC is the only method providing a clustering solution. chromVAR, Cicero and cisTopic transform the scATAC-seq matrices into transcription factor, gene and topic feature spaces. These transformed matrices were used as input for PCA (50 PCs), k-medoids clustering, and t-SNE transformation as before9.
scABC
scABC is an unsupervised clustering algorithm for single cell epigenetic data8. We downloaded it from https://github.com/SUwonglab/scABC and executed according to the tutorial https://github.com/SUwonglab/scABC/blob/master/vignettes/ClusteringWithCountsMatrix.html.
chromVAR
chromVAR is an R package for analysing sparse chromatin-accessibility data by measuring the gain or loss of chromatin accessibility within sets of genomic features, as regions with sequence predicted transcription factor (TF) binding sites10. We obtained chromVAR from https://github.com/GreenleafLab/chromVAR and executed to find gain/loss of chromatin accessibility in regions with binding sites of 571 TF motifs obtained in JASPAR version 201852.
Cicero
Cicero is a method that predicts co-accessible pairs of DNA elements using single-cell chromatin accessibility data11. Moreover, Cicero provides a gene activity score for each cell and gene by assessing the overall accessibility of a promoter and its associated distal sites. This matrix was used for clustering and visualisation of scATAC-seq. We obtained Cicero from https://github.com/cole-trapnell-lab/cicero-release and executed it according to the document provided by https://cole-trapnell-lab.github.io/cicero-release/docs/.
cisTopic
We executed cisTopic as described above. Instead of using the multiplication of topic-cell and region-topic distributions as imputed matrix, we here directly used the topic-cell distribution (after choosing the number of topics with the log-likelihood method) for cell clustering via k-medoids as in9.
Chromosomal conformation experiments with Cicero
We used conformation data to evaluate co-accessible pairs of cis-regulatory DNA as detected by Cicero on GM12878 cells. For this, we replicated the analysis performed in Fig. 4 of11 and contrasted the results of Cicero with raw or scOpen estimated matrices. We obtained scATAC-seq matrix of GM12878 cells from GEO (GSM2970932). For evaluation, We downloaded promoter-capture (PC) Hi-C data of GM12878 from GEO (GSE81503) and used the provided CHiCAGO53 score as physical proximity indicator. We also downloaded ChIA-PET data of GM12878 from GEO (GSM1872887) and used the frequency of each interaction PET cluster to represent how strong an interaction is. We only considered open chromatin regions overlapping with regions present at either ChIA-PET or Hi-C data as in11. ChIA-PET and Hi-C are used as true interactions. We compared the interactions predicted by Cicero to Hi-C interactions and ChIA-PET ligations using the built-in function compare_connections of Cicero. We defined the argument maxgap as 1000bp to allow slop in the comparisons.
Clustering and transcription factor activity analysis on hematopoiesis data
We applied gap statistic24 to determine the optimal number of clusters in hematopoiesis dataset for k-medoids clustering method. The gap statistic compares the total within intra-cluster variation for different values of k with their expected values under null reference distribution of the data. The optimal k will be value that yields the largest gap statistic, which is k = 10. Next, for each obtained cluster, we merged scATAC-seq profiles using samtools51 to create a cluster-specific ATAC-seq library and detected peaks with MACS217. Based on these peaks, we used HINT-ATAC4 to predict footprints and identified all binding sites of a particular TF overlapping with footprints by using its motif from JASPAR version 201852. We then calculated activity score for the TF in each cluster as previously described4. As chromVAR generates a TF activity score for each single cell, we summed up the scores of a TF for each cluster to allow for a comparison between chromVAR and HINT-ATAC. For visualisation, we used deeptools54 to generate a coverage track for MEP1, MEP2 and other clusters after normalisation by counts per million mapped reads (CPM) as shown in Fig. 2d.
scATAC-seq UUO mouse kidney datasets
Animal experiments
Unilateral Ureter Obstruction (UUO) was performed as previously described29. Shortly, the left ureter was tied off at the level of the lower pole with two 7.0 ties (Ethicon) after flank incision. One C57BL/6 male mouse (age 8 weeks) was sacrificed on day 0 (sham), day 2 and 10 after the surgery. Kidneys were snap-frozen immediately after sacrifice. Pdgfrb-BAC-eGFP reporter mice (for staining experiments, age 6-10 weeks, C57BL/6) were developed by N. Heintz (The Rockefeller University) for the GENSAT project. Genotyping of all mice was performed by PCR. Mice were housed under specific pathogen–free conditions at the University Clinic Aachen. Pdgfrb-BAC-eGFP were sacrificed on day 10 after the surgery. All animal experiment protocols were approved by the LANUV-NRW, Düsseldorf, Germany. All animal experiments were carried out in accordance with their guidelines.
scATAC experiments3
Nuclei isolation was performed as recommended by 10X Genomics (demonstrated protocol CG000169). The nuclei concentration was verified using stained nuclei in a Neubauer chamber with trypan-blue targeting a concentration of 10.000 nuclei. Tn5 incubation and library prep followed the 10X scATAC protocol. After quality check using Agilent BioAnalyzer, libraries were pooled and run on a NextSeq in 2×75bps paired end run using three runs of the the NextSeq 500/550 High Output Kit v2.5 Kit (Illumina). This results in more than 600 million reads.
UUO data processing
We used Cell-Ranger ATAC (version-1.1.0) pipeline to perform low level data processing (https://support.10xgenomics.com/single-cell-atac/software/pipelines/latest/algorithms/overview). We first demultiplexed raw base call files using cellranger-atac mkfastq with its default setting to generate FASTQ files for each flowcell. Next, cellranger-atac count was applied to perform read trimming and filtering, alignment, peak calling and barcode counting for each sample independently. Next, we used cellranger-atac aggr to combine reads from all experiments, which includes a new peak calling round. The normalisation model was set as “None” to obtain a matrix of raw counts. We performed cell detection by using the fraction of reads in peaks (FRiP) and number of unique fragments to filter low quality cells. Briefly, we only kept the cells that had at least 55% of fragments in peaks and 1,000 unique fragments for downstream analysis (Supplementary Fig. 9).
Data integration
Next, we used R package Seurat (version 3.1.0) to integrate the scATAC-seq profiles from different conditions (day 0, day 2 and day 10) using default parameters with either raw data, cisTopic or scOpen estimated matrices as input. For raw scATAC-seq matrix, we first selected a subset of peaks that exhibit high variability across cells for each dataset (top 2000 peaks), which were used as anchors for cell integration 30. Then, an integrated matrix was obtained by subtracting the transformation matrix from the original matrix. For cisTopic and scOpen, we used the topic-cell distribution and cell loading matrix as input respectively. Finally, we used k-medoids for clustering of raw, cisTopic and scOpen integrated scATAC-seq matrices as previously described.
Label transfer and cluster annotation
To evaluate and annotate the clusters obtained from data integration, we downloaded a publicly available single-nucleus RNA-seq (snRNA-seq) dataset of the same fibrosis model (GSE119531) and performed label transfer using Seurat330. This dataset contains 6147 single-nucleus transcriptomes with 17 unique cell types31. For label transfer, we created a gene activity matrix for the integrated scATAC-seq data by accessing the chromatin accessibility associated with each gene in each cell using R package Signac (version 0.1.4; https://github.com/timoast/signac). Briefly, we extracted gene coordinates for mouse genome from EnsembleDB with EnsDb.Mmusculus.v79 and extended them to include the 2kb upstream region. We then counted the number of fragments that map to each of these regions for each cell using the function FeatureMatrix. Next, we transferred the cell types from snRNA-seq dataset to the integrated scATAC-seq dataset by using the function FindTransferAnchors and TransferData in Seurat330. These labels were used as true labels to compute ARI for evaluation of the clustering results using either raw data, cisTopic or scOpen as input for data integration (Supplementary Fig. 10). For benchmarking purposes, we also performed the same analysis for each sample separately (Fig. 3a).
For biological interpretation, we have named the cluster by assigning the label with highest proportion of cells to the cluster (see Supplementary File 1). Most clusters were assigned to a single cell type with the exception of clusters 4 and 5, which both had a similar proportion of proximal tubular (PT) S1 and S2 cells. Also, the clustering divided fibroblast population in two clusters (9 and 13). We have characterised cluster 13 as myofibroblasts given the increase of accessibility of markers Fbln2 and Dcn in contrast to cluster 9 (fibroblast) (Supplementary Fig. 11). We also renamed the cells, which were label as Mac2 in Wu et al. 201931, as lymphoid cells given that these cells express B and T cell markers Ltb and Cd1d, but not macrophage markers C1qa and C1qb (Supplementary Fig. 11). Finally, cluster 16 (labelled as proliferative PTs) was removed due to the high number of reads of valid reads in cells (58,000 in proliferative PTs vs 15,000 in other cells), which indicates that it is formed by mutiplets (Supplementary File 1).
Transcription factor analysis with scHINT
Next, we performed a differential TF activity analysis using transcription factor footprints predicted by HINT-ATAC. In short, we create pseudo bulk atac-seq libraries by combining reads of cells for each cluster and performed footprinting with HINT-ATAC. Next, we predicted TF binding sites by motif analysis (FDR = 0.0001) inside footprint sequences using RGT (Version RGT-0.12.3; https://github.com/CostaLab/reg-gen). Motifs were obtained from JASPAR Version 202055. We measured the average digestion profiles around all binding sites of a given TF for each pseudo bulk ATAC-seq library. We used then the protection score4, which measures the cell specific activity of a factor by considering number of digestion events around the binding sites and depth of the footprint. Higher protection scores indicate higher activity (binding) of that factor. Finally, we only considered TFs with more than 1.000 binding sites, with a variance in activity score higher than 0.3. See Supplementary File 1for complete activity scores results. We also have devised a smoothing approach for visualisation of average footprint profiles. In short, we performed a trimmed mean smoothing (5 bps window) and ignored cleavage values in the top 97.5% quantile for each average profile. We denote this novel approach to measure footprint based TF activity scores from scATAC-seq clusters scHINT.
Differential gene accessibility analysis
We used Seurat330 to perform differential accessibility analysis between fibroblast and myofibroblast cells with gene activity score from these two cell populations as input. The gene activity score was generated by using Signac as described above. Next, we normalised the score using the function NormalizeData and then identified the genes with significant differential accessibility using the function FindMarkers (see Supplementary File 1 for complete results).
Immunofluorescence staining
Mouse kidney tissues were fixed in 4% formalin for 2 hours at RT and frozen in OCT after dehydration in 304%4 sucrose overnight. Using 5-10 μm cryosections, slides were blocked in 5% donkey serum followed by 1-hour incubation of the primary antibody, washing 3 times for 5 minutes in PBS and subsequent incubation of the secondary antibodies for 45 minutes. Following DAPI (4,6−diamidino-2-phenylindole) staining (Roche, 1:10.000) the slides were mounted with ProLong Gold (Invitrogen, P10144). Cells were fixed with 3% paraformaldehyde followed by permeabilization with 0,3% TritonX. Cells were incubated with primary antibodies and secondary antibodies diluted in 2% bovine serum albumin in PBS for 60 or 30 minutes, respectively. The following antibodies were used: anti-RUNX1 (HPA004176, 1:100, Sigma-Aldrich), AF647 donkey anti-rabbit (1:200, Jackson Immuno Research).
Confocal imaging and quantification
Images were acquired using a Nikon A1R confocal microscope using 40X and 60X objectives (Nikon). Raw imaging data was processed using Nikon Software or ImageJ. Systematic random sampling was applied to subsample of at least 3 representative areas per image of PDGFRbeGFP mice (n=3 mice per condition). Using QuPath nuclei were segmented and fluorescent intensity per nuclear size were measured of PDGFRbeGFP positive nuclei.
Ethics
The ethics committee of the University Hospital RWTH Aachen approved the human tissue protocol for cell isolation (EK-016/17). Kidney tissues were collected from the Urology Department of the University Hospital Eschweiler from patients undergoing nephrectomy due to renal cell carcinoma.
Generation of a human PDGFRb+ cell line
The cell line was generated using MACS separation (Miltenyi biotec, autoMACS Pro Separator,#130-092-545, autoMACS Columns #130-021-101) of PDGFRb+ cells that were isolated from the healthy part of kidney cortex after nephrectomy. The following antibodies were used for staining the cells and MACS procedure: PDGFRb (RD #MAB1263 antibody, dilution 1:100) and anti-mouse IgG1-MicroBeads solution (Miltenyi, #130-047-102). The cells were cultured in DMEM media (Thermo Fisher #31885) added 10% FCS and 1% penicillin/Streptomycin for 14 days. For immortalization (SV40-LT and HTERT) the retroviral particles were produced by transient transfection of HEK293T cells using TransIT-LT (Mirus). Amphotropic particles were generated by co-transfection of plasmids pBABE-puro-SV40-LT (Addgene #13970) or xlox-dNGFR-TERT (Addgene #69805) in combination with a packaging plasmid pUMVC (Addgene #8449) and a pseudotyping plasmid pMD2.G (Addgene #12259) respectively. Using Retro-X concentrator (Clontech) 48 hours post-transfection the particles were concentrated. For transduction the target cells were incubated with serial dilutions of the retroviral supernatant (1:1 mix of concentrated particles containing SV40-LT or rather hTERT) for 48 hours. At 72h after transfection the infected PDGFRb+ cells were selected with 2 g/ml puromycin at 72h after transfection for 7 days.
Lentiviral overexpression of RUNX1
RUNX1 vector construction and generation of stable RUNX1-overexpressing cell lines. The human cDNA of RUNX1 was PCR amplified from 293T cells (ATCC, CRL-3216) using the primer sequences 5’-atgcgtatccccgtagatgcc-3’ and 5’- tcagtagggcctccacacgg-3’. Restriction sites and N-terminal 1xHA-Tag have been introduced into the PCR product using the primer 5’- cactcgaggccaccatgtacccatacgatgttccagattacgctcgtatccccgtagatgcc -3’ and 5’- acggaattctcagtagggcctccacac -3’. Subsequently, the PCR product was digested with XhoI and EcoRI and cloned into pMIG (pMIG was a gift from William Hahn (Addgene plasmid #9044; http://n2t.net/addgene:9044; RRID:Addgene_9044). Retroviral particles were produced by transient transfection in combination with pack-aging plasmid pUMVC (pUMVC was a gift from Bob Weinberg (Addgene plasmid #8449)) and pseudotyping plasmid pMD2.G (pMD2.G was a gift from Didier Trono (Addgene plasmid #12259; http://n2t.net/addgene:12259; RRID:Addgene_12259)) using TransIT-LT (Mirus). Viral supernatants were collected 48-72 hours after transfection, clarified by centrifugation, supplemented with 10% FCS and Polybrene (Sigma-Aldrich, final concentration of 8g/ml) and 0.45m filtered (Millipore; SLHP033RS). Cell transduction was performed by incubating the PDGFß cells with viral supernatants for 48 hours. eGFP expressing cells were single cell sorted.
Quantitative RT-PCR
Cell pellets were harvested and washed with PBS followed by RNA extraction according to the manufacturer’s instructions using the RNeasy Mini Kit (qiagen). 200 ng total RNA was reverse transcribed with High-Capacity cDNA Reverse Transcription Kit (Applied Biosystems). qRT-PCR was carried out with iTaq Universal SYBR Green Supermix (Biorad) and the Bio-Rad CFX96 Real Time System with the C1000 Touch Thermal Cycler. Cycling conditions were 95C for 3 minutes, then 40 cycles of 95C for 15 seconds and 60C for 1 minute, followed by 1 cycle of 95C for 10 seconds. GAPDH was used as a housekeeping gene. Data were analyzed using the 2-CT method. The primers used are listed in Supplementary Table 3.
Calculation of population-doubling level (PDL)
For determining PDL, PDGFRb cells overexpressing RUNX1 (or as control having genomicaly integrated the empty vector sequence) were passaged in 6-well plates at density of 1,5x 10(4) cells/well. Every 96hrs (at sub-confluent state), cells were harvested and counted in a hemocytometer before re-seeded at initial density.
Statistical analysis
All reported p-values based on multi-comparison tests were corrected using the Benjamini-Hochberg method.
Code availability
The scOpen code is available at https://github.com/CostaLab/scopen and can be installed by pip install scopen. Code and tutorial for the use of scHINT with the hematopoetic data set is provided in https://www.regulatory-genomics.org/hint/tutorial-differential-footprints-on-scatac-seq/.
Author contributions
Z.L., I.C., C.K., R.K. conceived the experiments, Z.L., C.K., M.C., S.Z. and S.M. conducted the experiments. All authors analysed the results and reviewed the manuscript.
Competing interests
The authors declare no competing interests.
Acknowledgements
This work was funded by grants of the Interdisciplinary Center for Clinical Research (IZKF) Aachen, RWTH Aachen University Medical School, Aachen, Germany and by the Deutsche Forschungsgemeinschaft (DFG-GE 2811/3) to I.C. and (DFG SFB/TRR57 P30, SFB/TRR219 P5) and a Grant of the European Research Council (ERC-StG 677448) to R.K. and by the Bundesministerium für Bildung und Forschung (BMBF e:Med Consortia Fibromap) to I.C. and R.K.. C.K. was partly funded by the clinician scientist program of the German Society of Internal Medicine (DGIM) and a Gerok position of the DFG SFB/TRR 219, P5. Simulations were performed with computing resources granted by ITC RWTH Aachen University under project rwth0233 and rwth0429
Footnotes
↵1 We assume digestion events follow a binomial distribution.


