

Abstract
Many microorganisms produce resting cells with very low metabolic activity that allows them to survive phases of prolonged stress conditions. Using axenic lab cultures, we show that Prochlorococcus, the dominant phytoplankton linage in large regions of the nutrient-poor ocean, cannot survive extended nutrient starvation alone. Under starvation conditions some cells retain metabolic activity, measured as single-cell C and N uptake, but these cultures do not re-grow when transferred into new media. Nevertheless, co-cultures with a heterotrophic bacterium enabled Prochlorococcus to survive nutrient starvation for months. We extend these observations to natural conditions, suggesting that up to 10% of the Prochlorococcus cells in the oceans live under conditions of light starvation, utilizing organic matter produced by other organisms. We propose that reliance on co-occurring heterotrophic bacteria or on the organic matter they produce, rather than the ability to survive extended starvation as resting cells, underlies the ecological success of Prochlorococcus.
Introduction
Not all microbial cells living in natural environments are equally active. In aquatic environments, up to 90% of the cells do not exhibit measurable metabolic activity (“vitality”), based on dyes (e.g. that assess electron transport) or on uptake assays with labeled substrates (Del Giorgio and Gasol 2008). Several possible and non-exclusive explanations have been proposed for this heterogeneity. First, inherent differences in activity between genetically-different organisms, e.g. due to variations in maximum growth rate or the ability to utilize the specific substrate tested. Second, cells might be at different physiological states, e.g. exponentially growing, starved or dying, and thus less active metabolically(Anderson et al. 2015, Jørgensen et al. 2015, Bergkessel et al. 2016). Third, cells show stochastic fluctuations in their activity, due to noise in gene expression or regulatory networks (Engl 2018). Finally, some organisms respond to environmental stress by producing resting stages or spores. Such cells often exhibit very low (or undetectable) metabolic activity, yet are viable, namely able to return to an active state and reproduce when environmental conditions return to favorable (Harms et al. 2016). The presence of such resting stages, together with a fluctuating activity at the single-cell level and the genetic variability found within natural populations, are suggested to promote the survival of the population as a whole (Lennon and Jones 2011, Bergkessel et al. 2016).
Understanding the factors affecting the metabolic activity (vitality) of phytoplankton is of special interest. These microbial primary producers perform about one-half of the photosynthesis on Earth, providing energy through carbon fixation at the base of the aquatic ecosystem. At the same time, low nutrient concentrations due to uptake by phytoplankton may constrain the growth of co-occurring organisms. Phytoplankton viability, e.g. their ability to survive under conditions of nutrient stress, has also been extensively studied, especially for organisms that produce massive blooms that emerge and decline rapidly. For example, some bloom-forming cyanobacteria such as Aphanizomenon species produce morphologically-distinct spores that show very little photosynthetic activity, yet remain viable in the sediment for long periods of time, providing the inoculum for the next growth season (Sukenik et al. 2015). In laboratory cultures of Synechococcus elegantus PCC7942 and Synechocystis PCC6803, two unicellular freshwater cyanobacteria, nitrogen starvation results in a programmed process where cells enter a resting stage, enabling them to survive prolonged periods of stress (Sauer et al. 2001, Klotz et al. 2016). As part of this process, cells degrade their photosynthetic apparatus in a controlled manner, resulting in a loss of chlorophyll autofluorescence and culture bleaching (a process termed chlorosis). However, the observation that chlorotic cells are viable resting stages is not universal. Chlorotic cultures of Microcystis aeruginosa PCC 7806 were shown to contain a small population of non-chlorotic cells with high chlorophyll autofluorescence (described throughout this study as “high-fl”). Only these high-fl cells were suggested to revive after the re-addition of a nitrogen source, while the low-fl cells are presumably dead (de Abreu Meireles et al. 2015). Chlorotic cells were also observed in eukaryotic phytoplankton albeit it is not yet clear to what extent such cells remain viable as it may depend on the specific organism and stress conditions (Behrenfeld and Falkowski 1997, Franklin et al. 2006).
Prochlorococcus is a pico-cyanobacterium that is extremely abundant in the oligotrophic oceans, performing an estimated ~8.5% of global ocean photosynthesis (Flombaum et al. 2013), and providing fixed carbon for up to 75% of the co-occurring heterotrophic community (Ribalet et al. 2015). Prochlorococcus cells in the oceans exhibit extremely high genetic diversity (Kashtan et al. 2014), and some of this diversity has been linked with their ability to grow under conditions of extreme nutrient limitation (e.g. Martiny et al. 2006, Thompson et al. 2011). It has therefore been suggested that this genetic diversity enables Prochlorococcus as a group to thrive across a wide variety of oceanic conditions (Biller et al. 2014). While the physiological and transcriptional responses of multiple Prochlorococcus linages to short-term nutrient starvation have been extensively studied (e.g. Steglich et al. 2001, Martiny et al. 2006, Tolonen et al. 2006, Thompson et al. 2011, Krumhardt et al. 2013), little is known about their ability to survive more than a few days under such conditions. A recent study on the response of Prochlorococcus strains to extended darkness (i.e. C starvation) has shown that these organisms can survive light starvation only for a limited time (Coe et al. 2016). In these experiments, low-fl cell populations reminiscent of chlorotic cells in other cyanobacteria appear after the light-starved cultures were re-exposed to light, regardless of whether these cultures could continue growing (Coe et al. 2016). We therefore asked: i) Do Prochlorococcus respond to long-term nutrient starvation by producing chlorotic cells? ii) If so, are such cells metabolically active (vital) and are they able to reproduce and grow when stress conditions end (viable)? iii) Can chlorotic Prochlorococcus cells be observed in nature? To address these questions, we used fluorescence-activated cell sorting (FACS) to obtain distinct chlorotic sub-populations from axenic and unialgal laboratory cultures of Prochlorococcus which were pre-incubated with isotopically-labelled tracers for photosynthesis (H13CO3) and nutrient uptake (15NH4+) and we visualized their activity using Nanoscale Secondary Ion Mass Spectrometry (NanoSIMS). This method enabled us to measure photosynthesis and N uptake at a single cell resolution by quantifying the change in isotopic ratios (Gao et al. 2016, Berthelot et al. 2018). Our results show that while Prochlorococcus do undergo a chlorosis-like process, with some of the chlorotic cells still photosynthesizing and taking up NH4+, the chlorotic cells are unable to re-grow and thus do not represent resting stages. Instead, co-culture with heterotrophic bacteria in the lab and mixotrophy in the ocean, two aspects of microbial interactions, enable Prochlorococcus to survive long-term stress even without producing resting stages.
Results and discussion
Emergence of chlorotic sub-populations in Prochlorococcus cultures
As Prochlorococcus batch cultures reach stationary stage and start declining, the green color of the cultures disappears, and sub-populations of cells emerge with lower chlorophyll autofluorescence that can be identified by flow cytometry (Figure 1A, B). This phenomenon is observed in strains from all major cultured ecotypes, as well as in Synechococcus WH8102 (Figure 1C). In Prochlorococcus strain MIT9312, lower chlorophyll populations emerged in batch cultures that reached stationary stage due to both N and P limitation, although the timing of sub-population emergence and the forward light scatter and chlorophyll autofluorescence (analyzed by flow cytometry) were different (Supplementary Fig. 1A, B). Cells with lower chlorophyll autofluorescence also appeared in populations of another strain, MIT9313, when these cultures were inhibited in a co-culture with high cell densities of the heterotrophic bacterium Alteromonas HOT1A3 (Supplementary Fig. 1C, D (Aharonovich and Sher 2016)). Thus, the emergence of populations of cells with lower chlorophyll autofluorescence under a variety of stress conditions is a pervasive phenomenon across marine pico-cyanobacteria. We therefore focused on Prochlorococcus strain MIT9313, which has been extensively studied (e.g. (Rocap et al. 2003, Martiny et al. 2006, Tolonen et al. 2006, Thompson et al. 2011, Voigt et al. 2014)), as in this strain three clearly separate sub-populations can be observed (Figure 1B, referred to throughout the study as high-, mid- and low-fl populations).

A) A representative growth curve of MIT9313. The arrows mark the days shown in panel B. B) Flow cytometry scattergrams at the marked time-points from the MIT9313 culture. The x-axis is Forward Scatter (FSC, a proxy for cell size), the y-axis is the chlorophyll autofluorescence of the cells (Per-CP). The emergence of chlorotic sub-population observed from the late exponential phase (Day 18). C) Chlorotic sub-population observed in ageing batch cultures of Prochlorococcus, belonging to different ecotypes: High-Light adapted MED4 (HLI), MIT9312 (HLII) and Low-Light adapted NATL2A (LLI) and MIT9313 (LLIV). In all strains, the chlorotic cells begin to emerge at late exponential stage, becoming dominant in declining cultures, while in the exponential phase only one population can be observed.
In addition to differing in their chlorophyll autofluorescence, the high-, mid- and low-fl cell populations also differ by their forward and side light scatter properties, which are related to cell size and (in larger cells) morphological complexity (Supplementary Fig 2A, B). In agreement with these observations, cells sorted from the high-fl population and observed by SEM (Scanning Electron Microscopy) were larger than those from the mid- and low-fl populations (Sup Fig 2C, D).
Assessing the metabolic activity of sorted chlorotic sub-populations
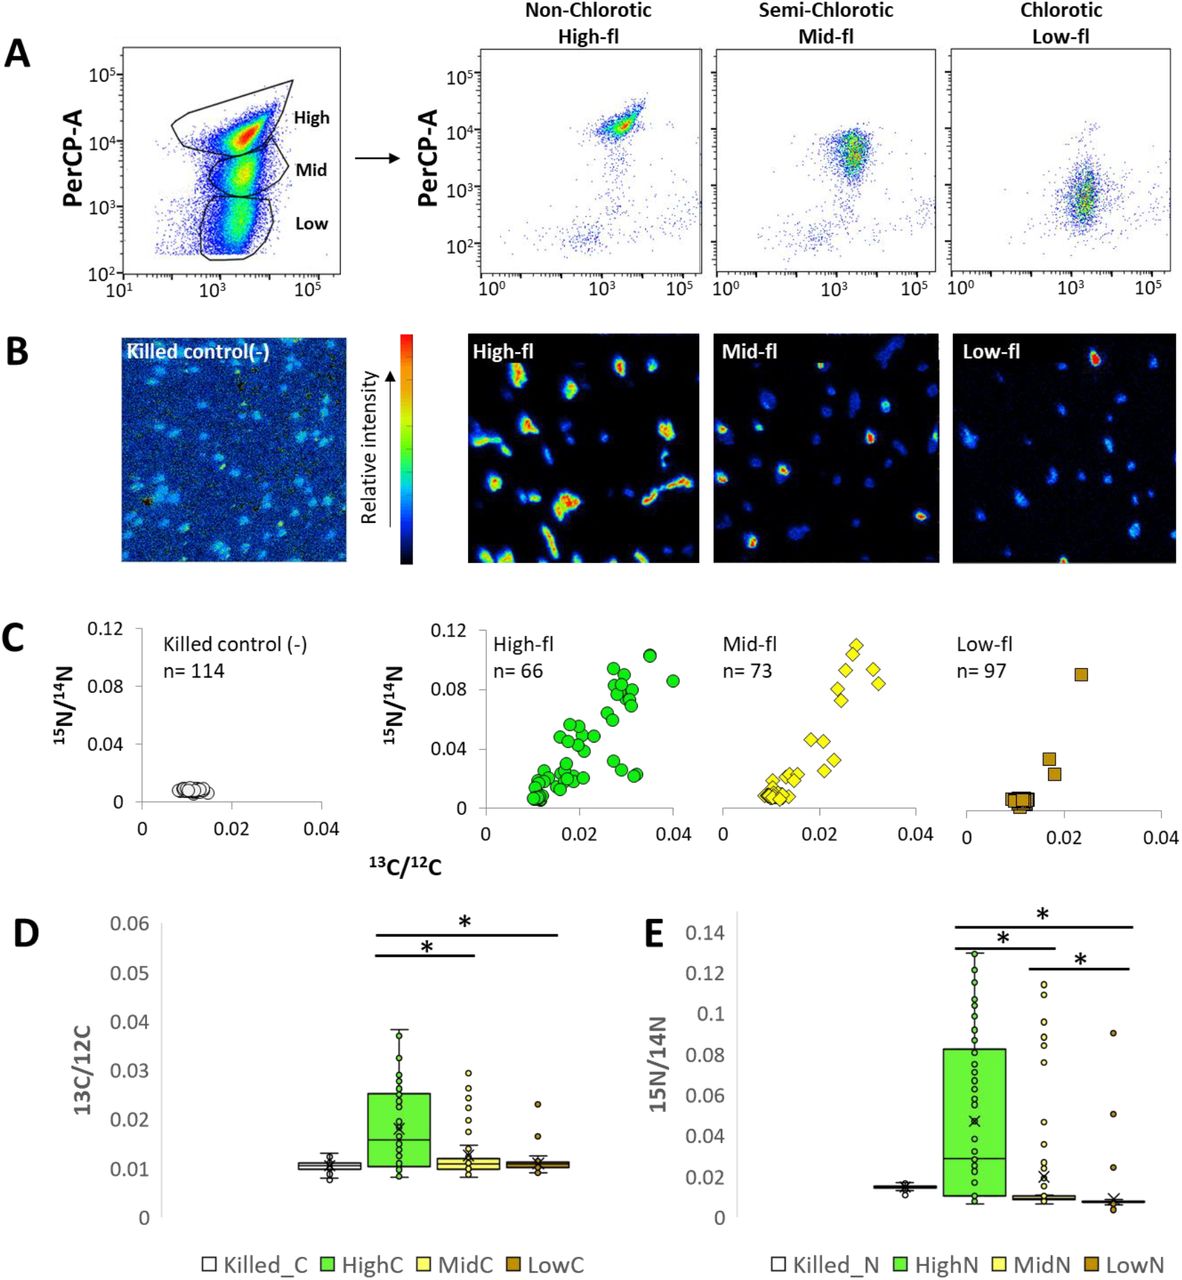
We next asked whether the high, mid- and low-fl populations differ in their vitality, measured here as their photosynthesis and nutrient uptake rates (incorporation of H13CO3− and 15NH4+, respectively). The uptake ratio of labeled versus unlabeled nutrients were then used to calculate the metabolic activity of the sorted cells (Table 1). As shown in Figure 2 and Table 1, the mean uptake of both H13CO3− and 15NH4+ was highest in the high-fl population, followed by the mid and low-fl populations, with the latter population indistinguishable from the control, i.e. glutaraldehyde-killed cells. We have repeated the entire workflow in an independent experiment, and the results are in striking correspondence (Supplementary Fig. 3, Table 1).
The means and standard deviation were calculated from the uptake rates values of single cells in each experiment.

A) Flow cytometry scatterplots before and after sorting of three distinct sub-populations (high, mid and low-fl) of an aging Prochlorococcus MIT9313 culture, detected by flow cytometry. The cultures were grown for 30 days in Pro99 and labeled with H13CO3− and 15NH4+ for 18h. B) NanoSIMS images of 15N/12C analysis of killed cells (negative control) and high, mid and low-fl cells after sorting. C) Scatterplot of 13C/12C and 15N/14N ratios obtained from NanoSIMS analysis of each sub-population. D, E) Boxplots of the 13C/12C and 15N/14N enrichment in each sub-population. Lines represent the median, X represents the mean, box borders are 1st quartiles and whiskers represent the full range.
Within each of the populations, cell-cell heterogeneity was observed in both 13C and 15N uptake (Fig. 2, Supplementary Fig. 3). Within all of the populations (including the high-fl, “healthy” one), some cells were inactive, and this could not be explained by the limited purity of the FACS-sorting procedure (Supplementary Tables 1,2). The coefficients of variation in C and N uptake rates were within the range shown for other organisms, or higher (Supplementary Table 3, (Matantseva et al. 2016, Berthelot et al. 2018)). Similar levels of heterogeneity (primarily in N uptake) were also seen in cells grown under a 12:12 light-dark cycle, where the Prochlorococcus cell-cycle follows a diel rhythm, suggesting that this heterogeneity is not due to different stages of the cell cycle or the diel cycle (Supplementary Table 3, Supplementary Fig. 4). Cell-cell heterogeneity was also observed in cells from an exponentially-growing, nutrient-replete culture (Supplementary Figure 5, Table 3), suggesting that this heterogeneity is not exclusively limited to ageing or stressed cells. This is in accordance with studies assessing the vitality of Prochlorococcus cells using various dyes, which consistently show that a significant fraction of the cells in laboratory cultures are inactive or potentially dead (Agusti and Sanchez 2002, Hughes et al. 2011).
Evaluating the viability of sub-populations
To determine whether the low-fl Prochlorococcus cells are viable resting stages, we tested the ability of cells from an MIT9313 culture to grow upon transfer to new growth media at different times during exponential growth and upon culture decline. As shown in Figure 3 and Supplementary Fig. 6, only cells from cultures where the high-fl cells were dominant could grow when transferred to new growth media. No growth was observed upon transfer of cells from stationary or declining cultures where no high-fl cells were observed. Intriguingly, the presence of high-fl cells was not enough to ensure culture growth (e.g. day 34 in Figure 3). This is consistent with a previous study showing that cells belonging to a different Prochlorococcus strain, MED4, that were incubated for three days in the dark, were unable to resume growth after return to light despite showing no clear difference in the chlorophyll autofluorescence (Coe et al. 2016). The probability of growth after transfer did not depend on the number of transferred cells (Morris et al. 2008), with as many as 2.5×10⁷ cells/ml failing to grow after transfer during culture decline (cells at ~1/10 of this density grew after being transferred during exponential stage). Thus, non-chlorotic cells (defined as being within the range of chlorophyll autofluorescence exhibited by exponentially-growing cells) are not necessarily viable.

A) Growth curve of an MIT9313 culture, grown in Pro99, similar to the experiments shown in Figure 2 and Supplementary Fig. 3, 4 and 7. Arrows indicate the time points at which triplicate 1ml samples were transferred into fresh media. B) Flow cytometry scatterplots of the culture shown in panel A. C) Growth curves of cells being transferred at different times to new, nutrient-replete media (assessed via bulk culture fluorescence). Cells could not re-grow when transferred after day 34, suggesting that not all high-fl cells are viable, and that mid- and low-fl cells are non-viable.
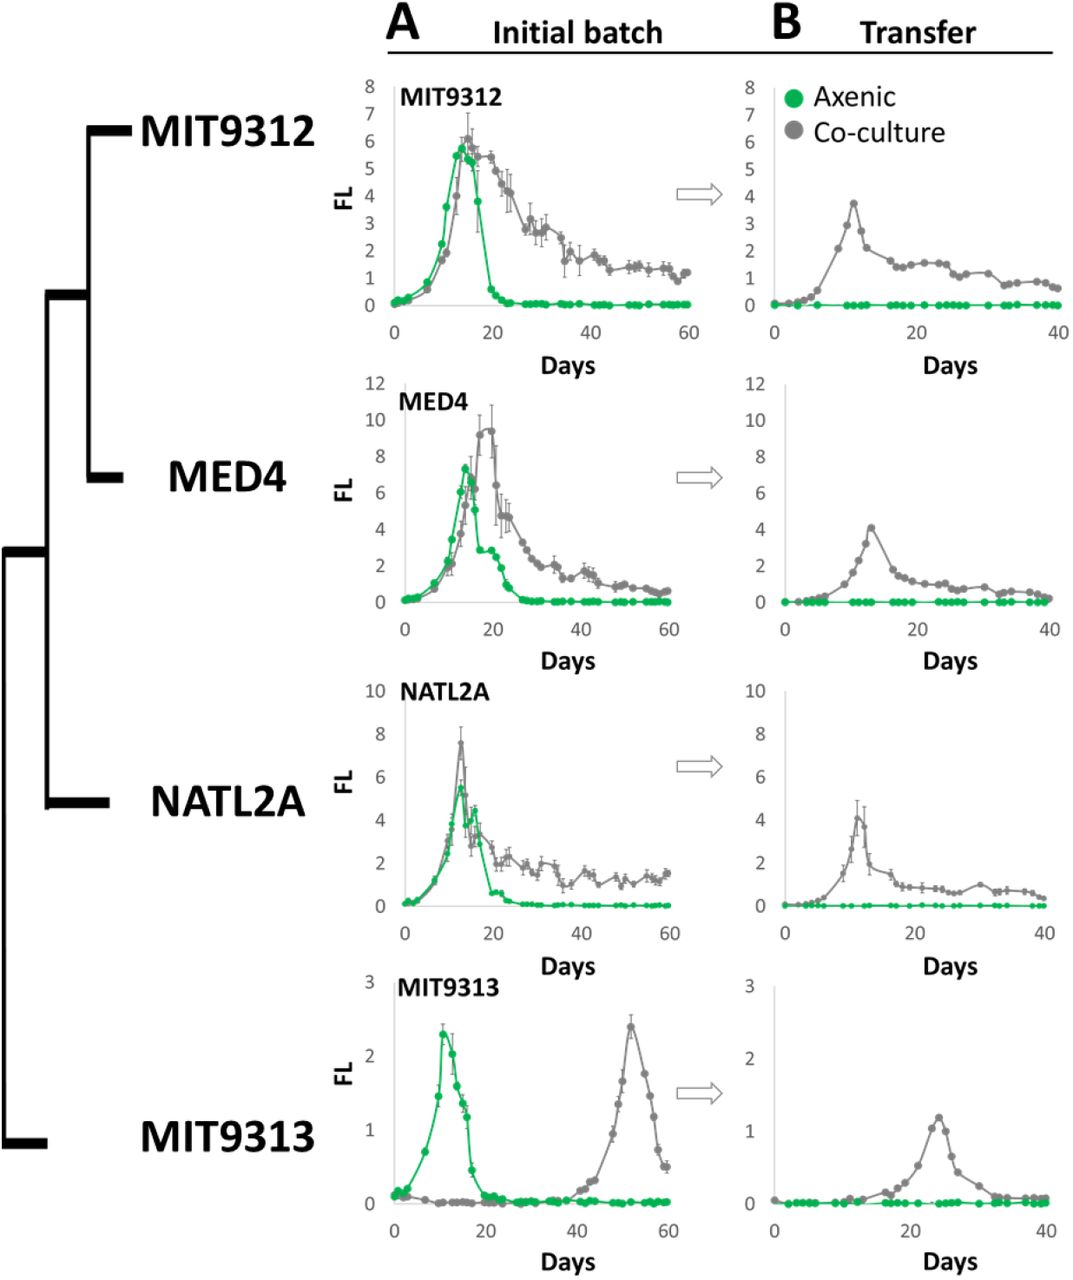
As shown in Figure 4, the inability to survive prolonged nitrogen starvation is not unique to MIT9313, but rather is common to the four tested Prochlorococcus strains, covering the major cultured ecotypes. This is in marked contrast to the ability of (presumably axenic) cultures of two freshwater cyanobacteria, Synechococcus PCC 7942 and Synechocystis PCC 6803, to revive after extended N starvation (Sauer et al. 2001, Klotz et al. 2016). However, when co-cultured with a heterotrophic bacterium, Alteromonas HOT1A3, all Prochlorococcus strains were able to re-grow after 60 days of N stress. Interestingly, strain MIT9313, which was initially inhibited by this Alteromonas strain (Figure 4A, (Sher et al. 2011, Aharonovich and Sher 2016)), was also able to survive long-term starvation in co-culture, suggesting that fundamentally different interactions occur during exponential growth compared to long-term, presumably nutrient-limited growth. These results are consistent with the ability of heterotrophic bacteria to extend the survival time of different Prochlorococcus strains under conditions of constant darkness (albeit for only several days, (Coe et al. 2016)) and with the ability of different heterotrophic bacteria to support the long-term viability of batch cultures of Synechococcus WH7803 (Christie-Oleza et al. 2017).

Panel A: 106 axenic Prochlorococcus cells/ml from different strains were incubated alone (green line) or with the addition of 107 Alteromonas HOT1A3 cells/ml in low-N media (grey line). Bulk culture fluorescence was recorded as a proxy for cell growth, and 1ml from each culture was transferred into fresh media after 60 days. Panel B: The transferred cultures were recorded for additional 40 days. Error bars are standard deviation from triplicate cultures. The late growth of MIT9313 in co-culture is the “delayed growth” phenotype described in (Sher et al. 2011, Aharonovich and Sher 2016).
Exploring the metabolic activity of naturally occurring sub-populations of Prochlorococcus at different depths in the eastern Mediterranean
While chlorotic cells consistently emerge under nutrient starvation in all tested Prochlorococcus strains (Fig 1), environmental conditions in laboratory cultures greatly differ from those in the oligotrophic sea. For example, cell densities and nutrient concentrations are typically orders of magnitude higher in the lab than in the nutrient-poor ocean. Indeed, little is known about the prevalence of chlorosis under natural conditions for phytoplankton in general. Thus, we wondered whether chlorotic Prochlorococcus cells (defined as low-fl and low C and N uptake) can be identified also in nature. We focused on the deep euphotic zone (100-140m, above the nutricline) where both inorganic nutrient concentrations and light availability are low. At this depth, “double” Prochlorococcus populations, differing by their chlorophyll auto-fluorescence, have repeatedly been observed (e.g. (Campbell and Vaulot 1993, Moore et al. 1998)). Previously, these double populations have been shown to contain genetically-different cells belonging to the High-Light adapted (HL, low chlorophyll) and Low-Light adapted (LL, high chlorophyll) clades (Moore et al. 1998), However, a recent study using genetic tools suggested that each of the double populations consists of both HL and LL cells, implying that phenotypic heterogeneity (acclimation) can also contribute to this phenomenon (Thompson et al. 2018). We therefore asked whether the double population could also be due to the presence of chlorotic cells, e.g. if LL cells were mixed above the nutricline, became exposed to nutrient starvation, and subsequently underwent chlorosis. To test this hypothesis, we characterized the Prochlorococcus population structure and single-cell activity (carbon fixation and NH4+ uptake) during late summer in the ultra-oligotrophic Eastern Mediterranean Sea (Figure 5A, B). At the time of sampling, the water column was highly stratified and nutrients were depleted down to around 130m, with a peak in NH4+ concentrations slightly above the nutricline (15nM at 115m and 125m, Fig. 5B). Prochlorococcus were the numerically dominant phytoplankton (Fig 5C), exhibiting a double population at 115m, but not at samples collected above or below this depth (Fig 5E). Amplicon sequencing of the Internal Transcribed Spacer between the 16S and 23S genes (ITS, (Thompson et al. 2018)) revealed that between ~100-137m LL cells (belonging primarily to the LL-I and LL-IV clades) gradually replace the HL cells, consistent with previous studies (e.g. (Malmstrom et al. 2010)) but contrasting with the sharp delineation between high-chlorophyll and low-chlorophyll Prochlorococcus populations (Fig. 5E, (Thompson et al. 2018)).

A-C) Oceanic parameters at the sampling site: Temperature, Oxygen and Chlorophyll (A); Nutrient concentrations (B); Cell counts by flow cytometry (C). D) Relative abundance of different Prochlorococcus clades across the water column, determined by ITS sequencing. E) Histograms of chlorophyll autofluorescence, analyzed from flow cytometry of picoplankton throughout the water column. Note the double population at 115m. F) Scatterplot of 13C/12C and 15N/14N ratios obtained from NanoSIMS analysis of each sorted sub-population from 115m and the single population from 125m. G) Boxplots of the 13C/12C and 15N/14N enrichment in each sub-population. Lines represent the median, X represents the mean, box borders are 1st quartiles and whiskers represent the full range. The three populations did not statistically differ (Kruskal-Wallis test, p<0.001).
Mean H13CO3- and 15NH4+ uptake rates for the majority of the cells sorted from each of the double Prochlorococcus populations at 115m depth were not statistically different, nor were they different from cells collected at greater water depths (Figure 5. F, G, Kruskal-Wallis test, p=0.7 for C and p=0.07 for N). Essentially all of the cells from the Eastern Mediterranean were active, although we did observe some cells with lower C and N uptake rates in the low-fl population at 115m depth (6/45 cells, Figure 5F). This contrasts with the observation from our lab experiments, where inactive cells were observed in all populations, and formed the majority of the cells in the chlorotic (mid- and low-fl) populations. The observation that essentially all of the Prochlorococcus cells in natural samples are active is consistent with a similar study in the North Pacific (Berthelot et al. 2018).
At a depth of 115m light intensity was low (5-6μE during the afternoon), potentially enough to support the growth of some LL strains but not sufficient for active growth under laboratory conditions of most HL strains, including those that are present based on the ITS sequences (Moore and Chisholm 1999). However, previous studies based on cell cycle analysis and on 14C incorporation into divinyl-chlorophyll a have suggested that, even at this depth, Prochlorococcus cells divide every 4-7 days (Goericke and Welschmeyer 1993, Vaulot et al. 1995, Binder et al. 1996, Partensky et al. 1996). The C uptake rates observed in the cells from 115 and 137m were well below the rate required to support this division rate (~1 fg cell−1 day−1, Table 1). Additionally, unlike the laboratory cultures, in which C incorporation rates were 3-6 times larger than N-incorporation rates, in our samples from the Mediterranean Sea the measured C:N uptake ratio was about 1. Thus, the measured C and N uptake rates suggest that, most likely, Prochlorococcus obtain most of the carbon needed for cell growth from non-photosynthetic sources, i.e. through mixotrophy.
Stress survival in pico-cyanobacteria: why is Prochlorococcus different?
In this study, we demonstrate that phenotypic heterogeneity between clonal Prochlorococcus cells occurs at multiple “scales”. In exponentially growing axenic laboratory cultures C and N uptake rates differ significantly between individual cells. This variation is independent of genetic variability. Additionally, as axenic cultures become stressed, a larger phenotypic change occurs as cells lose their chlorophyll auto-fluorescence and become chlorotic. Under these experimental conditions, most cells are inactive (primarily in the low-fl population), although, due to the level of sensitivity of the NanoSIMS, we cannot rule out that even low-fl cells still retain a residual level of activity. Some cells from the chlorotic populations retain at least part of their photosynthetic capacity, and indeed can fix carbon and take up NH4. Yet, in our experiments, they do not re-grow when condition become more favorable. In Synechococcus elegantus PCC 7942, chlorotic cultures retain approximately 0.01% of their photosynthetic activity, as well as a residual level of protein translation, although it remains unclear whether this is a process shared by all cells in the culture or whether this activity is only due to a small subset of more active cells (Sauer et al. 2001). The clear difference between the ability of axenic Synechococcus elegantus PCC 7942 and Synechocystis PCC6803 to survive long-term N starvation, and the inability of axenic Prochlorococcus cultures to do so, suggests an inherent difference in the physiology and genomic functional capacity between these unicellular cyanobacteria.
Entry into chlorosis in Synechocystis is a regulated process that involves the organized degradation of the phycobilisomes in parallel with an increase in the storage products glycogen and polyhydroxybutyrate (PHB) (Klotz et al. 2016). The photosynthesis apparatus of Prochlorococcus is different from that of other cyanobacteria, using unique chlorophyll a2/b2 binding proteins rather than phycobilisomes (Ting et al. 2002), and indeed they lack orthologs of the nblA gene required for phycobilisome degradation during chlorosis (Klotz et al. 2016). Additionally, while Prochlorococcus likely use glycogen as a C storage pool (Lichtlé et al. 1995), they lack the phaA-C and phaE genes required for PHB biosynthesis and which are induced in Synechocystis PCC 6803 under chlorosis (although these genes are not required for revival from chlorosis (Klotz et al. 2016)). Taken together, these differences suggest that Prochlorococcus lack the genetic toolkit employed by Synechocystis PCC6803 and Synechococcus elegantus PCC7942 to enter into a resting stage.
If Prochlorococcus are indeed incapable of producing resting stages in response to nutrient or light starvation, what are the evolutionary drivers of this phenotype, and what are the consequences for the dynamics of Prochlorococcus populations in the ocean? While the open oligotrophic ocean is often considered a relatively stable environment, nutrient concentrations do fluctuate, and phytoplankton (including Prochlorococcus) inhabiting these waters show multiple signs of nutrient stress (Moore et al. 2013, Saito et al. 2014). Many of the microbes that live in such environments comprising a large fraction of the surface ocean have small, highly streamlined genomes (Yooseph et al. 2010) and this has been suggested to be an adaptation to low nutrient concentrations (Yooseph et al. 2010, Biller et al. 2014, Giovannoni 2017). It is possible that the lack of resting stages is a result of this genome streamlining (the genomes of Synechococcus elegantus PCC7942 and Synechocystis PCC6803 are ~3.2mbp and ~4mbp with their plasmids, respectively, compared to ~1.4-2.5 mbp for Prochlorococccus strains).
Surviving nutrient stress “with a little help from my friends”
Despite the clear effect of nutrient stress on Prochlorococcus in laboratory culture, manifesting in chlorosis and reduction of vitality, we observed relatively few less-active (potentially chlorotic) Prochlorococcus cells in the deep euphotic zone of the Eastern Mediterranean (approximately 5% of the population at 115m, Figure 5F). It is possible that cell stress and chlorosis change as a function of the diel cycle, and indeed previous studies have suggested Prochlorococcus cell mortality increases during the night (Llabrés et al. 2011, Ribalet et al. 2015). As the sampling of natural population in the Eastern Mediterranean Sea took place during the day (~12:00-16:00) we cannot exclude this hypothesis. Alternatively, Prochlorococcus may actually never experience nutrient starvation in the oceans. While physiological and molecular analyses of field populations of Prochlorococcus suggest that the cells are nutrient-limited (e.g. (Saito et al. 2014, Szul et al. 2019)), cell growth and death are usually balanced, suggesting these cells are not experiencing acute starvation (e.g. (Ribalet et al. 2015)). The ability of Prochlorococcus to thrive under conditions of extreme nutrient limitation is often explained by their small cell size (increasing their biomass-specific diffusion), their generally low nutrient requirements, and their specific metabolic strategies to minimize the per-cell elemental quotas (Van Mooy et al. 2006, Gilbert and Fagan 2011, Read et al. 2017). We propose that interactions with co-occurring microorganisms, e.g. through the recycling of inorganic nutrients or the exchange of organic compounds, enable Prochlorococcus to survive when these nutrient-saving mechanisms are not sufficient. Indeed, the observation that Prochlorococcus can compete with heterotrophic bacteria for amino acids (Zubkov et al. 2004), carbohydrates (Muñoz-Marín et al. 2013) and perhaps DMSP (Vila-Costa et al. 2006, Becker et al. 2019) suggests that mixotrophy is prevalent and important in natural communities. This is supported by genomic analyses (Rocap et al. 2003, Yelton et al. 2016). The importance of mixotrophy is not limited to organic forms of N, P or Fe, but can be extended to light (or resulting C) stress. Illustrating the potential magnitude of this effect, an average of ~8-10% of the Prochlorococcus cells at HOT and BATS (Hawaii and Bermuda time series study sites, respectively (Malmstrom et al. 2010)), are found under conditions where the average integrated illumination is not enough to support their growth under laboratory conditions (Sup Fig. S7, see supplementary text for more details (Moore and Chisholm 1999)). This includes the vast majority of LL adapted ecotypes. Previous studies have shown that uptake of glucose by Prochlorococcus cells in the central Atlantic Ocean can support up to ~20% of their carbon requirements, supporting the notion of mixotrophy (Muñoz-Marín et al. 2013, Muñoz-Marín et al. 2017). However, glucose uptake is light dependent and occurs at higher rates in the surface ocean, suggesting that some other form of DOC is likely important in the deep euphotic zone. Amino acids provide another potential DOC form, which can supply both N and C to the cells. Indeed, cell-specific amino acid uptake rates of Prochlorococcus from the southern Atlantic Ocean increase with depth, and high-fl cells take up more than low-fl cells, although to what extent this supports the C and N needs of the cells is unknown (Zubkov et al. 2004). Regardless of the specific forms of dissolved organic carbon being utilized by the cells, the lack of any mechanism for the production of resting stages by Prochlorococcus may be considered another manifestation of the “Black Queen Hypothesis”, which states that microorganisms “outsource” essential survival mechanisms such as detoxification of reactive oxygen species to the surrounding microbial community (Morris et al. 2012). These forms of microbial interactions likely affect the distribution and activity of Prochlorococcus on a global scale (Hennon et al. 2017, Ma et al. 2017).
Material and Methods
Prochlorococcus growth and Stable Isotope Incubations
Axenic Prochlorococcus strains were grown in Pro99 media under constant cold while light (27 μE) at 22 °C. Bulk chlorophyll fluorescence (FL) (ex440; em680) was measured almost daily using a Fluorescence Spectrophotometer (Cary Eclipse, Varian). In parallel, samples for flow cytometry were taken for cell numbers. When three distinct sub-populations appeared in the flow cytometry, the cultures were labeled with 1mM Sodium bicarbonate-13C and 1mM Ammonium-15N chloride (Sigma-Aldrich, USA) for 18-24 hours. The optimal incubation time based on preliminary isotope labeling experiments with Prochlorococcus MED (Supplementary figure 8). Incubations were stopped by fixing 2 ml of the culture with 2X EM grade glutaraldehyde (2.5% final concentration) and subsequently storing at 4 °C until the sorting analysis. Non-labeled cells that were killed before labeling (by adding 2.5% glutaraldehyde) were used as a negative control.
Cell Sorting and Filtration
Sorting of sub-population was carried out using a BD FACSAria III sorter (BD Biosciences) at the Life Sciences and Engineering Infrastructure Center, Technion, Israel. Each sample was sorted for 3 sub-populations: Non-chlorotic (High-fl), Semi chlorotic (Mid-fl) and Chlorotic (Low-fl) (Figure 2A). The sorting gates for each sub-population were determined from the population observed in forward scatter (FSC, a proxy for cell size) and auto-fluorescence (PerCP, chlorophyll auto-fluorescence). After sorting, the sorted sup-population were gently filtered on 13 mm diameter polycarbonate filters (GTTP, 0.2 μM pore size, Millipore, MA), washed twice with sterile sea water and air-dried. The filters were stored at 4 °C until nanoSIMS analyses.
Nanoscale secondary ion mass spectrometry (nanoSIMS) and data analysis
The samples were coated with a layer of ca. 30 nm gold with a Cressington 108 auto sputter coater (Watford, United Kingdom). Random spots were employed for NanoSIMS analyses. SIMS imaging was performed using a NanoSIMS 50L instrument (Cameca, Paris, France) at the Leibniz-Institute for Baltic Sea Research Warnemünde (IOW). A 133Cs+ primary ion beam was used to erode and ionize atoms of the sample. Images of secondary electrons, 12C−, 13C−, 12C14N− and 12C15N− were recorded simultaneously using mass detectors equipped with electron multipliers (Hamamatsu). The mass resolving power was adjusted to be sufficient to suppress interferences at all masses allowing, e.g. the separation of 13C− from interfering ions such as 12C1H−. Prior to the analysis, sample areas of 50×50 µm were sputtered for 2 min with 600 pA to erode the gold, clean the surface and reach the steady state of secondary ion formation. The primary ion beam current during the analysis was 1 pA; the scanning parameters were 512×512 pixels for areas of 30×30 to 48×48 µm, with a dwell time of 250 µs per pixel. 60 planes were analysed.
Analyses of NanoSIMS measurements
All NanoSIMS measurements were analysed with the Matlab based program look@nanosims (Polerecky et al., 2012). Briefly, the 60 measured planes were checked for inconsistencies and all usable planes accumulated, regions of interest (ROI’s) (i.e. Prochlorococcus cells and filter regions without organic material for background measurements) defined based on 12C14N mass pictures, and 13C/12C as well as 12C15N/12C14N ratios calculated from the ion signals for each region of interest.
Uptake rate calculation
Uptake rate was estimated using the following equation, based on that of (Legendre and Gosselin 1997), as follows:
 Where %P*t is the concentration (atom %) of the heavy isotope in the particulate matter at the end of the incubation, %D*i is the concentration of the dissolved tracer added to the incubation (and assumed not to change over the short incubation time), and %P*0 and %D*0 are the natural heavy isotope concentrations in the particulate and dissolved matter, respectively. We estimated Q, the cell quota (in fg cell−1) of C or N, based on measurements of the biomass of MED4 and MIT9313 (66 fg cell−1and 158 fg cell−1, respectively, (Cermak et al. 2016)) and assuming that C comprises 50% and N comprises 7.5% of the cell biomass. For heavy isotopes concentration in the particulate and dissolved phases before incubation we used the natural values for isotopic ratios of 13C and 15N (1.12% and 0.37% respectively). For the experiment shown in Supplementary Fig. 8, we measured the NH4+ concentration in the media and added the 15N tracer to 50% final concentration. Since all other experiments were performed in declining cultures we assumed that the NH4+ was depleted from the media, and thus %D*t was defined as 90%, based on previous measurements of NH4+ concentrations in old cultures. We used a value of 50% for the initial percentage of 13C, based on dissolved inorganic carbon (DIC) measurements (Grossowicz et al. 2017). For the terminal concentrations of 15N and 13C in the particulate phase (%P*t) we used the values of 13C/12C and 15N/14N that were obtained from the NanoSims analysis of the cells. 13C/12C and 15N/14N below the natural values resulted with negative uptake values, and were treated as zero uptake.
Mean and standard deviation of C and N uptake rates were calculated from the uptake rate values of individual cells (Table 1). The uptake rate values were not corrected for negative control (killed cells), which are presented for comparison in table 1. Since 13C/12C and 15N/14N values of individual cells were not normally distributed, for significance analysis we used non-parametric tests (Mann-Whitney and Kruskal-Wallis tests) performed using the Real Statistics Resource Pack software (Release 5.4 www.real-statistics.com).
Isotope labelling and phylogenetic analysis of a natural marine bacterioplankton population at sea Water collection and labelling experiment procedure
Mediterranean seawater was collected during August 2017 (station N1200, 32.45 degrees N, 34.37 degrees E) from 11 depths by Niskin bottles and divided into triplicates of 250 ml polycarbonate bottles. Two bottles from each depth were labeled with 1mM Sodium bicarbonate-13C and 1mM Ammonium-15N chloride (Sigma-Aldrich, USA) and all 3 bottles (2 labelled and 1 control) were incubated at the original depth and station at sea for 3.5 hours on day time. After incubation, bottles were brought back on board and the incubations were stopped by fixing with 2X EM grade glutaraldehyde (2.5% final concentration) and stored at 4 °C until sorting analysis.
DNA collection and extraction from seawater
Samples for DNA collected on a 0.22 µm sterivex filters (Millipore). Excess water was removed using a syringe and 1 ml Lysis buffer (40 mM EDTA, 50 mM Tris pH 8.3, 0.75 M sucrose) was added and both ends were closed with parafilm. Samples were kept at −80°C until extraction. DNA extracted by using a semi-automated protocol includes manually chemical cell lysis before the automated steps. The manual protocol began with thawing the samples, then the storage buffer was removed using a syringe and 170 µl lysis buffer added to the filter. 30 µl of Lysozyme (20 mg/ml) added to filters and incubate at 37°C for 30 min. After incubation, 20 µl proteinase K and 200 µl Buffer AL added to the tube for 1 hour at 56°C (with agitation). Then, the supernatant transferred to a new tube, which subjected to the QIAcube automated system (at the BioRap unit, Faculty of Medicine, Technion) following the manufacturer’s instructions using QIAamp DNA Mini Protocol: DNA Purification from Blood or Body Fluids (Spin Protocol) from step 6. All DNA samples were eluted in 100 μl DNA free distilled-water.
16S and ITS PCR amplification
PCR amplification of the ITS was carried out with specific primers for Prochlorococcus CS1_16S_1247F (5’-ACACTGACGACATGGTTCTACACGTACTACAATGCTACGG) and Cs2_ITS_Ar (5’-TACGGTAGCAGAGACTTGGTCTGGACCTCACCCTTATCAGGG) (Thompson et al. 2018). The first PCR was performed in triplicate in a total volume of 25 μl containing 0.5 ng of template, 12.5 μl of MyTaq Red Mix (Bioline) and 0.5 μl of 10 μM of each primer. The amplification conditions comprised steps at 95°C for 5 min, 28/25 (16S/ITS) cycles at 95°C for 30 sec, 50°C for 30 sec and 72°C for 1 min followed by one step of 5 min at 72°C. All PCR products validated on 1% agarose gel and triplicates were pooled. Subsequently, a second PCR amplification was performed to prepare libraries. These were pooled and after a quality control sequenced (2×250 paired-end reads) using an Illumina MiSeq sequencer. Library preparation and pooling were performed at the DNA Services (DNAS) facility, Research Resources Center (RRC), University of Illinois at Chicago (UIC). MiSeq sequencing was performed at the W.M. Keck Center for Comparative and Functional Genomics at the University of Illinois at Urbana-Champaign (UIUC).
ITS Sequence processing
Paired-end reads, in the format of fastq files were analyzed by the DADA2 pipeline (https://www.nature.com/articles/nmeth.3869). Quality of the sequences per sample was examined using the Dada2 ‘plotQualityProfile’ command. Quality filtering was done using the Dada2 ‘filterAndTrim’ command with parameters for quality filtering were truncLen=c(290,260), maxN=0, maxEE=c(2,2), truncQ=2, rm.phix=TRUE, trimLeft=c(20,20). Following error estimation and dereplication, the dada algorithm was used to correct sequences. Merging of the forward and reverse reads was done with minimum overlap of 4 bp. Detection and removal of suspected chimera was done with command ‘removeBimeraDenovo’. In total, 388,417 sequences in 484 amplicon sequence variants (ASVs) were counted. The ASVs were aligned in MEGA6 (Tamura et al. 2013) and the first ~295 nucleotides, corresponding to the 16S gene, were trimmed. The ITS sequences were then classified using BLAST against a custom database of ITS sequences from cultured Prochlorococcus and Synechococcus strains as well as from uncultured HL and LL clades.
Author contributions
DRR, DA, TLK, AV, MV and DS designed experiments, DRR, DA, TLK, LZ, NN and DS performed experiments and field analyses, DRR, DA, TLK, AV, and FE performed NanoSIMS analyses, DRR, DA, TLK, AV, LZ, FE, NN, HPG, MV and DS analyzed results, DRR, DA, TLK and DS wrote manuscript with contributions from all authors.
Competing interests
The authors declare no competing interests
Materials and Correspondence
Please send requests for materials or other correspondence to Daniel Sher, dsher{at}univ.haifa.ac.il
Acknowledgements
We thank the captain and crew of the R/V Mediterranean Explorer and Tom Reich, for help during the work at sea, Maya Lalzar for assistance with the bioinformatics analysis and Annett Grüttmüller NanoSIMS routine operation. This study was supported by grant RGP0020/2016 from the Human Frontiers Science Program (to MV, HPG and DS) and by grant number 1635070/2016532 from the NSF-BSF program in Oceanography (NSFOCE-BSF, to DS). The NanoSIMS at the Leibnitz-Institute for Baltic Sea research in Warnemuende (IOW) was funded by the German Federal Ministry of Education and Research (BMBF), grant identifier 03F0626A.
References
References for supplementary information


