

Abstract
We investigated the effects of brain tissue orientation, diffusion, and perivascular spaces on dynamic susceptibility contrast MRI. A 3D numerical model of a white matter voxel was created that consists of an isotropic capillary bed and anisotropic vessels that run in parallel with white matter tracts and are surrounded by perivascular spaces. The signal within the voxel was simulated by solving the Bloch-Torrey equation. Experimental perfusion data were acquired with a gradient echo dynamic susceptibility contrast scan. White matter fibre orientation was mapped with diffusion tensor imaging. Our numerical model of the contrast agent induced increase in R2*, as a function of tissue orientation, was fit to dynamic susceptibility contrast MRI data from thirteen subjects by minimizing the bias-corrected Akaike information criterion. White matter blood volume fraction in both the isotropic and the anisotropic vessels was determined as a free parameter, and results were analyzed as a function of diffusivity and perivascular space size. Total white matter blood volume was found to be 2.57%, with one third of the blood residing in blood vessels that run parallel with white matter tracts. Gradient echo dynamic susceptibility contrast MRI strongly depended on white matter tissue orientation and, according to the numerical simulations, this effect is amplified by diffusion and perivascular spaces.
Introduction
In dynamic susceptibility contrast (DSC) MRI, a paramagnetic contrast agent (CA) is injected during the acquisition of a rapid T2* or T2 weighted scan. The modification of the signal due to the presence of the CA within the vascular system allows for the computation of cerebral blood flow (CBF) and volume (CBV). In the brain’s white matter (WM), the vascular architecture consists of a structurally isotropic network of small vessels and larger vessels that, on average, run in parallel with the WM tracts1–3. The resulting vascular anisotropy causes gradient-echo (GRE) DSC MRI and the maps of cerebral blood flow and volume derived from this scan to exhibit a strong orientation dependency4. This phenomenon is caused by the orientation dependency of the field inhomogeneities that are created by the blood vessels and amplified by the paramagnetic CA. The field inhomogeneities around a vessel become stronger with increasing angle α between the vessel and B0. Therefore, the change in R2*created by a contrast agent not only depends on the CA concentration but also on tissue orientation. The orientation effect on the CA induced change in R2* (ΔR2*), as well as on CBF and CBV derived from ΔR2*, is on the order of 100%. Modeling the vascular architecture and signal loss due to static dephasing within the field inhomogeneities created by the vessels showed that the average blood volume in white matter is 2%, and that half of the blood resides in the anisotropic component of the vascular tree. While a model based on static dephasing fits the measured data reasonably well, diffusion of spins within the magnetic field inhomogeneities introducing further signal loss should be taken into account5. Furthermore, larger vessels are surrounded by perivascular spaces (PVS), which are filled with fluid and therefore have high diffusion coefficients and long T2 relaxation times6, which means that these PVS influence the DSC signal. Here, we investigate the extent to which diffusion and PVS impact the measured ΔR2* value as a function of WM fibre orientation in GRE DSC. We explore how the inclusion of diffusion and PVS into the fibre orientation dependent GRE DSC model influences the determined vascular parameters and the goodness of fit. In addition, we extend the 2D simulation used in a previous study of GRE DSC4 to the simulation of a 3D voxel in order to fully capture the effects of diffusion within the complex 3D anisotropic vascular architecture.
Materials and Methods
Data acquisition
This study was approved by the Clinical Research Ethics Board of our institution (H12-01153, 20 June 2012) and is in accord with the Declaration of Helsinki. All subjects gave written informed consent. Subjects and data acquisition are explained in detail in a previous publication for the same cohort4. In short, DSC (TR/TE = 2417/40 ms; 40 dynamics, reconstructed voxel size = 1.75 × 1.75 × 4 mm3; Magnevist 0.2 ml/kg body weight, 5 ml/s followed by 20 ml saline flush) and diffusion tensor imaging (DTI) data (TR/TE = 5640/75 ms; b = 1000, 32 directions, reconstructed voxel size = 1.88 × 1.88 × 2.5) from thirteen subjects with multiple sclerosis (MS) were acquired on a 3T scanner (Philips Achieva) equipped with an 8-channel SENSE head coil. Perfusion maps were registered to DTI using the linear image registration tool FLIRT from the FSL software package7. A WM mask was created using FSL’s FAST tool on the combination T1T2 = (T1 − T2)/ (T1 + T2) of a 3D T1-weighted sequence (TR/TE = 7.6/3.7 ms; reconstructed voxel size = 0.8 × 0.8 × 0.8 mm3) and a 3D T2-weighted sequence (TR/TE = 2500/363 ms; reconstructed voxel size = 0.8 × 0.8 × 0.8 mm3). Maps of local fibre orientation were computed from the DTI data as described previously8. Following motion correction of the DSC data, the change in R2* due to the contrast agent was calculated according to
 where TE is the echo time, S(t) is the signal at any time during the DSC experiment, for example at peak contrast agent concentration, and S0 is the signal without contrast agent9,10. The ΔR2* value for the peak contrast agent concentration was determined by taking the value at the time point with the lowest signal for each voxel, i.e. by computing a minimum intensity projection along the time axis of the motion corrected data. Then, ΔR2* in each WM voxel was sorted according to fibre angle α into bins of width 5∘ centred on angles ranging from 2.5∘ to 87.5∘.
Numerical model and parameter fit
Simulation of the transverse magnetization was performed within a 3D voxel containing isotropic and anisotropic blood vessels. The mean radius of the small isotropically oriented vessels was 7 μm11. The large vessels were variable in number and size and ran in parallel with the WM direction. The total blood volume fraction BVF determines the total number of vessels present, with an amount iBVF contained in the isotropic vasculature, and the remaining aBVF = BVF – iBVF contained in the anisotropic vasculature. Perivascular spaces were included which surround the large anisotropic vessels. These spaces are modeled as a hollow cylinders with inner radii equal to the anisotropic vessel radii and variable outer radii; the outer radius relative to the inner radius is denoted ρ, and the volume of the PVS relative to the contained anisotropic vessel is then given by ν = ρ2−1. Field inhomogeneities for a given vascular configuration were calculated by convolving the magnetic susceptibility distribution associated with the vascular tree with a unit dipole12. For the magnetic susceptibility of the contrast agent a value of 0.34 ppm/mM was used13. Within the voxel geometry, the transverse magnetization is propagated forward in time by solving the Bloch-Torrey equation
 up until the DSC scan’s echo time of 40 ms, as described in detail in a previous study14. Here, M is the complex transverse magnetization, D is the diffusion coefficient or diffusivity, and Γ(r) is the complex decay rate given by R2(r) + iω(r), with ω(r) being the local resonance frequency determined by the magnetic field. The parameters iBVF, aBVF, and the peak contrast agent concentration CA were optimized using weighted non-linear regression with MATLAB’s fmincon function, where the model residuals were weighted by the fraction of data points contained in each WM fibre orientation interval. The loss function applied to the weighted residuals which was minimized was the bias-corrected Akaike information criterion (AICc), as it performs better as a measure of comparing nonlinear models than traditional metrics such as the coefficient of determination (R2)15. The minimization was performed for a variable number of large vessels ranging from N = 1 to N = 9 with a diffusivity of D = 2 μm2ms−1 and a PVS volume of ν = 1X. To test the effects of changes in diffusion constant, simulations were performed for diffusivities ranging from D = 0 μm2ms−1 to D = 3 μm2ms−1 using the vascular geometry determined from the D = 2 μm2ms−1 and ν = 1X minimization. Similarly, simulations were performed with the same geometry, D = 2 μm2ms−1, and ν varying from 0X to 10X. The simulation results are shown in Figures 1B-E, with an example geometry voxel shown in Figure 1A.
Results
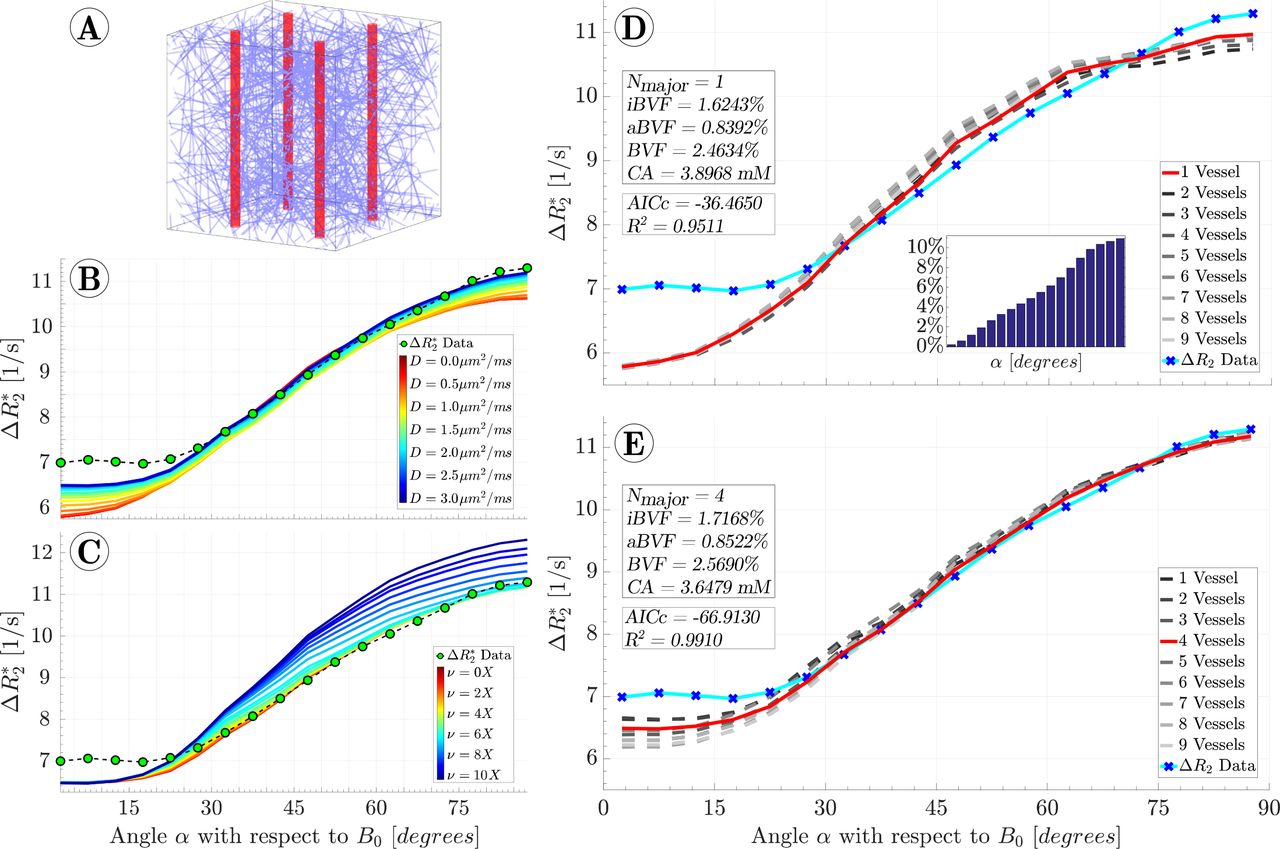
For static dephasing only and without PVS, i.e. D = 0 μm2ms−1 and ν = 0X, the best fit resulted in N = 1 anisotropic vessels, iBVF = 1.62%, aBVF = 0.84%, and a peak contrast agent concentration of 3.90 mM. Inclusion of diffusion with D = 2 μm2ms−1 and PVS with relative volume ν = 1X improved the model fit with the best fit resulting in N = 4 anisotropic vessels with corresponding radii of 43.7 μm, iBVF = 1.72%, aBVF = 0.85%, and a peak contrast agent concentration of 3.65 mM. The goodness of fit improved, as demonstrated by a decrease in AICc from −36.47 to −66.91; for comparison, R2 increased from 0.951 to 0.991. Holding PVS volume constant at ν = 1X and varying the diffusivity from D = 0 μm2ms−1 to D = 3 μm2ms−1 showed increasing ΔR values for all angles α, with the largest changes of 0.7 Hz occurring near α = 0° and α = 90° and the smallest changes of 0.3 Hz occurring near α = 45°. Holding diffusivity constant at D = 2 μm2ms−1 and varying the PVS volume from ν = 0X to ν = 10X showed ΔR2* increases which increase with α. The effect of PVS is modest for small volumes below ν = 3X, but quickly becomes large for larger volumes, with a maximal increase of 1.5 Hz occurring at α = 90° with ν = 10X. Detailed tables of all simulation results, including fit parameters and goodness of fit measures, are presented in the Supplementary Figure 1.

A) Example of a simulated voxel populated with an isotropic vascular bed and 4 anisotropic vessels. B) Simulations with the diffusivity varying from D = 0 μm2ms−1 to D = 3 μm2ms−1, showing that increases in D lead to increases in ΔR2*. The vascular parameters resulting from the fit in Figure 1D were used for each simulation. C) Simulations with the PVS volume varying from ν = 0X to ν = 10X, using the same vascular parameters as in (B) and a constant D of 2 μm2ms−1, showing that increased PVS volume also leads to increased ΔR2*. D) The best fit obtained with static dephasing. The histogram insert shows the percentage of voxels contained in each orientation interval which were used as weights in all fitting procedures. Note that the distribution of the number of voxels in each interval is due to a geometric effect: the fraction of uniformly randomly oriented vectors with angle α with respect to B0 is proportional to sin(α). E) The best fit obtained when diffusion is included in the model results in a total blood volume of 2.57%. About one third of the blood resides in vessels that run in parallel with white matter tracts.
Discussion
We extended previously published work for gradient echo DSC by incorporating the effects of diffusion and perivascular spaces, as well as by simulating a 3D voxel instead of a 2D slice of a voxel. Diffusion was found to increase the simulated ΔR2*value independently of the orientation of the WM fibres with respect to B0, providing further confirmation that diffusion mediated signal loss is dominated by isotropic vasculature as opposed to anisotropic vasculature. However, the effect of diffusion around the larger anisotropic vessels is further augmented by the fluid within PVS, which has a high diffusion coefficient. This finding agrees well with the optimized parameter values of iBVF = 1.72% and aBVF = 0.85%, indicating that approximately two-thirds of WM vasculature is comprised by isotropic vessels. The total blood volume fraction in WM associated with the best fit was 2.57%, agreeing well with literature values, which report a white matter blood volume ranging from 1.3% to 2.6%16–18, and also with the 2D simulation of static dephasing, where a total blood volume of 2% was reported4. In particular, our result is in excellent agreement with the total blood volume of 2.6% determined with positron emission tomography16, which is considered the gold standard for cerebral blood volume measurements. With neither diffusion nor PVS included in the model, the total blood volume was found to be 2.46%. Inclusion of diffusion and PVS improved the goodness of fit of the model, as measured by both AICc and R2. Nevertheless, the vascular parameters computed with the extended model are not very different from the static dephasing model, since the increase in R2* due to the contrast agent is dominated by static dephasing. However, a static dephasing model is not able to estimate the calibre of the anisotropic vessels. With diffusion, the size of these vessels starts to play a role, because diffusion has a larger effect around small vessels than around large vessels. Surprisingly little is known about the architecture and function of PVS. For example, very recent work demonstrated that PVS shrink by 90% during fixation19. We are aware of only one study where the effects of PVS on quantitative MRI were investigated. Sepehrband et al. showed that diffusion tensor imaging measures, such as fractional anisotropy and mean diffusivity, are biased by PVS20. These authors demonstrate that this effect is due to the high diffusivity of the fluid within the PVS, and to the restricted diffusion of PVS fluid in the direction perpendicular to the vessel axis.
It should be emphasized that for non-linear models, R2 is not the best measure of goodness of fit. Nevertheless, it is often reported even for non-linear models. Here, we report R2 in addition to AICc because it allows for a more intuitive comparison of fit quality. In the previous work in the same cohort, using 2D simulation and static dephasing, we obtained a lower total blood volume of 2%, but peak contrast agent concentration was higher at 7.6 mM and the anisotropic vascular volume was 50% of the total volume 4. Using spin echo DSC data obtained in a different cohort of healthy volunteers, we found that 56% of the blood is contained in the anisotropic component of the vascular tree14, similar to the 66% found in this work. It should be noted that in the previous study on static dephasing we used a radius of 13.7 μm for the isotropic vasculature, which was obtained from a study on vessel size imaging with MRI21. However, we believe that the value of 7 μm determined directly with microscopy is more reliable11.
The data collected for this study was from patients with multiple sclerosis. Due to the administration of contrast agent, this study could not have been performed on healthy patients. Compared to perfusion measurements arising from e.g. stroke or tumour, MS has the smallest impact on the vascular architecture. Nevertheless, since MS is a neurodegenerative disease that alters myelin, one may naturally be concerned with inferring WM fibre tract orientation from DTI of MS patients. However, this issue is a minor one for several reasons. First, regions containing MS lesions comprise only a small fraction of the total WM volume. Even the orientation dependency of the R2* decay, which is directly influenced by myelin, does depend on whether MS lesions are included in the analysis or not8. Second, myelination of WM tracts is not required for DTI in the first place. For example, Figure 1 in a study by Vinall et al.22 shows a map of principal diffusion direction weighted with the fractional anisotropy acquired in an infant at 30 weeks postmenstrual age, i.e. approximately 10 weeks premature. All prominent WM structures are clearly visible and their orientations are well defined, despite little to no myelination of the WM tracts at this age.
Multiple sclerosis may also increase the relative size of the PVS due WM atrophy 23, and PVS size is also known to increase with age24. Moreover, CBF and CBV were generally found to be reduced in the normal appearing white matter in MS25. While the finding that PVS have an influence on DSC measurements remains valid, the size of the PVS estimated herein should therefore not be generalized to other populations. Due to the orientation dependence of DSC, previous findings in WM in patient studies should be interpreted with caution. In particular CBF and CBV in MS lesions, which are usually traversed by a vein26, may be strongly influenced by the vein’s orientation.
One limitation of the current model is that water molecules are allowed to freely move across the boundary between outside and inside the vessels. This simplification may explain the large differences in ΔR2* between static dephasing and the extended model at small angles, as this is where the difference in field strength between interior and exterior of the vessels is largest. Note, however, that the weights at low angles are small due to the small number of voxels contributing to these data. Therefore, fits are relatively insensitive to the behaviour at small angles. Moreover, since vessels occupy less than 3% of the tissue volume, the error caused by this simplification is small. It should also be kept in mind that this approach only provides information on average WM vasculature. There will be voxels with considerably more or less vascular anisotropy than this average. Furthermore, voxels which have low fractional anisotropy and/or contain crossing fibres have a less well defined local fibre orientation. However, since WM voxels were pooled from across the entire WM and averaged, such WM tract specific differences in vascular architecture are averaged away.
In summary, we show that the effects of the paramagnetic contrast agent on the MR signal are modulated by the anisotropic vascular architecture and by diffusion within perivascular spaces, resulting in a strong orientation dependency of gradient echo DSC.
Author Contributions
JD: data analysis, numerical simulations, interpretation of results, writing of manuscript; CK: numerical simulations; EHT: data analysis; AT: data acquisition, interpretation of results; AR: idea, study supervision, interpretation of results, writing of manuscript.
Acknowledgments and Funding
This work was funded by the Natural Sciences and Engineering Research Council of Canada (016-05371) and the National Multiple Sclerosis Society (RG-1507-05301). JD was funded by the Natural Sciences and Engineering Research Council of Canada (USRA-497681-2016). AR is funded by Canada Research Chairs. All raw data and code are available from the authors upon request.
Footnotes
Parts of this work have been presented as an oral presentation at ISMRM 2018.
Abbreviations
- (WM)
- White Matter
- (PVS)
- Perivascular Space
- (DSC)
- Dynamic Susceptibility Contrast
- (CA)
- Contrast Agent
- (aBVF)
- Anisotropic Blood Volume Fraction
- (aBVF)
- Isotropic Blood Volume Fraction
References


