

Abstract
Motor planning plays a critical role in producing fast and accurate movement. Yet, the neural processes that occur in human primary motor and somatosensory cortex during planning, and how they relate to those during movement execution, remain poorly understood. Here we used 7T functional magnetic resonance imaging (fMRI) and a delayed movement paradigm to study single finger movement planning and execution. The inclusion of no-go trials and variable delays allowed us to separate what are typically overlapping planning and execution brain responses. Although our univariate results show widespread deactivation during finger planning, multivariate pattern analysis revealed finger-specific activity patterns in contralateral primary somatosensory cortex (S1), which predicted the planned finger movements. Surprisingly, these activity patterns were similarly strong to those found in contralateral primary motor cortex (M1). Control analyses ruled out the possibility that the detected information was an artifact of subthreshold movements during the preparatory delay. Furthermore, we observed that finger-specific activity patterns during planning were highly correlated to those during movement execution. These findings reveal that motor planning activates the specific S1 and M1 circuits that are engaged during the execution of a finger movement – while activity in S1 and M1 is overall suppressed. We propose that preparatory states in S1 may improve movement control through changes in sensory processing or via direct influence of spinal motor neurons.
Significance statement Motor planning is important for good motor performance, yet it is unclear which neural processes underlie the preparation of the nervous system for an upcoming movement. Using high-resolution functional neuroimaging, we investigated how the planning of finger movements changes the activity state in primary motor (M1) and somatosensory (S1) cortex, and how brain responses during planning and execution relate to each other. We show that planning leads to finger-specific activation in both M1 and S1, which is highly similar to the finger-specific activity patterns elicited during movement execution. Our findings suggest that even S1 is being specifically prepared for an upcoming movement, either to actively contribute to the outflowing motor command or to enable movement-specific sensory gating.
Introduction
Animals are capable of generating a wide variety of dexterous behaviors accurately and effortlessly on a daily basis. This remarkable ability relies on the motor system reaching the appropriate preparatory state before each movement is initiated. At the level of behavior, the process of motor programming, or planning, has long been shown to be beneficial to performance (1–3), leading to faster reaction times (4–6) and more accurate response selection (7–10). The behavioral study of motor planning has spurred the neurophysiological investigation of what movement parameters are specified in the neuronal firing of a number of cortical regions including the dorsal premotor cortex, PMd (11–13), the supplementary motor area, SMA (14), and the posterior parietal cortex, PPC (15–17). Building on this work, human neuroimaging studies have shown that activity in parieto-frontal brain regions during planning of prehension movements can be used to decode several movement properties such as grip type (18, 19), action order (20), and effector (21–24). At the level of neural population dynamics (25), motor planning can be understood as bringing the neuronal state towards an ideal preparatory point. Once this state is reached and the execution is triggered, the intrinsic dynamics of the system then let the movement unfold (26, 27). While the neuronal correlates of movement planning have largely been studied in non-human primates using upper limb movements, such as reaching and grasping, motor planning also plays a crucial role in fine hand control (7).
Despite their importance for everyday dexterous behaviors such as typing, writing, or tying a knot, finger movements have not been closely investigated at the single neuron level. In humans, previous fMRI studies of finger movements have not separated planning from execution (28–35). Therefore, we have an incomplete picture of how motor planning readies the human sensorimotor system for the production of individuated finger movements. Based on previous work in reaching, we expected that the primary motor cortex (M1) should represent movements during both planning and execution (36–38). What is unclear, however, is whether the primary somatosensory cortex (S1) also receives information about the planned movement before movement onset. Furthermore, we currently do not know how brain representations of planned finger movements relate to those during movement execution. To address these gaps, we designed a high-field (7T) fMRI experiment to study what brain regions underlie the planning of individual finger movements. We used no-go trials and variable delays to temporally separate the evoked responses to movement planning and execution, and advanced multivariate pattern analyses to examine the correspondence between fMRI correlates of planned and executed finger movements.
Results
Deactivation in sensorimotor regions during planning of finger movements
We instructed 22 participants to plan and execute repeated keypresses with individual fingers of their right hand on a keyboard device while being scanned with 7T fMRI. The key to be pressed corresponded to one of three fingers (thumb, middle, and little) and was cued during the preparation phase by numbers on the screen (1=thumb, 3=middle, 5=little, e.g., Fig. 1A).

A. Example trial with timing information. Background colors indicate different experimental phases (yellow = preparation; green = movement (go) or wait (no-go); purple = reward; gray = inter-trial interval, ITI). B. Group-averaged BOLD response (N = 22) for go (blue) and no-go (orange) trials in a region that shows no planning evoked activity (Left M1, top), and one that shows some planning evoked activity (Left aSPL, bottom). Shaded areas indicate standard error of the mean (SEM). Background colors correspond to trial phases as in A.
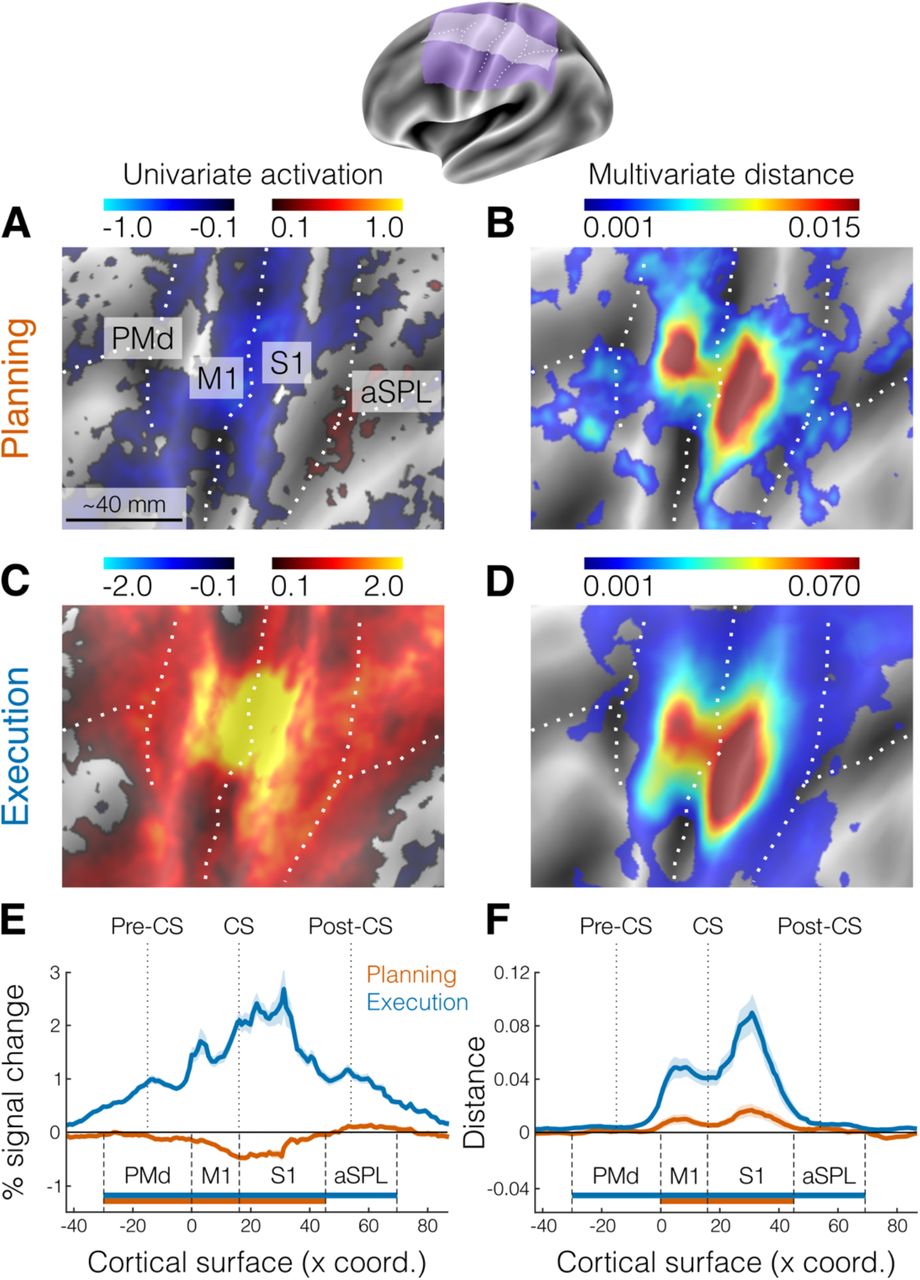
After a variable delay (4–8 seconds), participants received a color cue indicating whether to press the planned finger (go trials), or whether to withhold the response (no-go trials). Upon the go cue, participants had to initiate the correct response as fast as possible and make 6 presses of the designated finger, before receiving accuracy points for reward (see Methods). To control for involuntary overt movements during the preparation phase, we required participants to maintain a steady force on all of the keys during the delay, which was closely monitored online. To ensure that planning results would not be biased by the subsequent execution, we restricted all our analyses to no-go trials without a subsequent movement (see Methods). First, we asked which brain regions showed an evoked response during the planning of finger movements (e.g., Fig. 1B). We focused our analysis on the lateral aspect of the contralateral (left) hemisphere (purple and white areas of the Fig. 2 inset) which included premotor, primary motor, primary somatosensory, and anterior parietal cortical regions. To examine brain activation during finger planning, we performed a univariate contrast of the preparation phase (across the three fingers) versus the resting baseline (Fig. 2A). Overall, the instruction stimulus evoked little to no activation in our regions of interest (ROIs, Fig. 2A). In fact, compared to resting baseline, we observed significant deactivation (Fig. 2E) in dorsal premotor cortex (PMd, t21= −2.642, p = 0.015), primary motor cortex (M1, t21 = −7.592, p = 1.887e-07), and primary somatosensory cortex (S1, t21 = −6.618, p = 1.491e-06). In comparison, movement execution strongly activated M1 and S1 (Fig. 2C), with activation being significant in all our ROIs (Fig. 2E, all t21 > 14.469, all p < 2.153e-12).

The inset shows the inflated cortical surface of the contralateral (left) hemisphere, highlighting the area of interest (purple) and the strip used for cross-section analysis (white). Major sulci are indicated by white dotted lines. A. Univariate activation map (percent signal change) for the contrast planning>baseline (no-go trials only). B. Multivariate searchlight map of the mean crossnobis distance between the planning of the three fingers (no-go trials only). C. Same as A, but for the univariate contrast execution>baseline. D. Same as B, but for the mean crossnobis distance between fingers during movement execution. E. Cross-section analysis of the mean percent signal change (± SEM) during planning (orange) and execution (blue). Horizontal bars indicate significance (p < 0.05) in a 2-sided one-sample t-test vs zero for selected ROIs. F. Same as E, but for the mean crossnobis distance (± SEM). Pre-CS = precentral sulcus; CS = central sulcus; Post-CS = postcentral sulcus; PMd = dorsal premotor cortex; M1 = primary motor cortex; S1 = primary somatosensory cortex; aSPL = anterior superior parietal lobule.
Planning induces informative patterns in primary motor and somatosensory cortex
Although we found little univariate activation in our main ROIs, preparatory processes need not increase the overall activation in a region. Rather, the region could converge to a specific preparatory neural state (26), while activity increments and decrements within the region (i.e., at a finer spatial scale) average each other out. In this case, information about planned movements would be present in the multivoxel activity patterns in that region. To test this idea, we calculated the crossnobis dissimilarity (see Methods) between activity patterns. Systematically positive values of this dissimilarity measure indicate that the patterns reliably differentiate between the different planned actions (39, 40). Indeed, a surface-based searchlight approach (41) revealed reliably positive crossnobis dissimilarity between the activity patterns related to planning of individual finger movements (Fig. 2B) in both M1 (t21 = 2.734, p = 0.012) and S1 (t21 = 2.987, p = 0.007, Fig. 2F).
Surprisingly, the distribution of these informative patterns was highly similar to the distribution of information during movement execution (Fig. 2D). Visual inspection suggested that the informative patterns during planning may be concentrated more dorsally in M1 and S1 relative to execution. However, a Hotelling T2 test revealed no systematic difference in the location of the peak vertex between planning and execution across subjects (M1: T22,20 = 0.725, p = 0.712; S1: T22,20 = 2.424, p = 0.335). Thus, our results show that information about single finger movements is already represented during motor planning in the same parts of the primary motor and somatosensory cortices that are engaged during execution of the movements. Given that we only used the activity estimates from no-go trials (~40% of total trials), this information cannot be explained by a spill-over from subsequent execution-related activity. An analysis using the estimates of planning activity from all trials yielded very similar results (see Fig. S1), demonstrating that we could separate planning from execution-related signals.
Activity patterns are not caused by small movements during the preparation phase
The presence of planning-related information in primary sensorimotor regions was surprising, especially in S1, where it had not previously been reported in comparable fMRI studies (18, 20). To ensure that these results were not caused by overt movement, participants were instructed to maintain a steady force on the keyboard during the preparation phase, such that we could monitor even the smallest involuntary preparatory movements. Inspection of the average force profiles (Fig. 3A) revealed that participants were successful in maintaining a stable force between 0.2 and 0.4 N during preparation. However, averaging forces across trials may obscure small, idiosyncratic patterns visible during individual trials (Fig. 3B) that could be used to distinguish the different movements. To test for the presence of such patterns, we submitted both the mean and standard deviation of the force traces on each finger to a multivariate dissimilarity analysis (see Methods).

A. Mean finger force (± SEM) plotted in 10 ms bins, time-aligned to instruction onset (dotted vertical line) and end of the preparation phase (dashed vertical lines), separately for the three fingers and go (blue) and no-go (orange) trials. B. Example of an individual trial with a 6 s preparation phase, followed six presses of the little finger (green). Horizontal solid line denotes press threshold (1 N). Dash-dotted lines denote the boundaries of the finger pre-activation red area in Fig. 1A (see Methods). RT = reaction time; MT = movement time. C. Pearson’s correlation (r) between behavioral and neural distances in M1 and S1 (see Methods) during the preparation phase (planning, orange). Each dot represents an individual participant (N = 22). Solid line shows linear regression, p-values refers to the slope of the line. D. Same as C, but during the movement phase (execution, blue).
Indeed, this sensitive analysis revealed that some participants showed small movement patterns predictive of the upcoming finger (Fig. 3C). These differences, however, were ~200-300 times smaller than the average differences during execution (Fig. 3D). More importantly, the magnitude of the behavioral differences for the preparation phase was uncorrelated to the amount of planning information present in sensory-motor regions (both p-values for the slope of the linear fit > 0.3). Even after correcting for the influence behavioral patterns, the informative patterns in M1 and S1 remained significant, as shown by a significantly positive intercept in the linear fit in Fig. 3C (M1: p = 0.032; S1: p = 0.007). Thus, the finding of finger-specific activity patterns in M1 and S1 cannot be explained by small involuntary movements during the preparation phase.
Single finger activity patterns from planning to execution are positively correlated
How do planning-related activity patterns in M1 and S1 relate to the activity patterns observed during execution? Neurophysiological experiments have suggested that patterns of movement preparation are orthogonal – or uncorrelated – to the patterns underlying active movement (42). This arrangement allows movement preparation to occur without causing overt movement. When we compared the planning- and execution-related activity patterns as measured with fMRI, a technique that samples neuronal activity at a much coarser spatial resolution, we found the opposite result. Planning- and movement-related patterns for the same finger were tightly related. Inspection of the representational dissimilarity matrices (RDMs) for M1 and S1 (Fig. 4A), clearly shows that the biggest difference was between planning and execution patterns, which can also be seen in a 3D representation of the representational geometry (PC1 in Fig. 4B). Within each phase, the pattern for the thumb was more distinct than those for the other fingers, replicating previous results from execution alone (28, 29).

A. Representational dissimilarity matrices (RDMs) of the activity patterns evoked by the three fingers during the preparation (no-go planning, orange) and movement (execution, blue) phases, separately for the two main ROIs (M1, left; S1, right). B. Multidimensional scaling (MDS) projection of the RDMs in A highlighting the first principal component (PC 1, difference between planning and execution). The black cross denotes resting baseline. C. Same as B, but rotated view to highlight the representational geometries for PC 2 and PC 3. D. Pattern component modelling (PCM) evaluation of models of different correlations between planning- and execution-related activity patterns (x-axis). Shown is the group-average of the individual log-likelihood (± SEM) curve expressed as a difference from the mean log-likelihood across models. Horizontal gray bars indicate models that perform statistically equivalently (p > 0.05) to the best fitting model (determined in a cross-validated fashion, see Methods). Red dots indicate points of individually best fitting correlations (N = 22). Red dashed lines denote the average winning models across participants. Dotted lines show the projections of horizontal bars and dashed lines on the respective axes.
Importantly, however, a rotated view of the representational geometry (Fig. 4C) showed that the finger patterns were arranged in a congruent way, with planning and execution related activity patterns for the same finger being closer to one another. To more precisely quantify the correspondence between planning and execution pattern for each finger, we used Pattern Component Modeling (PCM, 43) to evaluate the likelihood of the data, assuming a true correlation between 0 and 1. This approach automatically corrects for the biasing effect of measurement noise, which would lead to simple empirical pattern correlations to be lower than the true correlation. From the individual fits, we found that the average best correlation model was at 0.83 (± 0.053 SEM) for M1 and at 0.81 (± 0.061 SEM) for S1 (Fig. 4D, dashed lines). Using a cross-validated approach (see Methods), we compared the log-likelihoods to test whether the best fitting model was significantly better than any of the other correlation models. In both ROIs, the best fitting model was significantly better than the zero-correlation model (i.e., activity patterns across planning and execution totally uncorrelated, both p < 0.005), but not better than the one-correlation model (i.e., activity patterns are scaled version of each other, both p > 0.1). By applying this method to every other model, we have evidence that the true (i.e., noiseless) correlation between planning and execution finger-specific activity pattern was between 0.41–1.0 in M1 and between 0.54–1.0 in S1 (Fig. 4D, horizontal bars). In sum, at the resolution of fMRI, the process of movement planning seems to induce a finger-specific pattern which very similar, and possibly identical, to the pattern activated during movement execution.
Discussion
In the present study, we asked participants to produce repeated single finger movements while undergoing 7T fMRI. We used a variable preparatory delay and no-go trials to cleanly dissociate the brain responses to the consecutive preparation and movement phases. We found that information about planned finger movements is present in both S1 and M1 before movement onset, even though the overall level of activation in these regions was below resting baseline. Moreover, while execution elicited much higher brain activation, the fine-grained, finger-specific activity patterns were highly similar across planning and execution. Control analyses confirmed that the observed results were not caused by pre-movement finger activity.
Our finding that motor planning activates M1 in a finger-specific fashion was not necessarily surprising given many neurophysiological studies reporting anticipatory activity of M1 neurons related to movement intentions (37, 44, 45), as well as human neuroimaging showing shared information between delayed and immediate movement plans (36). In contrast, the robust activity patterns related to single finger planning in S1 were more surprising, given that this region is often considered to be mostly concerned with processing incoming sensory information from tactile and proprioceptive receptors arising after movement onset (18, 20–22). So, what could then be the role of S1 during movement planning?
First, it is worth noting that there are substantial projections from S1 (Brodmann area 3a) that terminate in the ventral horn of the cortico-spinal tract (46, 47). Although stimulation of area 3a in macaques typically fails to evoke overt movements (48), it has been suggested that this population of cortico-motoneurons specifically projects to gamma motoneurons that control the sensitivity of muscle spindle afferents (47). Thus, it is possible that S1 plays an active role in movement generation by preparing the spindle apparatus in advance of the movement.
Second, the finger-specific preparatory state in S1 may reflect the anticipation or prediction of the upcoming sensory stimulation, allowing for a movement-specific sensory gain control (49). Some sensory stimuli could become attenuated to maintain movement stability and filter out irrelevant or self-generated signals. Indeed, multiple studies have shown that both somatosensation and somatosensory-evoked potentials in S1 decrease during voluntary movement (50–53). Alternatively, sensory processing of the expected salient signals could be enhanced to improve movement execution and adaptation.
Very recently, a human electrocorticography (ECoG) study suggested a possible role for S1 in cognitive-motor imagery (54). The authors recorded neural activity from S1 while a tetraplegic participant imagined reaching movements and found that S1 neurons encoded movement direction during motor imagery in the absence of actual sensations. While the authors raise the concern that their results may be unique to individuals who have lost their main peripheral input, our finding of encoding of movement-related information in S1 before the onset of a movement suggests that movement-specific information in S1 without actual movement is a general phenomenon in the intact human motor system. Our findings are also consistent with a second recent ECoG study in non-human primates (55). During a delayed reaching and grasping task, the authors showed movement-specific information in the ECoG signals from S1 well before movement initiation, and only slightly later than in M1. Together, these results suggest that the somatosensory system not only passively receives signals from the external world but also actively processes them via interactions with anticipatory information from the motor system.
One may wonder why such movement-specific encoding in S1 during planning has not been reported in previous human fMRI studies. One contributing reason may be that we had higher sensitivity to detect these signals than previous studies, as we used finger rather than arm movements (the former having more distinct cortical representation in S1), higher field strength (7T) and spatial resolution, and a more sensitive multivariate analysis method (crossnobis dissimilarity vs. pattern classification, Walther et al., 2016).
Our second main finding – the close correspondence between finger-specific activity patterns across planning and execution – appears to be at odds with the idea that these two processes occupy orthogonal neural subspaces to avoid overt movement during planning (42, 56). We think that there are at least two possible explanations for this. First, the divergence of results could be caused by the difference between spatially directed arm movements and non-spatial finger movements. If for single finger movements even single-neuron activity patterns are highly correlated between planning and execution, then overt movement during planning would need to be actively suppressed, for example through the deactivation that we observed around the central sulcus. An alternative and perhaps more likely explanation of the discrepancy lies in the different measurement modalities. While the orthogonality was observed in electrophysiological recordings of individual neurons, the fMRI measurements we employed here mainly reflect excitatory postsynaptic potentials (57) and average metabolic activity across hundreds of thousands of cortical neurons. Thus, it is possible that planning pre-activates the specific cortical columns in M1 and S1 that are also most active during movement of that finger. Within each of these cortical micro-circuits, however, planning-related activity could still be orthogonal to the activity observed during execution at the single neuron level (e.g., see Arbuckle et al., 2020, for a similar observation for cortical representations of flexion and extension finger movements). This would suggest a new hypothesis for the architecture of the sensory-motor system where movement planning pre-activates the movement-specific circuits in M1 and S1. However, it does so in a fashion that the induced planning-related activity is, in terms of the firing output of neurons, orthogonal to the patterns during movement execution.
Methods
Participants
Twenty-three right-handed neurologically healthy participants volunteered to take part in the experiment (13 F, 10 M; age 20–31 years, mean 23.43 years, SD 4.08 years). Criteria for inclusion were right-handedness and no prior history of psychiatric or neurological disorders. Handedness was assessed with the Edinburgh Handedness Inventory (mean 82.83, SD 9.75). All experimental procedures were approved by the Research Ethics Committee at Western University. Participants provided written informed consent to procedures and data usage and received monetary compensation for their participation. One participant withdrew before study completion and was excluded from data analysis (final N = 22).
Apparatus
Repeated presses of right-hand finger movements were performed on a custom-made MRI-compatible keyboard device (Fig. 1A). The keys of the device did not move but force transducers underneath each key measured isometric force production at an update rate of 2 ms (Honeywell FS series; dynamic range 0-25 N; sampling 200 Hz). A keypress/release was detected when the force crossed a threshold of 1 N. The forces measured from the keyboard were low-pass filtered to reduce noise induced by the MRI environment, amplified, and sent to PC for online task control and data recording.
Task
We used a task in which participants produced repeated keypresses with their right-hand fingers in response to numerical cues appearing on the screen (white outline, Fig. 1A). On each trial, a string of 6 numbers (instruction) instructed which fingers to plan (1 = thumb, 3 = middle, 5 = little). After a variable delay (4, 6, or 8 s randomly sampled from a geometric distribution with p = 0.5; preparation phase, yellow background), participants received a color cue (go/no-go cue) indicating whether to perform the planned finger movements (blue outline = go, p = 0.6), or not (orange outline = no-go, p = 0.4). The role of no-go trials was to de-couple the hemodynamic response to the successive planning and execution events. To encourage planning during the delay period, at the go/no-go cue the digits were masked with asterisks, and participants had to perform the movements from memory (movement phase, green background). Participants had 2.5 seconds to complete the movement phase, and a vanishing white bar under the asterisks indicated how much time was left to complete all of the keypresses. To limit and monitor unwanted movements during the preparation phase, we required participants to pre-activate their fingers by maintaining a steady force of around 0.2-0.3 N on all of the keys during the Preparation phase. As a visual aid, we displayed a red area (between 0 and 0.5 N) and asked participants to remain within the middle of that range with all the fingers (touching either boundary of the red area would incur an error, counting as unwanted movement). In the case of a no-go trial, participants were instructed to remain as still as possible maintaining the finger pre-activation until the end of the movement phase (i.e., releasing any of the keys would incur an error). During the movement phase participants also received online feedback on the correctness of each press with asterisks turning either green, for a correct press, or red, for incorrect presses. After the movement phase, participants received points based on their performance (reward phase, 0.5 s, purple background). Participants were instructed to perform the movements as accurately as possible. As long as they remained within task constraints (i.e., 6 keypresses in less than 2.5 seconds), an exact movement speed was not enforced. On a trial-by-trial basis, during the reward phase participants received points for their performance according to the following scheme: −1 point in case of no-go error or go cue anticipation (timing errors); 0 points for pressing any wrong key (press error); 1 point in case of a correct no-go trial; and 2 points in case of a correct go trial. Inter-trial-intervals (ITIs) varied between 1 and 16 seconds within the domain ITI = {1, 2, 4, 8, 16}. To reduce the overlap in brain responses from one trial to the next, actual ITIs were randomly picked from a geometric distribution with p = 0.5. This meant a higher probability of shorter intervals (1 and 2 s) and occasional very long intervals (8 and 16 s). The design was optimized to minimize the variance inflation factor (VIF):
 the ratio of the mean estimation variance of all the regression weights (planning- and execution-related regressors for each finger), and the mean estimation variance had these regressors been estimated in isolation. For our design, the average VIF was quite low, on average between 1 and 1.2, indicating that we could separate planning and execution related activity without a large loss of experimental power.
Design
Participants underwent one fMRI session consisting of 10 functional runs and 1 anatomical scan. In an event-related design, we randomly interleaved 3 types of repeated single finger movements involving the thumb (1), the middle (3), and the little (5) fingers (e.g., 111111 for thumb movement, Fig. 1A) and 3 types of multi finger sequences (e.g., 135315). The day before the fMRI scan, participants familiarized themselves with the experimental apparatus and the go/no-go paradigm in a short behavioral session of practice outside the scanner (5 blocks, about 15-30 min in total). For the behavioral practice, inter-trial intervals were kept to a fixed 1 s to speed up the task, and participants were presented with different sequences from what they would see while in the scanner. These 6-item sequences were randomly selected from a pool of all possible permutations of the numbers 1, 3, and 5, with the exclusion of sequences that contained consecutive repetitions of the same number. Given that the current paper is concerned with the relationship between representations of simple planning and execution, here we will focus only on the results for single finger movements. The results for multi finger sequences will be reported in a future paper. Each single finger trial type (e.g., 111111) was repeated 5 times (2 no-go and 3 go trials), totalling 30 trials per functional run. Two periods of 10 s rests were added at the beginning and at the end of each functional run to allow for signal relaxation and provide a better estimate of baseline activation. Each functional run took about 5.5 minutes and the entire scanning session (including the anatomical scan and setup time) lasted for about 75 minutes.
Imaging data acquisition
High-field functional magnetic resonance imaging (fMRI) data were acquired on a 7T Siemens Magnetom scanner with a 32-channel head coil at Western University (London Ontario, Canada). The anatomical T1-weighted scan of each participant was acquired halfway through the scanning session (after the first 5 functional runs) using a Magnetization-Prepared Rapid Gradient Echo sequence (MPRAGE) with voxel size of 0.75×0.75×0.75 mm isotropic (field of view = 208 × 157 × 110 mm [A-P; R-L; F-H], encoding direction coronal). To measure the blood-oxygen-level dependent (BOLD) responses in human participants, each functional scan (330 volumes) used the following sequence parameters: GRAPPA 3, multi-band acceleration factor 2, repetition time [TR] = 1.0 s, echo time [TE] = 20 ms, flip angle [FA] = 30 deg, slice number: 44, voxel size: 2×2×2 mm isotropic. To estimate and correct for magnetic field inhomogeneities, we also acquired a gradient echo field map with the following parameters: transversal orientation, field of view: 210 × 210 × 160 mm, 64 slices, 2.5 mm thickness, TR = 475 ms, TE = 4.08 ms, FA = 35 deg.
Preprocessing and univariate analysis
Preprocessing of the functional data was performed using SPM12 (fil.ion.ucl.ac.uk/spm) and custom MATLAB code. This included correction for geometric distortions using the gradient echo field map (58), and motion realignment to the first scan in the first run (3 translations: x, y, z; 3 rotations: pitch, roll yaw). Due to the short TR, no slice timing corrections were applied. The functional data were co-registered to the anatomical scan, but no normalization to a standard template or smoothing was applied. To allow magnetization to reach equilibrium, the first four volumes of each functional run were discarded. The pre-processed images were analyzed with a general linear model (GLM). We defined separate regressors for each combination of the 6 finger movements (single, multi) × 2 phases (preparation, movement). To control for the effect of potential spill-over of movement execution activity on the preceding planning activity, we also estimated a separate GLM with separate regressors for the preparation phases of go and no-go trials, resulting in a total of 18 regressors (12 go + 6 no- go), plus the intercept, for each run. Each regressor consisted of a boxcar function (on for 2 s of each phase duration and off otherwise) convolved with a two-gamma canonical hemodynamic response function with a peak onset at 5 s and a post-stimulus undershoot minimum at 10 s (Fig. 1B). Given the relatively low error rates (single: 8.51 ± 1.52 %, multi: 17.21 ± 3.38 %; timing errors, single: 7.58 ± 0. 62 %, multi: 10.23 ± 0.85 %; press errors, single: 1.18 ± 0.26 %, multi: 9.04 ± 1.03 %), all trials were included to estimate the regression coefficients, regardless of whether the execution was correct or erroneous. Ultimately, the first-level analysis resulted in activation images (beta maps) for each of the 18 conditions per run, for each of the participants.
Surface reconstruction and ROI definition
Individual subject’s cortical surfaces were reconstructed using Freesurfer (59). First, we extracted the white-gray matter and pial surfaces from each participant’s anatomical image. Next, we inflated each surface into a sphere and aligned it using sulcal depth and curvature information to the Freesurfer average atlas (Fischl et al., 1999). Both hemispheres in each participant were then resampled into Workbench’s 164k vertex grid. This allowed us to compare similar areas of the cortical surface in each participant by selecting the corresponding vertices on the group atlas. Anatomical regions of interest (ROIs) were defined using a probabilistic cytoarchitectonic atlas (61) projected onto the common group surface. Our main ROIs were defined bilaterally as follows: primary motor cortex (M1) was defined by including nodes with the highest probability of belonging to Brodmann area (BA) 4 within 2 cm above and below the hand knob anatomical landmark (62); primary somatosensory cortex (S1) was defined by the nodes related to BA 1, 2 and 3; dorsal premotor cortex (PMd) was defined as the lateral part of the middle frontal gyrus; finally, the anterior part of the superior parietal lobule (aSPL) included areas anterior, superior and ventral to the intraparietal sulcus (IPS). ROI definition was carried out separately in each subject using FSL’s subcortical segmentation. When resampling functional onto the surface, to avoid contamination between M1 and S1 activities, we excluded voxels with more than 25% of their volume in the grey matter on the opposite side of the central sulcus.
Multivariate distance analysis
To detect single finger representations across the cortical surface, we used representational similarity analysis (RSA; Diedrichsen and Kriegeskorte, 2017; Walther et al., 2016) with a surface-based searchlight approach (64). For each node, we selected a region (the searchlight) corresponding to 100 voxels (12 mm disc radius) in the gray matter and computed cross-validated Mahalanobis (crossnobis, Walther et al., 2016) dissimilarities between pairs of evoked activity patterns (beta estimates from first level GLM) of single finger sequences, during both preparation and movement phases. Prior to calculating the dissimilarities, beta weights for each condition were spatially pre-whitened (i.e., weighted by the matrix square root of the noise covariance matrix, as estimated from the residuals of the GLM. The noise covariance matrix was slightly regularized towards a diagonal matrix (65).
Multivariate pre-whitening has been shown to increase the reliability of dissimilarity estimates (39). The resulting analyses (one RDM per participant containing the dissimilarities between the three single fingers during planning and execution: 6 conditions, 15 dissimilarity pairs) were then assigned to the central node and the searchlight was moved across all nodes across the surface sheet obtaining a cortical map (Fig. 2B-2D). Cross-validation ensures the distances estimates are unbiased, such that if two patterns differ only by measurement noise, the mean of the estimated value would be zero. This also means that estimates can sometimes become negative. Therefore, dissimilarities significantly larger than zero indicate that two patterns are reliably distinct, similar to an above-chance performance in a cross-validated pattern-classification analysis. Additionally, to the searchlight analysis, the multivariate analysis was conducted separately for each anatomically defined ROI (e.g., Fig. 4A).
Correlation between behavioral and neural distances
To ensure that our planning results were not contaminated by unwanted micro-movements during the preparation phase, we calculated the behavioral distance between sequences on the basis of keyboard force data and correlated behavioral and neural distances. For behavioral distances, we first extracted force data (2 ms temporal resolution, smoothed with a gaussian kernel of 9.42 full width at half maximum, FWHM) and binned it in 10 ms steps (down sampling largely due to memory constraints) for both the preparation and movement phases (Fig. 3A). Next, for each subject, we calculated the mean (5) and the standard deviation (5) of the time-averaged force of each finger for each condition (3 sequences × 2 phases = 6) and block (10). These subject-specific finger force patterns (60 × 10) were multivariately pre-whitened using their covariance matrix. Finally, we calculated the cross-validated squared Euclidean distances for each condition (6 × 6 RDM) and averaged distances between the 3 finger movements for each phase (preparation, movement). These mean finger force distances for each subject were correlated with the mean voxel activity distances from the two phases for 2 ROIs (M1 and S1, Fig. 3C-3D).
Pattern component modelling correlation models
We used pattern component modelling (PCM) to quantify the correspondence of sequence-specific activity patterns across planning and execution (43). This method has been shown to be advantageous in estimating correlations. In contrast to simple Pearson’s or cross-validated correlation estimated from raw activity patterns, PCM separately models the noise and signal components. We created 100 correlation models with correlations in the range [0–1] in equal step sizes and assessed the likelihood of the observed data from each participant under each model. Fig. 4D shows average log-likelihoods for each model, relative to the mean log-likelihood across models. Differences between the log-likelihoods can be interpreted as log-Bayes factors. Group inferences were performed using a simple t-test on log-likelihoods. To compare each model to the best fitting model, we had to correct for the bias arising from picking the best model and testing it on the same data: We used n-1 subjects to determine the group winning model, and then chose the log-likelihood of this model for the left-out subject (for whom this model may not be the best one) as the likelihood for the “best” model. This was repeated across all subjects and a one-sided paired-sample t-test was performed on the recorded log-likelihood and every other model. This test revealed which of the correlation models were significantly worse (i.e., associated with a lower log-likelihood) than the winning model that was independently estimated via cross-validation.
Supplementary figures

A. Activation map (percent signal change) for the contrast planning>baseline. The selected area of interest is the same as shown in purple in the inset of Fig. 2A. B. Crossnobis distance searchlight map for movement planning. C. Same as A, but for the contrast execution>baseline. D. Same as B, but for movement execution. E-F. Cross-section analysis corresponding to the same area shown in white in the inset of Fig. 2A. E. Mean percent signal change (± SEM) during planning (orange) and execution (blue). F. mean crossnobis distance (± SEM). Horizontal bars indicate significance (p < 0.05) in a 2-sided one-sample t-test against zero. All other figure conventions are the same as in Fig. 2.
Acknowledgements
This work was supported by a NSERC Discovery Grant (RGPIN-2016-04890) awarded to J.D., and the Canada First Research Excellence Fund (BrainsCAN). The authors wish to thank Eva Berlot for helpful discussions and contributions to data analysis.
Footnotes
Disclosures. The authors declare no conflicts of interest.
References


