

Abstract
Using a dataset of somatic Structural Variants (SVs) in cancers from 2658 patients—1220 with corresponding gene expression data—we identified hundreds of genes for which the nearby presence (within 100kb) of an SV breakpoint was associated with altered expression. For the vast majority of these genes, expression was increased rather than decreased with corresponding SV event. Well-known up-regulated cancer-associated genes impacted by this phenomenon included TERT, MDM2, CDK4, ERBB2, and IGF2. For specific gene categories, associated SVs were found to potentially impact on the order of 2-4% of cases across various types. SVs upstream of TERT involved ~3% of cancer cases and were most frequent in liverbiliary, melanoma, sarcoma, stomach, and kidney cancers. For many genes, SVs were significantly associated with either an increase or decrease in the numbers of enhancer regulatory elements near the promoter. DNA methylation near the gene promoter was often increased with nearby SV breakpoint.
Introduction
Functionally relevant DNA alterations in cancer extend well beyond exomic boundaries. One notable example of this involves TERT, for which both non-coding somatic point mutations in the promoter or genomic rearrangements in proximity to the gene have been associated with TERT up-regulation1-3. Genomic rearrangements in cancer are common and often associated with copy number alterations4,5. Conceivably, breakpoints associated with rearrangement could alter the regulation of nearby genes, e.g. by disrupting specific regulatory elements or by translocating regulatory elements from elsewhere in the genome into close proximity to the gene. The Pan-Cancer Analysis of Whole Genomes (PCAWG) initiative has recently assembled over 2600 whole cancer genomes from multiple independent studies representing a wide range of cancer types. These data represent an opportunity for us to survey these cancers for somatic structural variants (SVs) with breakpoints located in proximity to genes. For a sizeable subset of these cancers, data from other platforms in addition to whole genome sequencing, such as RNA expression or DNA methylation, are available for integrative analyses. With a genome-wide analysis, information from multiple genes may be leveraged effectively in order to identify common features involving the observed disrupted regulation of genes impacted by genomic rearrangement.
Results
Widespread impact of somatic SVs on gene expression patterns in cancer
Inspired by recent observations in kidney cancer3,6, neuroblastoma7,8, and B-cell malignancies9, of recurrent genomic rearrangements affecting the chromosomal region proximal to TERT and resulting in its up-regulation, we sought to carry out a pan-cancer analysis of all coding genes, for ones appearing similarly affected by rearrangement. We referred to a dataset of somatic SVs called for whole cancer genomes of 2658 patients, representing more than 20 different cancer types and compiled and harmonized by the PCAWG initiative from 47 previous studies (Table S1). Gene expression profiles were available for 1220 of the 2658 patients. We set out to systematically look for genes for which the nearby presence of an SV breakpoint could be significantly associated with changes in expression. In addition to the 0-20 kb region upstream of each gene (previously involved with rearrangements near TERT3), we also considered SV breakpoints occurring within a gene body, 0-20kb upstream of a gene, 20-50kb upstream of a gene, 50-100kb upstream of a gene, or 0-20kb downstream of a gene (Figure 1a). (SVs located within a given gene were not included in the other upstream or downstream SV sets for that same gene.) For each of the above SV groups, we assessed each gene for correlation between associated SV event and expression. As each cancer type as a whole would have a distinct molecular signature10, and as genomic rearrangements may be involved in copy alterations4, both of these were factored into our analysis, using linear models.

(a) Numbers of SV breakpoints identified as occurring within a gene body, 0-20kb upstream of a gene, 20-50kb upstream of a gene, 50-100kb upstream of a gene, or 0-20kb downstream of a gene. For each SV set, the breakdown by alteration class is indicated. SVs located within a given gene are not included in the other upstream or downstream SV sets for that same gene. (b) For each of the SV sets from part a, numbers of significant genes (p<0.001), showing correlation between SV event and expression. Numbers above and below zero point of y-axis denote positively and negatively correlated genes, respectively. Linear regression models also evaluated significant associations when correcting for cancer type (red) and for both cancer type and gene copy number (green). (c) Heat map of significance patterns for genes from part b (from the model correcting for both cancer type and gene copy number). Red, significant positive correlation; blue, significant negative correlation; black, not significant (p>0.05); gray, not assessed (less than 3 SV events for given gene in the SV set). (d) Significantly enriched Gene Ontology (GO) terms for genes positively correlated (p<0.001) with occurrence of SV upstream of the gene (for either 0-20kb, 20-50kb, or 50-100kb SV sets). P-values by one-sided Fisher’s exact test. (e) Patterns of SV versus expression for selected gene sets from part d (telomerase holoenzyme complex, top; eukaryotic translation initiation factor 2B complex, middle; insulin receptor binding, bottom). Differential gene expression patterns relative to the median across sample profiles. See also Tables S1 and S2.
For each of the genomic regions relative to genes that were considered (i.e. genes with at least three samples associated with an SV within the given region), we found widespread associations between SV event and expression, after correcting for expression patterns associated with tumor type or copy number (Figure 1b and Table S2). For gene body, 0-20kb upstream, 20-50kb upstream, 50-100kb upstream, and 0-20kb downstream regions, the numbers of significant genes at p<0.001 (corresponding to estimated false discovery rates11 of less than 5%) were 518, 384, 416, 496, and 302, respectively. For each of these gene sets, many more genes were positively correlated with SV event (i.e. expression was higher when SV breakpoint was present) than were negatively correlated (on the order of 95% versus 5%). Permutation testing of the 0-20kb upstream dataset (randomly shuffling the SV event profiles and computing correlations with expression 1000 times) indicated that the vast majority of the significant genes observed using the actual dataset would not be explainable by random chance or multiple testing (with permutation results yielding an average of 30 “significant” genes with standard deviation of 5.5, compared to 384 significant genes found for the actual dataset). Without correcting for copy number, even larger numbers of genes with SVs associated with increased expression were found (Figure 1b), indicating that many of these SVs would be strongly associated with copy gain. Many of the genes found significant for one SV group were also significant for other SV groups (Figure 1c).
Key driver genes in cancer impacted by nearby SVs
Genes with increased expression associated with nearby SVs included many genes with important roles in cancer (Table 1), such as TERT (significant with p<0.001 for regions from 0-20kb downstream to 20-50kb upstream of the gene), MYC (significant for gene body SVs), MDM2 (regions from 0-20kb downstream to 50-100kb upstream), CDK4 (0-20kb downstream and 20-100kb upstream), ERBB2 (gene body to 50-100kb upstream), and IGF2 (0-20kb downstream and 50-100kb upstream). Genes with decreased expression associated with SVs located within the gene included PTEN (n=50 out of 1220 cases with an SV and expression data), STK11 (n=15), KEAP1 (n=5), TP53 (n=22), RB1 (n=55), and SMAD4 (n=18), where genomic rearrangement would presumably have a role in disrupting important tumor suppressors. Examining the set of genes positively correlated (p<0.001) with occurrence of SV upstream of the gene (for either 0-20kb, 20-50kb, or 50-100kb SV sets), enriched gene categories (Figure 1d) included G-protein coupled receptor activity (70 genes), telomerase holoenzyme complex (TERT, PTGES3, SMG6), eukaryotic translation initiation factor 2B complex (EIF2S1, EIF2B1, EIF2B5), keratin filament (15 genes), and insulin receptor binding (DOK6, DOK7, IGF2, IRS4, FRS2, FRS3, PTPN11). When taken together, SVs involving the above categories of genes would potentially impact a substantial fraction of cancer cases, e.g. on the order of 2-5% of cases across various types (Figure 1e). Gene amplification events (defined as five or more copies) could be observed for a number of genes associated with SVs, but amplification alone in many cases would not account for the elevated gene expression patterns observed (Figure 1e).
Genes positively correlated in expression (p<0.001, corrected for copy number and cancer type) with occurrence of upstream SV, with the gene being previously associated with cancer.
Translocations involving the region 0-100kb upstream of TERT were both inter- and intrachromosomal (Figure 2a and Table S3) and included 170 SV breakpoints and 84 cancer cases, with the most represented cancer types including liver-biliary (n=29 cases), melanoma (n=17 cases), sarcoma (n=15 cases), and kidney (n=9 cases). Most of these SV breakpoints were found within 20kb of the TERT start site (Figure 2b), which represented the region where correlation between SV events and TERT expression was strongest (Figure 2c, p<1E-14, linear regression model). In neuroblastoma, translocation of enhancer regulatory elements near the promoter was previously associated with TERT up-regulation7,8. Here, in a global analysis, we examined the number of enhancer elements12 within a 0.5 Mb region upstream of each rearrangement breakpoint occurring in proximity to TERT (for breakpoints where the SV mate was oriented away from TERT). While for unaltered TERT, 21 enhancer elements are located 0.5 Mb upstream of the gene, on the order of 30 enhancer elements on average were within the 0.5 Mb region adjacent to the TERT SV breakpoint (Figure 2d), representing a significant increase (p<1E-6, paired t-test). A trend was also observed, by which SVs closer to the TERT start site were associated with a larger number of enhancer elements (Figure 2d, p=0.03, Spearman’s correlation).
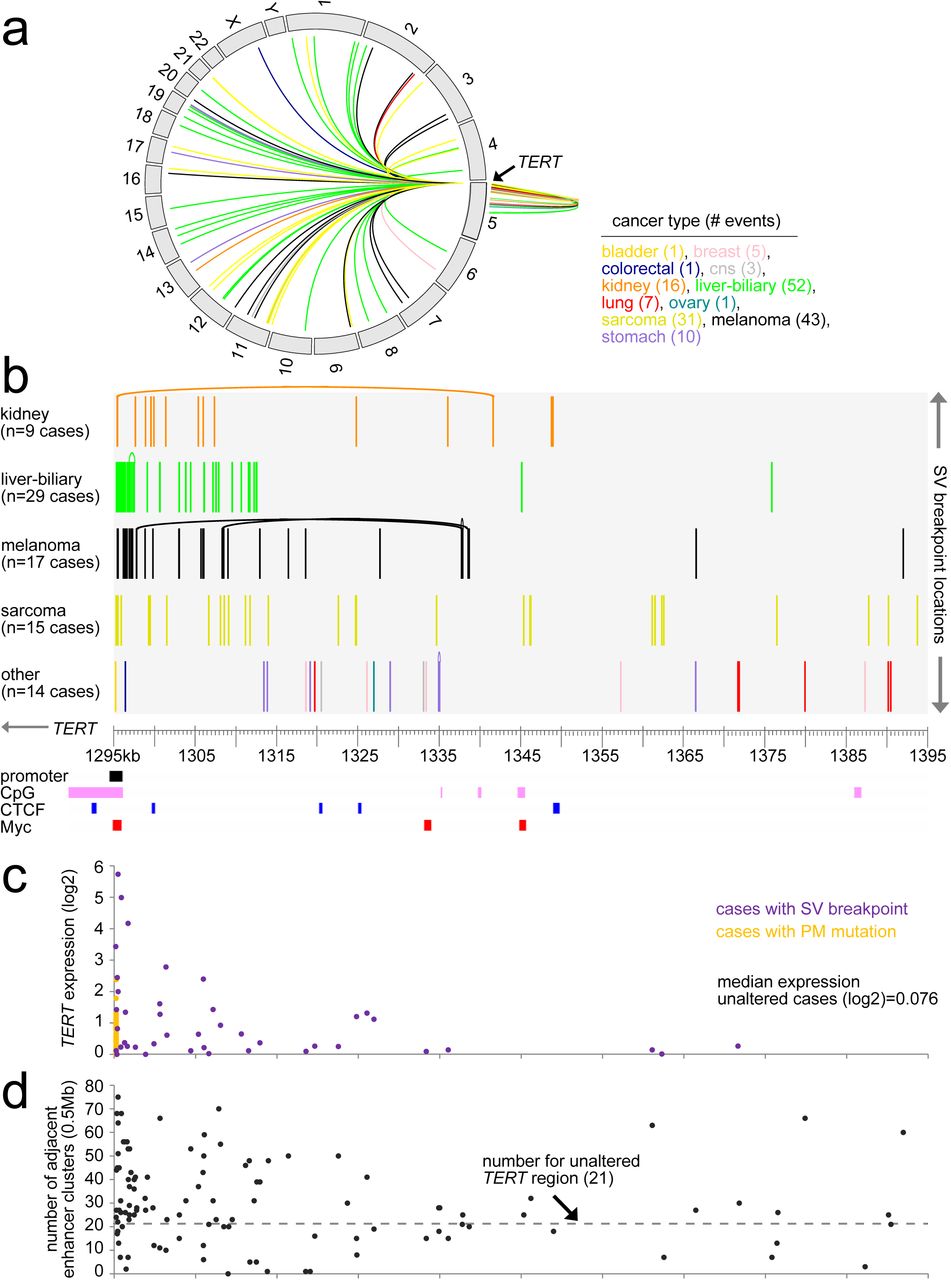
(a) Circos plot showing all intra- and interchromosomal rearrangements 0-100kb from the TERT locus. (b) By cancer type, SV breakpoint locations within the region ~100kb upstream of TERT. Curved line connects two breakpoints common to the same SV. TERT promoter, CpG Islands, and CTCF and Myc binding sites along the same region are also indicated. (c) Where data available, gene expression levels of TERT corresponding to SVs from part a. Where multiple SVs were found in the same tumor, the SV breakpoint that was closest to the TERT start site was used for plotting the expression. Expression levels associated with TERT promoter (PM) mutation are also represented. Median expression for unaltered cases represents cases without TERT alteration (SV, mutation, amplification, viral integration) or MYC amplification. (d) Numbers of enhancer elements within a 0.5 Mb region upstream of each rearrangement breakpoint are positioned according to breakpoint location. For unaltered TERT, 21 enhancer elements are 0.5 Mb upstream of the gene. See also Table S3.
Consistent with observations elsewhere4, genomic rearrangements could be associated here with copy alterations for a large number of genes (Figure 1b), including for genes of particular interest including TERT and MDM2 (Figure 3a). However, copy alteration alone would not account for all observed cases of increased expression in conjunction with SV event. For example, with a number of key genes (including TERT, MDM2, ERBB2, CDK4), if all amplified cases (i.e. with five or more gene copies) were grouped into a single category, regardless of SV breakpoint occurrence, the remaining SV-involved cases showed significantly increased expression (Figure 3b). Regarding TERT in particular, a number of types of genomic alteration may act upon transcription, including upstream SV, TERT amplification13, promoter mutations1,2, promoter viral integration14, and MYC amplification15. Within the PCAWG cohort of 2658 cancer cases, 933 (35%) were altered according to at least one of the above alteration classes, with each class being associated with increased TERT mRNA expression (Figure 3c). Upstream SVs in particular were associated with higher TERT as compared to promoter mutation or amplification events.

(a) For 1220 cancer cases, copy number versus expression for TERT (left) and MDM2 (right). Cases with SV events upstream of the gene are indicated. (b) Box plots of expression for TERT, MDM2, ERBB2, and CDK4 by alteration class (“amp.” or gene amplification: 5 or more copies, SV within gene body, SV 0-20kb downstream of gene, SV 0-20kb upstream of gene, SV 20-50kb upstream of gene, SV 50-100kb upstream of gene, or none of the above, i.e. “unaligned”). Cases with both SV and amplification are assigned here within the amplification group. (c) Left: Alterations involving TERT (SV 0-50kb upstream of gene, somatic mutation in promoter, viral integration within TERT promoter, 5 or more gene copies of TERT or MYC) found in the set of 1220 cancers cases having both WGS and RNA data available. Right: Box plot of TERT expression by alteration class. “TERT amp” group does not include cases with other TERT-related alterations (SV, mutation, viral). P-values by Mann-Whitney U-test. n.s., not significant (p>0.05). Box plots represent 5%, 25%, 50%, 75%, and 95%. Points in box plots are colored according to tumor type as indicated in part c.
SVs associated with translocated enhancers and altered DNA methylation near genes
Similar to analyses focusing on TERT (Figure 2d), we examined SVs involving other genes for potential translocation of enhancer elements. For example, like TERT, SVs 0-20kb upstream of CDK4 were associated with an increased number of upstream enhancer elements as compared to that of the unaltered gene (Figure 4a); however, SVs upstream of MDM2 were associated with significantly fewer enhancer elements compared to that of the unaltered region (Figure 4a). For the set of 1233 genes with at least 7 SVs 0-20kb upstream and with breakpoint mate on the distal side from the gene, the numbers of enhancer elements 0.5 Mb region upstream of rearrangement breakpoints was compared with the number for the unaltered gene (Figure 4b and Table S4). Of these genes, 24% showed differences at a significance level of p<0.01 (with ~12 nominally significant genes being expected by chance). However, for most of these genes, the numbers of enhancer elements was decreased on average with the SV rather than increased (195 versus 103 genes, respectively), indicating that translocation of enhancers might help explain the observed upregulation for some but not all genes.

(a) For TERT, ERBB2, CDK4, and MDM2, average number of enhancer elements within a 0.5 Mb region upstream of each rearrangement breakpoint (considering the respective SV sets occurring 0-20kb upstream of each gene), as compared to the number of enhancers for the unaltered gene. All differences are significant with p<0.01 (paired t-test). Error bars denote standard error. (b) For 1233 genes with at least 7 SVs 0-20kb upstream and with breakpoint mate on the distal side from the gene, histogram of t-statistics (paired t-test) comparing numbers of enhancer elements 0.5 Mb region upstream of rearrangement breakpoints with the number for the unaltered gene. Positive versus negative t-statistics denote greater versus fewer enhancers, respectively, associated with the SVs. (c) Histogram of t-statistics for correlation between gene expression and DNA methylation (by Pearson’s using log-transformed expression and logit-transformed methylation), for both the entire set of 8256 genes (blue) associated with CpG islands represented on DNA methylation array platform and the subset of 263 genes (red) on methylation platform and positively correlated in expression (p<0.001, “OE” for “over-expressed”) with occurrence of upstream SV (for either 0-20kb, 20-50kb, or 50-100kb SV sets). (d) Histogram of t-statistics for correlation between gene expression and SV event (by Pearson’s using logit-transformed methylation), for both the entire set of 2316 genes (blue) with at least 3 SVs 0-20kb upstream and represented on methylation platform and the subset of 97 genes (red) on methylation platform and positively correlated in expression (p<0.001) with occurrence of SV 0-20kb upstream. (e) DNA methylation of the CpG site cg02545192 proximal to the TERT core promoter in cases with SV 0-20kb or 20-50kb upstream of TERT, in cases with TERT promoter (PM) activation mutation, in cases with TERT amplification (“amp.”), and in the rest of cases (unaligned). P-values by t-test on logit-transformed methylation beta values. Box plots represent 5%, 25%, 50%, 75%, and 95%. Points in box plots are colored according to tumor type as indicated. See also Tables S4 and S5.
We went on to examine genes impacted by nearby SVs for associated patterns of DNA methylation. Taking the entire set of 8256 genes with associated CpG island probes represented on the 27K DNA methylation array platform (available for samples from The Cancer Genome Atlas), the expected overall trend16 of inverse correlations between DNA methylation and gene expression were observed (Figure 1c). However, for the subset of 263 genes positively correlated in expression with occurrence of upstream SV (p<0.001, 0-20kb, 20-50kb, or 50-100kb SV sets), the methylation-expression correlations were less skewed towards negative (p=0.0001 by t-test, comparing the two sets of correlation distributions in Figure 1c). Genes positively correlated between expression and methylation included TERT and MDM2, with many of the same genes also showing a positive correlation between DNA methylation and nearby SV breakpoint (Figure 1d). Regarding TERT, a CpG site located in close proximity to its core promotor is known to contain a repressive element8,17; non-methylation results in the opening of CTCF binding sites and the transcriptional repression of TERT17. In the PCAWG cohort, SV breakpoints occurring 0-20kb upstream of the gene were associated with increase CpG island methylation (Figure 1e), while SV breakpoints 20-50kb upstream were not; TERT promoter mutation was also associated with increased methylation (Figure 1e).
Discussion
Using a unique dataset of whole genome sequencing and gene expression on tumors from a large number of patients and involving a wide range of cancer types, we have shown here how a phenomenon previously identified for TERT is global and would impact a large proportion of genes and of cancer cases. Genomic rearrangements involved with up-regulation of TERT have furthermore been shown here to involve a wider range of cancer types, expanded from previous observations made in kidney chromophobe and neuroblastoma. While many of the genes impacted by genomic rearrangement likely represent passengers rather than drivers of the disease, many other genes with canonically established roles in cancer would be impacted. Though any given gene may not be impacted in this way in a large percentage of cancer cases (the more frequently SV-altered gene TERT involving less than 3% of cancers surveyed), the multiple genes involved leads to a large cumulative effect in terms of absolute numbers of patients. The impact of somatic genomic rearrangements on global gene expression should therefore be regarded as an important driver mechanism in cancer, alongside that of somatic point mutations, copy number alteration, epigenetic silencing, and germline polymorphisms.
Future efforts can explore the mechanisms involved with specific genes deregulated by nearby genomic rearrangements. Regarding TERT-associated SVs, it has been suggested that the observed increase in DNA methylation of the affected region would be the result of massive chromatin remodeling brought about by juxtaposition of the TERT locus to strong enhancer elements8. However, not all genes found here to be deregulated by SVs would necessarily follow the same patterns as those of TERT. For example, not all of the affected genes would have repressor elements being inactivated by DNA methylation, and some genes such as MDM2 do not show an increase in enhancer numbers with associated SVs but do correlate positively between expression and methylation. There is likely no single mechanism that would account for all of the affected genes, though some mechanisms may be common to multiple genes. Integration of other types of information (e.g. other genome annotation features, data from other platforms, or results of functional studies) may be combined with whole genome sequencing datasets of cancer, in order to gain further insights into the global impact of non-exomic alterations, where the datasets assembled by PCAWG in particular represent a valuable resource.
Methods
Datasets
Datasets of structural variants (SVs), RNA expression, somatic mutation, and copy number were generated as part of the Pan-Cancer Analysis of Whole Genomes (PCAWG) project. In all, 2671 patients with whole genome data were represented in the PCAWG datasets, spanning a range of cancer types (bladder, sarcoma, breast, liver-biliary, cervix, leukemia, colorectal, lymphoma, prostate, eosophagus, stomach, cns, head/neck, kidney, lung, skin, ovary, pancreas, thyroid, uterus). For SVs, calls were made by three different data centers using different algorithms; calls made by at least two algorithms were used in the downstream analyses. For copy number, the calls made by the Sanger group were used. For somatic mutation of TERT promoter, PCAWG variant calls, as well as any additional data available from the previous individual studies3,14,18,19, were used. TERT promoter viral integrations were obtained from ref14. Of the 2658 cases, RNA-seq data were available for 1220 cases. For RNA-seq data, alignments by both STAR and TopHat2 were used to generated a combined set of expression calls; FPKM-UQ values (where UQ= upper quartile of fragment count to protein coding genes) were used. Where a small number of patients had multiple tumor sample profiles, one profile was randomly selected to represent the patient. DNA methylation profiles had been generated for 771 cases by The Cancer Genome Atlas using either the Illumina Infinium HumanMethylation450 (HM450) or HumanMethylation27 (HM27) BeadChips (Illumina, San Diego, CA), as previously described20. To help correct for batch effects between methylation data platforms (HM450 versus HM27), we used the combat software21. For each of 8226 represented genes, an associated methylation array probe mapping to a CpG island was assigned; where multiple probes referred to the same gene, the probe with the highest variation across samples was selected for analysis.
Integrative Analyses
Gene boundaries and locations of enhancer elements were obtained from Ensembl (GRCh37 build). Enhancer elements found in multiple cell types (using Ensembl “Multicell” filter) were used12. For each SV 0-20kb upstream of a gene, the number of enhancer elements near the gene that would be represented by the rearrangement was determined (based on the orientation of the SV mate). Gene copies of five or more were called as amplification events. For a given set of SVs associated with a given gene, correlation between expression of the gene and the presence of an SV was assessed using a linear regression model (with log-transformed expression values). In addition to modeling expression as a function of SV event, models incorporating cancer type (one of the 20 major types listed above) as a factor in addition to SV, and models incorporating both cancer type and copy number were also considered. For these linear regression models, genes with at least three samples associated with an SV within the given region were considered. Genes for which SVs were significant (p<0.001) after correcting for cancer type and copy numbers were explored in downstream analyses. The method of Storey and Tibshirini11 was used to estimate false discovery rates for significant genes.
Statistical Analysis
All P-values were two-sided unless otherwise specified.
Acknowledgements
This work was supported in part by National Institutes of Health (NIH) grant P30CA125123 (C. Creighton) and Cancer Prevention and Research Institute of Texas (CPRIT) grant RP120713 C2 (C. Creighton).
Abbreviations
- PCAWG
- the Pan-Cancer Analysis of Whole Genomes project
- SV
- Structural Variant
References


