

ABSTRACT
Aims Eicosapentaenoic acid (EPA) is consumed in low levels in the western diet. Increased consumption of EPA may prevent impairments in insulin-glucose homeostasis that contribute toward cardiometabolic disorders. Here we investigated how EPA, through the biosynthesis of its downstream metabolites, prevents metabolic impairments driven by diet-induced obesity.
Methods and Results Long-term administration of pure EPA ethyl esters to C57BL/6J male mice improved obesity-induced glucose intolerance, hyperinsulinemia, and hyperglycemia. Supporting analyses of National Health and Nutrition Examination Survey data revealed fasting glucose levels of obese adults were inversely related to EPA intake in a sex-dependent manner and were dependent on the ratio of linoleic acid to EPA. We next investigated potential mechanisms by which EPA improved hyperinsulinemia and hyperglycemia. 16S rRNA sequencing showed EPA supplementation did not remodel the gut microbiome composition relative to obese mice. Subsequent untargeted and targeted mass spectrometry analyses revealed distinct modifications in the lipidome. Notably, EPA overturned the obesity-driven decrement in the concentration of 18-hydroxyeicosapentaenoic acid (18-HEPE) in metabolic tissues. Therefore, we probed if administration of the bioactive downstream metabolite of 18-HEPE known as resolvin E1 (RvE1) for four days could reverse hyperinsulinemia and hyperglycemia through RvE1’s receptor ERV1/ChemR23. Additionally, we determined if the metabolic effects of RvE1 were dependent on host genetics. Experiments with obese ERV1/ChemR23 knockout and wild type mice showed that RvE1 mitigated hyperinsulinemia and hyperglycemia in a manner dependent on ERV1/ChemR23. RvE1’s effects on fasting insulin and glucose were not uniform in diversity outbred mice that model human genetic variation. Furthermore, secondary SNP analyses revealed extensive genetic variation in human RvE1- and EPA-metabolizing genes.
Conclusions The data suggest increased EPA intake prevents metabolic impairments in obesity through a mechanism mediated by RvE1. The data also underscore the critical need for precision prevention studies that account for host-genetics in the EPA-RvE1 axis.
Translational Perspective EPA ethyl esters have attracted significant attention based on findings from the REDUCE-IT trial on cardiovascular disease risk reduction. This study investigated how EPA ethyl esters prevent obesity-induced hyperinsulinemia and hyperglycemia. Our data show that EPA ethyl esters improved murine fasting insulin and glucose levels through the actions of the downstream metabolite known as resolvin E1 (RvE1). Notably, RvE1’s effects on hyperinsulinemia and hyperglycemia were dependent on the host genetic profile. Collectively, these data suggest targeting the EPA-RvE1 pathway may be an effective approach for preventing impairments in insulin-glucose homeostasis in a host genetic dependent manner.
1.0 Introduction
Circulating levels of eicosapentaenoic acid (EPA, 20:5n-3) are generally low in the western population [1, 2]. Therefore, increased intake of EPA and other n-3 polyunsaturated fatty acids (PUFA) is hypothesized to ameliorate a range of risk factors that contribute toward cardiometabolic diseases [3]. Recently, EPA has garnered attention as the REDUCE-IT trial showed EPA ethyl esters substantially reduced the risk of cardiovascular disease in statin-treated patients with elevated triglycerides [4]. This has led to the FDA approval of EPA ethyl esters for cardiovascular disease risk reduction in patients with hypertriglyceridemia. EPA-containing supplements are also FDA approved for lowering elevated triglycerides, a risk factor for type 2 diabetes and cardiovascular diseases [3].
The effects of n-3 PUFAs on insulin sensitivity and glucose tolerance remain strongly debated. Several randomized clinical trials have failed to establish the benefits of increased n-3 PUFA intake for treating subjects with insulin resistance, which could be due to a range of factors including the use of inappropriate controls [3, 5, 6]. Nevertheless, the prevailing view is that n-3 PUFAs are unlikely to be an effective treatment modality for insulin-resistant individuals. In contrast, there is evidence in the preclinical literature that n-3 PUFAs may have a role in the prevention of metabolic abnormalities driven by obesity. However, a unifying mechanism by which EPA prevents insulin resistance remains unclear [3]. Furthermore, the majority of preventative studies have relied on heterogenous mixtures of n-3 PUFAs despite evidence that EPA and its long chain counterpart docosahexaenoic acid (DHA) are not structurally or functionally identical [7, 8]. Also, many preclinical studies rely on levels of n-3 PUFAs that are not achievable in humans [3]. Thus, the overarching goal of this study was to address these limitations.
We first studied if pure EPA ethyl esters, modeling human pharmacological intake, prevent obesity-induced metabolic impairments using C57BL/6J mice. Supporting analyses on the association between fasting glucose levels and dietary intake of PUFAs was conducted using data from the National Health and Nutrition Examination Survey (NHANES). Mechanistically, we first focused on the microbiome as there is evidence that fish oils containing n-3 PUFAs change the composition of gut bacteria to lower systemic inflammation and decrease endotoxemia, a driver of metabolic complications such as insulin resistance [9-11]. Subsequently, metabolomic and lipidomic analyses were conducted to identify targets of EPA ethyl esters, which led to the study of EPA-derived resolvin E1 (RvE1), a specialized pro-resolving mediator (SPM) with potential insulin/glucose-sensitizing properties [12-17]. We specifically investigated if exogenous administration of RvE1 could reverse hyperinsulinemia and hyperglycemia through RvE1’s receptor ERV1/ChemR23. Furthermore, we assessed if the metabolic effects of RvE1 were dependent on the host genome. To do so, we employed diversity outbred (DO) mice, which are a unique mouse population that model human genetic diversity [18]. Additionally, we conducted SNP analyses by mining the Ensembl database to identify genetic variation of EPA and RvE1 metabolizing genes in humans.
2.0 Materials and Methods
2.1 Animal models, diets, and RvE1 administration
All murine experiments adhered to IACUC guidelines established by The University of North Carolina at Chapel Hill and East Carolina University for euthanasia and humane treatment. C57BL/6J male mice of 5-6 weeks of age were fed lean control (10% kcal from lard, Envigo TD.160407) or high fat (60% kcal from lard, Envigo TD.06414) diet in the absence or presence of EPA (Cayman, >93%) ethyl esters (Envigo TD.160232) for 15 weeks. EPA in the high fat diet accounted for 2% of total energy. The schematic illustrating the generation of the ERV1/ChemR23 mutant allele by CRISPR/Cas9-mediated genome editing is provided in the Supplemental Materials, as described below. These mice and wild type littermate controls were also fed diets from Envigo.
For select studies, C57BL/6J male mice were purchased obese from Jackson at 18 weeks of age. They were acclimatized by feeding lean (10% lard, D12450B) or high fat (60% lard, D12492) diets (Research Diets) for an additional 2-3 weeks prior to conducting experiments. DO male mice (Jackson) from generation 33 were obtained at 4 weeks of age and acclimated for 2 weeks. The DO population is derived from 144 Collaborative Cross lines obtained from Oak Ridge National Laboratory at generations F4-F12 of inbreeding [18].
2.2 Body mass and insulin/glucose measurements
Metabolic studies including Echo-MRI experiments were conducted as previously described [19]. Briefly, mice were fasted for 5 hours prior to the establishment of baseline glucose values with a glucometer. For the glucose tolerance test, 2.5g of dextrose (Sigma-Aldrich) per kg lean mass was administered intraperitoneally.
2.3 Studies with DO mice
Since every DO mouse is genetically unique, each mouse served as its own control. Baseline fasting insulin/glucose measurements were recorded once each DO mouse achieved ∼14 grams of fat mass as measured by Echo-MRI. The mice were then allowed one week to recover and subsequently i.p. injected with 300 ng RvE1 for 4 consecutive days. Fasting glucose and fasting insulin were again measured after RvE1 administration.
2.4 Microbiome analyses
DNA from stool was isolated on King Fisher Flex automated instrument using MagMAX™ DNA protocol. Stool samples were transferred to sterile 2 ml tubes containing 200 mg of ≤106μm glass beads (Sigma) and 0.5ml of lysis/binding buffer. Qiagen TissueLyser II was used at 30Hz to carry out bead beating for 3 minutes after which samples were centrifuged at 21000 x g for 3 minutes. Subsequently, 115μl of supernatants were transferred to MME-96 deep well plates followed by addition of magnetic bead mix and isopropanol. Finally, the sample plate was placed into the King Fisher Flex instrument along with two isopropanol-based, two ethanol-based washing solution plates as well as an elution buffer plate and the MME-96 processor script was executed. Upon completion, DNA was stored in elution buffer at −20°C until further processing. 12.5 ng of total DNA was amplified using universal primers targeting the V4 region of the bacterial 16S rRNA gene1, 2. Primer sequences contained overhang adapters appended to the 5′ end of each primer for compatibility with the Illumina sequencing platform. The complete sequences of the primers were:
515F - 5’ TCGTCGGCAGCGTCAGATGTGTATAAGAGACAGGTGCCAGCMGCCGCGGTAA 3’ 806R - 5’GTCTCGTGGGCTCGGAGATGTGTATAAGAGACAGGGACTACHVGGGTWTCTAAT 3’.
Master mixes contained 12.5ng of total DNA, 0.2µM of each primer and 2x KAPA HiFi HotStart ReadyMix (KAPA Biosystems). The thermal profile for the amplification of each sample had an initial denaturing step at 95°C for 3 minutes, followed by a cycling of denaturing at 95°C for 30 seconds, annealing at 55°C for 30 seconds, a 30 second extension at 72°C (25 cycles), a 5 minutes extension at 72°C and a final hold at 4°C. Each 16S amplicon was purified using the AMPure XP reagent (Beckman Coulter). In the next step each sample was amplified using a limited cycle PCR program, adding Illumina sequencing adapters and dual-index barcodes (index 1(i7) and index 2(i5)) (Illumina) to the amplicon target. The thermal profile for the amplification had an initial denaturing step at 95°C for 3 minutes, followed by a denaturing cycle of 95°C for 30 seconds, annealing at 55°C for 30 seconds and a 30 second extension at 72°C (8 cycles), a 5 minutes extension at 72°C and a final hold at 4°C. The final libraries were again purified using the AMPure XP reagent (Beckman Coulter), quantified and normalized prior to pooling. The DNA library pool was then denatured with NaOH, diluted with hybridization buffer and heat denatured before loading on the MiSeq reagent cartridge and on the MiSeq instrument. Automated cluster generation and paired–end sequencing with dual reads were performed according to the manufacturer’s instructions.
For analyses, multiplexed paired-end fastq files were produced from the sequencing results of the Illumina MiSeq using the Illumina software conFig.BclToFastq. The paired-end fastq files were joined into a single multiplexed, single-end fastq using the software tool fastq-join. Demultiplexing and quality filtering was performed on the joined results. Quality analysis reports were produced using the FastQC software. Bioinformatics analysis of bacterial 16S amplicon sequencing data was conducted using the Quantitative Insights Into Microbial Ecology (QIIME2) software [20]. DADA2 was used for denoising, removal of chimeric sequences, and construction of amplicon sequence variants (ASVs). Feature classification was preformed using the SILVA database in the QIIME2 Naïve Bayes classifier (silva-132-99-nb-classifier). Shannon alpha diversity was calculated using the QIIME2 q2-diversity plugin and beta diversity was calculated utilizing non-metric multidimensional scaling (NMDS) with Bray-Curtis distances. All feature tables generated by the QIIME2 software were imported into the Phyloseq R package and normalized via DESeq2.
2.5 Untargeted mass spectrometry-based metabolomics
Adipose tissue and liver were homogenized using a bead homogenizer and prepared for metabolomics using previously described methods [21]. Samples were analyzed using liquid chromatography mass spectrometry (LC/MS) and raw data were extracted and processed using Agilent Technologies Mass Hunter Profinder Version B.08.00 (Profinder) software in combination with Agilent Technologies Mass Profiler Professional Version 14 (MPP) as previously described [21-23]. An in-house database containing METLIN, Lipid Maps, Kyoto Encyclopedia of Genes and Genomes (KEGG), and Human Metabolomics Database (HMDB) was used to annotate metabolites based on exact mass, isotope ratios, and isotopic distribution with a mass error cutoff of 10 ppm. This corresponds to annotation at Metabolomics Standards Initiative (MSI) level 3 [24].
To visualize clustering between the dietary groups we ran a principal component analysis (PCA) using all metabolites. We then determined statistically significant metabolites between obese mice and obese mice supplemented with EPA. One of the samples from the high fat diet (HF_105) was an outlier from all the other samples and was excluded from analyses. We then calculated fold changes (EPA/high fat). Next, using the validated significant metabolites with Log2 fold changes ±1.5 we standardized the abundances of the metabolites by assigning a Z-score for each sample based on the distribution of the given metabolite. We utilized the Z-scores to generate heatmaps annotated with the classification of each metabolite.
2.6 Targeted mass spectrometry-based metabololipidomics
Analyses of PUFA-derived metabolites of visceral white adipose tissue, liver, and heart was conducted as previously described [25]. Quantitation of lipid mediators was performed using two-dimensional reverse phase HPLC tandem mass spectrometry (liquid chromatography–tandem mass spectrometry). All standards and internal standards used for the LC/MS/MS analysis were purchased from Cayman Chemical (Ann Arbor, Michigan, USA). All solvents and extraction solvents were HPLC grade or better.
2.7 Analyses of NHANES database
The 2013-2014 NHANES database was mined for daily average intake of PUFAs with respect to age, sex, and BMI. We used Rv3.4.4 with the RNHANES package to retrieve the NHANES database. Graphical packages ggpubr and ggplot2 were used to generate all graphs and statistical annotations. The “Dietary Interview - Total Nutrient Intakes” section of the NHANES database was used to retrieve PUFA intake measurements based on a 24-hour dietary recall questionnaire. OGTT 2-hour glucose measurements were retrieved from the “Current Health Status” section, where BMI was retrieved from “Body Measures”. Tertiles of PUFA intake were calculated corresponding to the probability of intake at 33.3%, 67%, and 100% of the range. Normality and homogeneity of variance were tested with the Shapiro-Wilks test and Bartlett test respectively. The dataset did not satisfy the assumptions of normality and heteroscedasticity; therefore, we utilized a Kruskal-Wallis test followed by a Wilcoxon pairwise test to measure significant differences between tertiles of PUFA intake.
2.8 SNP analyses
We used the Biomart tool to mine the Ensembl Variation 98 Human Short Variants (GRCh38.p13) database for single nucleotide polymorphisms (SNPs) with minor allele frequencies at or above 5% that are contained within the 1000 genomes project or the NCBI dbSNP archive. We mined SNPs for the genes listed in the Supplemental Methods. We used the ggplot2 package in R v3.4.4 to plot all the minor allele frequencies by each allele for every gene and chromosome. White lines in the graph represent a break/gap in the minor allele frequency (MAF) distribution, for example a gene may contain MAFs ranging from 0.05-1.5 then 2.5-4.5 with a “break” between the 1.5-2.5 gap. The distances between the SNPs of different genes on the chromosomes was determined using the base pair location at the last SNP of the first gene and the first SNP of the second gene. Distances below 500 kilobases were considered as having a higher likelihood for genetic linkage, as described by the HapMap project Haploview tool. Additional details are in the Supplemental Methods.
2.9 Statistics
Data were analyzed using Graph Pad Prism Version 7.0. Statistical significance relied on one-way or two-way ANOVAs followed by a post-hoc Tukey HSD test if the data satisfied the assumptions of normality and homogeneity of variance tested by the Shapiro-Wilks test and Bartlett test respectively. Data that failed the assumption of heteroscedasticity were analyzed using a Welch ANOVA followed by a pairwise Welch T-test with a Bonferroni p-value adjustment. Data sets that did not display normal distributions were analyzed with a Wilcoxon pairwise test. Studies as a function of time that passed the assumptions of normality and heteroscedasticity were analyzed with a two-way ANOVA. For clarity, additional description of analyses for microbiome, metabolomics, and NHANES datasets are included with each corresponding methods section above. For all analyses, p<0.05 was considered statistically significant.
3.0 Results
3.1 EPA ethyl esters of high purity improve hyperglycemia, hyperinsulinemia, and glucose intolerance of obese male mice
We first determined if dietary administration of EPA could prevent obesity-induced metabolic outcomes of obese male mice. The approach relied on pure ethyl esters of EPA and not mixtures of EPA with DHA that can confound the data. Mice consuming a high fat diet in the absence and presence of EPA had similar increases in total mass and fat mass compared to lean controls (Fig. 1A). Inclusion of EPA in the diet of obese mice restored the obesity-driven glucose intolerance (Fig. 1B), as quantified by the area under the curve (Fig. 1C). Relative to the high fat diet, EPA restored the impairment in fasting glucose (Fig. 1D) and improved fasting insulin levels (Fig. 1E). The HOMA-IR score was lowered with EPA in the diet relative to the mice consuming the high fat diet (Fig 1F). Overall, EPA ethyl esters significantly ameliorated the metabolic insult of the high fat diet.

(A) Body composition measured by Echo-MRI. (B) Glucose tolerance test performed by intraperitoneal injection of glucose after a 5 hour fast. (C) Area under the curve (AUC), calculated by integration of the curves in B normalized to baseline values. (D) Fasting glucose and (E) fasting insulin levels after a 5 hour fast. (F) HOMA-IR scores. For all measurements, male mice consumed a lean control (Con) diet (O), a high fat (HF) diet (Δ), or a HF diet supplemented with EPA ethyl esters (□). Measurements were conducted at week 13 of intervention. Values are means ± SD. *p<0.05, **p<0.01, ***p<0.001, ****p<0.0001 from one-way ANOVA followed by Tukey’s multiple comparisons test except B, which was a two-way ANOVA followed by a post hoc test.
3.2 NHANES analyses reveal glucose levels are inversely related with EPA intake in a sex-specific manner and are also dependent on the ratio of EPA to linoleic acid
To translate the murine data, we analyzed the relation between EPA intake and blood glucose levels during an OGTT in obese humans using data from NHANES. Increased EPA intake was associated with lower glucose levels between the first and third tertiles for obese males (Fig. 2A) but not females (Fig. 2B). Furthermore, we investigated if there was a relationship between DHA and glucose levels. In obese males (Fig. 2C) and females (Fig. 2D), there was no association between DHA and blood glucose levels.

NHANES data on two-hour glucose measurements (mg/dl) from an OGTT were stratified by tertiles of EPA intake in grams for obese (A) males and (B) females. DHA intake is also depicted for (C) males and (D) females. The range of EPA intake for males was 0.0-0.009g for tertile 1, 0.01-0.068g for tertile 2, 0.069g and above for tertile 3. For females, the intake is 0-0.009 for tertile 1, 0.01-1.51g for tertile 2, 1.52g and above for tertile 3. The range of DHA intake for males is 0.01-0.05g for tertile 1, 0.06-1.49g for tertile 2, and 1.5g and above for tertile 3. The range of DHA intake for females was 0.01-0.03g for tertile 1, 0.04-2.35g for tertile 2, and 2.36g and above for tertile 3. Subjects were adults (18 years and older) and had a BMI of 30 and above. Tertiles of the ratio of LA to EPA are presented for obese (E) males and (F) females. The tertiles correspond to 33%, 67%, and 100% of the range of LA to EPA intake for subjects older than 18 and a BMI of 30 and above. Values are means ± SEM; *p<0.05, **p<0.01, ***p<0.001. from Wilcoxon pairwise test. Number of subjects for each tertile is listed on the x-axis.
The metabolism of EPA relies on some of the same enzymes used by n-6 PUFAs such as linoleic acid (LA) [26, 27]. Thus, we further mined the NHANES data to determine if there was a relationship between the ratio of LA to EPA on fasting glucose levels. Tertiles of the LA to EPA ratio are plotted for obese men (Fig. 2E) and women (Fig. 2F). The positive association between EPA and glucose levels was diminished and in fact, at the highest ratio of LA to EPA in men (Fig. 2E), but not women (Fig. 2F), blood glucose levels were increased relative to the first two tertiles.
3.3 EPA ethyl ester supplementation does not modify the composition of the gut microbiome relative to mice on a high fat diet
Mechanistically, previous studies suggest that mixtures of EPA/DHA promote specific compositional changes in the murine microbiome in a manner that supports lower systemic inflammation associated with insulin resistance [9-11]. Therefore, we conducted a microbiome study with mice consuming control, high fat, and high fat + EPA ethyl ester diets. Using non-metric multidimensional scaling (NMDS) with Bray-Curtis distances, we found a separation in beta diversity between mice fed a control diet verses a high fat or high fat+EPA diet (Fig. 3A). However, the distances between the high fat and high fat+EPA samples were not distinctly defined, indicating small differences in the microbial beta diversity between a high fat diet and high fat+EPA diet. There were minor differences in the relative abundance between high fat and high fat+EPA diets (Fig. 3B). In contrast, the families Erysipelotrichaceae and Lactobacillaceae were decreased between mice consuming high fat diet as compared to the control diet. Shannon alpha diversity between mice fed the high fat and high fat+EPA diets were similar (Fig. 3C). The control mice had significantly higher Shannon alpha diversity compared to the EPA-containing diet, suggesting a larger species diversity within the control group. We found the most consistent change between all three dietary groups among the proteobacteria-related microbes – spanning phylum (Fig. 3D), class (gammaproteobacteria) (Fig. 3E), and order level (betaproteobacteriales) (Fig. 3F). All three proteobacteria-related microbes were elevated between each dietary pairwise comparison. We conducted hierarchal clustering on the samples (Fig. 3G) using the normalized Log10 absolute abundance values and found that the control mice tightly cluster together, whereas the high fat and high fat+EPA samples shared the same parent branch in the dendrogram with little differences between their abundance values. Collectively, these findings suggest that EPA ethyl esters do not improve the obesity-driven compositional changes in the gut microbiome.

C57BL/6J male mice consumed either a control (Con), high fat (HF) or HF+EPA ethyl ester diet. (A) NMDS plot with Bray-Curtis distances portraying beta-diversity between samples. (B) Family level relative abundances calculated from normalized absolute abundances. (C) Shannon alpha diversity between diet groups calculated by QIIME2. (D) Log10 normalized absolute abundance of phylum level proteobacteria. (E) Log10 normalized absolute abundance of class level gammaproteobacteria. (F) Log10 normalized absolute abundance of order level betaproteobacteriales. (G) Heatmap of Log10 normalized absolute abundances with hierarchal complete linkage clustering of the taxa (columns) and samples (rows). Fecal samples were collected at week 13 of intervention. Values are means ± SD; *p<0.05, **p<0.01, ***p<0.001 from Wilcoxon pairwise test. n=8-11 mice per diet.
3.4 Metabolomic analyses reveal EPA’s effects are distinct from obese mice not consuming EPA
Given the mechanism of action for EPA ethyl esters is likely to be pleiotropic, we conducted metabolic profiling of visceral white adipose tissue, liver, and cardiac tissue from mice consuming the experimental diets. PCA plots revealed a clear distinction between the control, high fat, and high fat + EPA ethyl ester diets for visceral white adipose (Fig. 4A). EPA ethyl esters were predominately incorporated into triglycerides with some uptake into diglycerides and phosphatidylcholine (Fig. 4B, 4C).


C57BL/6J male mice consumed a control (Con), high fat (HF) and HF+EPA ethyl ester diet. (A) PCA plot of validated adipose tissue metabolites between control, HF, and HF+EPA samples. (B) Heatmap of Z-scores from significant adipose tissue metabolites with ±1.5 fold-change. (C) Log2 fold change graph of EPA-containing (20:5) adipose metabolites. (D) PCA plot of validated liver metabolites between control, HF, and HF+EPA samples. (E) Heatmap of Z-scores from significant liver metabolites with ±1.5 fold-change. (F) Log2 fold change graph of EPA-containing (20:5) adipose metabolites. Heatmap legends on the right hand side of (B) and (E) show each metabolite’s classifications: triglyceride (TG), diacylglycerol (DG), phosphatidylethanolamine (PE), lysophosphatidylethanolamine (LysoPE), phosphatidic acid (PA), phosphatidylcholine (PC), phosphatidylserine (PS), phosphatidylglycerol (PG), phosphatidylinositol (PI), arachidonoylethanolamine (AEA), cholesterol (CL), and docosahexaenoic acid (DHA). Full metabolite names are provided in the supplemental.
In the liver, PCA plots also showed a clear distinction between the high fat and high fat + EPA ethyl ester diets (Fig. 4D). EPA ethyl esters appeared to have a broad effect on the liver metabolome (Fig. 4E, 4F). EPA acyl chains were likely distributed into triglycerides, phosphatidylcholine, phosphatidylethanolamine, and anandamide (Fig. 4F).
In cardiac tissue, PCA plots revealed no changes between mice consuming a high fat diet in the absence or presence of EPA (Suppl. Fig. 1). Overall, these results showed that EPA ethyl esters are incorporated into several lipid pools, which would then differentially influence metabolic pathways, particularly in the adipose tissue and liver. The full metabolite names, p-values, fold changes, and quantifications are in Supplemental Tables 1 and 2 for the adipose tissue and liver, respectively.
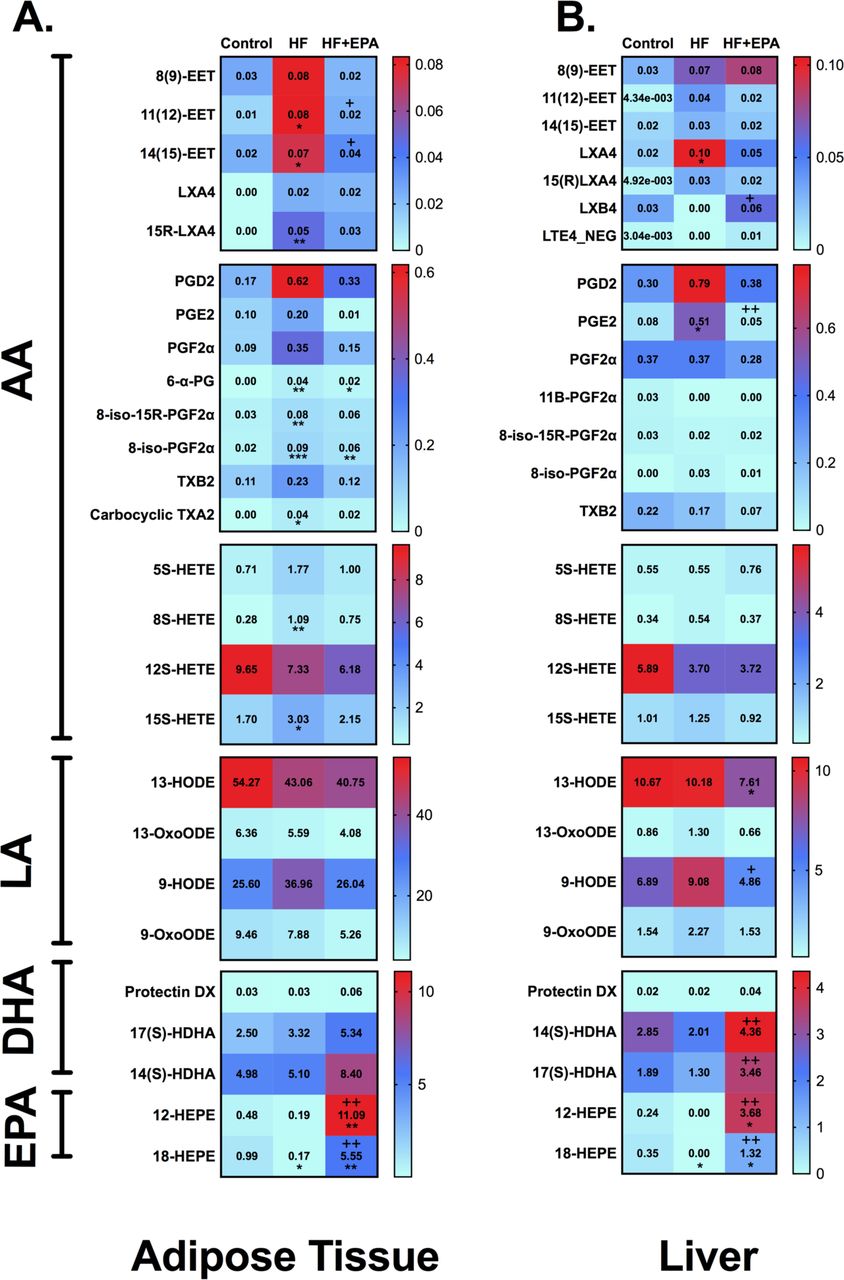
3.5 Targeted lipidomic analyses reveal EPA reverses the effects of obesity on the levels of 18-HEPE
We next conducted targeted metabololipidomic analyses to further study the effects of EPA on the adipose, liver, and cardiac lipidomes. The high fat diet and high fat diet + EPA modulated several n-3 and n-6 PUFA-derived metabolites in the adipose tissue (Fig. 5A) and liver (Fig. 5B). Markedly, EPA reversed the reduction of 18-HEPE levels (by up to 32-fold) in white adipose tissue (Fig. 5A) and liver (Fig. 5B) of obese mice and also increased levels relative to lean mice. EPA also strongly upregulated the concentration of 12-HEPE in white adipose tissue (Fig. 5A) and liver (Fig. 5B). In the heart, EPA had some effects on n-6 PUFA derived metabolites (Suppl. Fig. 2). The concentration of 12-HEPE and 18-HEPE were elevated by 11-27 fold relative to the lean and high fat diets in response to EPA (Suppl. Fig. 2). Overall, the strong increase of 18-HEPE in mice upon EPA intervention set the basis for subsequent experiments with RvE1, the downstream bioactive product of 18-HEPE.

Mass spectrometry based metabololipidomic analyses of (A) visceral white adipose tissue and (B) liver. Metabolites from eicosapentaenoic acid (EPA), docosahexaenoic acid (DHA), linoleic acid (LA) and arachidonic acid (AA) are depicted in the heat map. Male mice consumed experimental diets for 15 weeks. N=4-5 mice per diet. Data are average. *p<0.05, **p<0.01, ***p<0.001 as compared to a control diet and +p<0.05, ++p<0.01 as compared to the high fat diet. Statistical analyses for these data are described in the methods section.
3.6 Four days of administering RvE1 improves hyperinsulinemia and hyperglycemia of inbred mice in a manner that is dependent on the receptor ERV1/ChemR23
Given that EPA strongly upregulated 18-HEPE, we subsequently investigated the effects of RvE1 on fasting insulin and glucose using C57BL/6J mice. Furthermore, we assessed if the effects of RvE1 could be mediated by one of its receptors, ERV1/ChemR23. Therefore, we studied the effects of short-term RvE1 treatment on ERV1/ChemR23 knockout (KO) mice and wild type (WT) littermates in relation to hyperinsulinemia and hyperglycemia. Supplemental Figure 3A and 3B respectively show the experimental scheme and the ERV1/ChemR23 deletion allele. Body composition did not differ between obese WT and ERV1/Chem23 KO mice administered vehicle control or RvE1 (Fig. 6A). RvE1 administered for just four days improved fasting glucose levels of WT but not ERV1/ChemR23 KO mice (Fig. 6B) compared to obese mice. We also tested fasting insulin levels in a subset of our WT and KO mice via an ELISA. Fasting insulin levels were improved in response to RvE1 in WT obese mice but not in ERV1/ChemR23 KO obese mice relative to lean animals (Fig. 6C).

(A) Body weight (B) fasting glucose and (C) fasting insulin levels of male wild type (WT) and ERV1/ChemR23 knockout (KO) mice consuming a lean control diet (Con) (O) or high fat (HF) diet in the absence (Δ) or presence (□) of RvE1. Corresponding (D) body weight, (E) fasting glucose and (F) fasting insulin levels of C57BL/6J male mice purchased as obese from Jackson Laboratories. All measurements were made at 13-14 weeks of dietary intervention. N=14-18 mice per diet (A,B), N=6-7 mice per diet (C), N=14 mice per diet (D-F). Values are means ± SD. *p<0.05, **p<0.01, ***p<0.001, ****p<0.0001 by one-way ANOVA followed by Tukey’s multiple comparisons test.
We also determined if the effects of RvE1 on hyperglycemia and hyperinsulinemia were evident in a second model system, which were C57BL/6J mice that were purchased obese from Jackson Laboratories. With these mice, we did not conduct a broad lipidomic analysis; however, RvE1 levels were measured via an ELISA, which showed lower levels of RvE1 in the plasma of obese mice compared to lean controls (Suppl. Fig. 4). RvE1 administration to obese mice had no effect on body weight (Fig. 6D) compared to the mice on a high fat diet. RvE1 restored fasting glucose (Fig. 6E) and improved fasting insulin levels relative to obese mice (Fig. 6F).
3.7 Host genetics have a role in regulating the response to RvE1
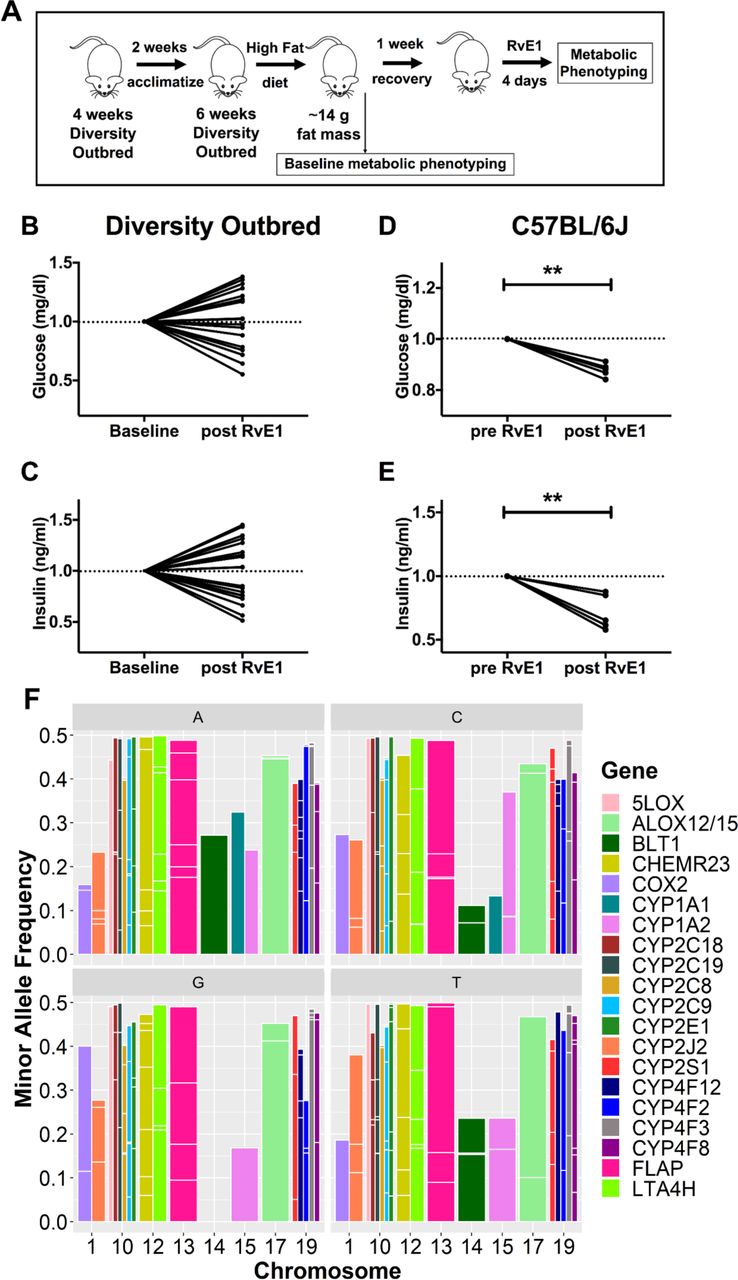
Humans are genetically heterogenous; therefore, we determined whether host genetic differences lead to variations in the fasting insulin and fasting glucose response to RvE1. For these studies, we relied on DO mice that model human genetic variability [18]. Administration of a high fat diet led to large variations in body weight with DO mice. Thus, we optimized an experimental design (Fig. 7A) to measure the effects of RvE1 on fasting insulin and fasting glucose. We administered RvE1 to those mice that achieved ∼14g of fat mass (measured via Echo-MRI) over the course of the period of dietary intervention with a high fat diet. The rationale for selecting ∼14g of fat mass was based on the studies with obese C57BL/6J mice (Figs. 1, 6) that were in this range of fat mass. Body weight gain of the DO mice is depicted in Suppl. Fig. 5. Relative to baseline, RvE1 improved fasting glucose (Fig. 7B) and fasting insulin (Fig. 7C) levels in approximately half of the obese DO mice. In contrast, using the same experimental design with C57BL/6J mice, fasting glucose (Fig. 7D) and fasting insulin (Fig. 7E) were more uniformly improved in response to RvE1.
Data with the DO mice led us to investigate if there is strong genetic variation in RvE1- and EPA-metabolizing genes in humans. We mined the Ensembl database containing the dbSNP archive and 1000 genomes data (Suppl. Table 3). We extracted all the CYP450 enzymes that have the capacity to metabolize EPA, further downstream enzymes leading to the production of E-series resolvins (COX2, ALOX5, FLAP, ALOX12/15, LTA4H), and the two RvE1 receptors (ChemR23 and BLT1) [28-30]. The analyses show a large range of minor allele frequencies where SNPs for each gene are contained in chromosomes 1, 10, 12-15, 17 and 19 with BLT1 lacking SNPs in chromosome 14 (Fig. 7F). Genes with lower ranges of minor allele frequencies (MAF) ranging from 0.05 (5%) – 0.38 (38%) include BLT1, COX2, CYP2J2, CYP1A1 and CYP1A2. Surprisingly, all other genes contained many high MAFs with numerous SNPs in the 0.4 (40%) - 0.5 (50%) range (Fig. 7F). Moreover, the CYP450 genes contained many SNPs in close proximity (<500 kilobases) on the same chromosome, these include: CYP2C18 and CYP2C19 (∼27 Kb apart), CYP2C19 and CYP2C9 (∼84 Kb), CYP2C9 and CYP2C8 (∼47 Kb), CYPA1A1 and CYPA1A2 (∼24 Kb), CYP4F8 and CYP4F3 (∼10 Kb), CYP4F3 & CYP4F12 (∼10 Kb), and CYP4F12 and CYP4F2 (∼181 Kb). Taken together, these results showed high population variance in EPA- and RvE1-metabolizing genes.

(A) Schematic representation of study design with diversity outbred mice. Fasting glucose and insulin measurements were obtained prior to (baseline) and after 4 days of RvE1 administration. (B) Fasting glucose and (C) fasting insulin levels after a 5 hour fast. Corresponding studies with C57BL/6J mice using the same experimental design of intervention are depicted for (D) fasting glucose and (E) fasting insulin. All data are plotted as the fold change in glucose and insulin relative to baseline. N =19 DO mice and N= 6 C57BL/6J mice. **p<0.01 by a paired two-tailed t test. (F) Data were mined from the 1000 genomes and dbSNP human variants databases. Snalyses show SNPs in the EPA and RvE1 metabolizing genes stratified by each minor allele (A,C,G,T). The SNPs in each gene are plotted by minor allele frequencies and the chromosome that contains the SNP. The major genes that metabolize EPA and/or RvE1 are depicted by differing colors.
4.0 Discussion
There is growing evidence from humans and rodents that obesity impairs the biosynthesis of SPMs and their precursors, which are predominately generated from dietary n-3 PUFAs including EPA [14, 19, 31, 32]. The loss of SPMs contributes toward a range of cardiometabolic complications including chronic inflammation, hepatic steatosis, insulin resistance, susceptibility to infection, and delayed wound healing [13, 15, 25, 32-35]. Therefore, there is a critical need to understand how specific dietary n-3 PUFAs through the biosynthesis of their downstream metabolites regulate outcomes in cardiometabolic diseases. This study reveals that administration of EPA ethyl esters can prevent hyperinsulinemia and hyperglycemia through the actions of RvE1 in a host genetic dependent manner.
The analyses of the NHANES data underscore the need for preventative precision nutrition studies with EPA. Longitudinal studies with EPA that are focused on prevention, prior to the onset of insulin resistance, are lacking. One pilot study demonstrated that administration of n-3 PUFAs to healthy human volunteers prevented insulin resistance induced with a glucocorticoid [36]. Our NHANES analyses revealed those subjects with lowest consumption of EPA, but not DHA, had the highest glucose levels in a sex-specific manner. The positive effects of EPA were mitigated when the intake of LA was high. While these data are associative, they point to the importance of discriminating EPA from DHA and accounting for LA levels in clinical studies and trials. LA is of significance for several reasons. LA biosynthesis and metabolism requires some of the same enzymes used for EPA synthesis and metabolism, including the production of downstream metabolites such as RvE1 [26, 27]. Moreover, LA’s consumption in the western diet is 14-18 times the amount required to prevent LA deficiency [2, 37] and LA’s effects on insulin sensitivity are strongly debated [38].
The data with EPA ethyl esters challenge some previous findings. Earlier studies reported a reduction in fat mass with EPA-enriched oils, which we did not observe [39, 40]. Additionally, EPA did not promote changes in the composition of the gut microbiota induced by a high fat diet. Some studies show that fish oils or fat-1 transgenic mice remodel the gut microbiome to lower the abundance of Gram negative bacteria [9-11]. EPA ethyl esters are clearly remodeling several lipid pools, which may in turn influence metabolites generated by the gut microbiome. Therefore, it is possible that EPA ethyl esters are promoting changes in microbial metabolites. Nevertheless, our data with EPA ethyl esters do not match previous findings on body weight or the microbiome, which we speculate is driven by the concentration, duration, and use of EPA/DHA mixtures. EPA driving an upregulation in the concentration of RvE1’s precursor is highly consistent with a recent clinical trial to show that consumption of an n-3 PUFA supplement promoted a strong upregulation of SPMs within 24 hours [41].
RvE1 is likely exerting its effects through multiple mechanisms. We discovered that four days of administering RvE1 rescued hyperglycemia and hyperinsulinemia through ERV1/ChemR23. There is evidence that RvE1 blocks signaling through BLT1, the receptor for the arachidonic acid-derived LTB4 [16]. LTB4 serves as a chemokine for select immune cell populations that exacerbate glucose intolerance [42]. Thus, RvE1 may also be inhibiting LTB4 binding to BLT1 to improve chronic inflammation. RvE1 may also be inhibiting signaling through chemerin, an adipokine that binds ERV1/ChemR23 [43]. At the organ and cellular level, RvE1 can improve inflammation though the targeting of intestinal alkaline phosphatase and specific cell types including neutrophils [35, 44, 45]. An additional possibility is that RvE1 may exert its effects through the production of further downstream metabolites. This may explain why we did not detect RvE1 as the SPM may be undergoing increased turnover to oxidized metabolites [32]. Our mass spectrometry assay did not include downstream metabolites like 18-oxo-RvE1. In addition, it is possible that administering other metabolites such as RvE2 or 12-HEPE could further improve outcomes. We did not study the effect of 12-HEPE, which is of interest as it was recently identified to improve glucose metabolism [46].
There is some ambiguity among studies regarding the effects of RvE1 on hyperglycemia. Overexpression of ERV1/ChemR23 in myeloid cells improved hyperglycemia and hepatic steatosis of male mice [47]. However, RvE1 administration to wild type mice at a dose of 2ng/g body weight twice weekly for four weeks did not improve hyperglycemia [47]. Our studies relied on a dose of RvE1 (300ng/mouse) for four consecutive days, which may explain the positive effects. Overall, our data on RvE1 were in agreement with the literature to show that select DHA-derived SPMs improve insulin resistance [13, 17, 33, 48, 49]. For instance, the DHA-derived SPM protectin D1 alleviates insulin resistance by controlling skeletal muscle IL-6 secretion and resolvin D1 enhances glucose tolerance by targeting adipose tissue inflammation [13, 17].
An additional advancement from this study is that DO mice, which model human genetic diversity, respond in a divergent manner upon RvE1 administration. The results break new ground by suggesting that RvE1 is unlikely to have a uniform positive effect in all obese humans. Overall, little is known about the role of host genetics on SPM biology. One study highlights the importance of genetic variation by demonstrating that obese subjects with a C allele in the rs1878022 polymorphism of ERV1/ChemR23 receptor confers protection from adipose tissue inflammation [50]. Mining the 1000 genomes and dbSNP databases revealed a large range of minor allele frequencies in the EPA and RvE1-metabolizing genes. Most of the genes analyzed reach minor allele frequencies close to 50%, indicating large population variance in the EPA-RvE1 pathway. Furthermore, close proximity of the CYP450 enzyme SNPs suggest potential genetic linkage in many of the CYP450 variants that can potentially influence metabolism of EPA and its downstream metabolites. The results provide strong groundwork for future genetics studies that will establish candidate genes regulating the metabolic response to RvE1. This will allow investigators to establish ‘responders’ from ‘non-responders’ to SPMs in humans. Overall, these data highlight the need for precision administration of EPA and RvE1 based on host genetic profiles.
In summary, the results provide strong evidence that the EPA-RvE1 axis has a critical role in controlling insulin and glucose homeostasis, which may be a preventative target for cardiometabolic diseases. The results across model systems highlight the need for future prevention studies that account for the role of host genetics in the metabolism of RvE1 and other EPA-derived metabolites.
Author contributions
A.P. designed and conducted experiments, wrote the manuscript, analyzed data; A.E.A. designed and conducted experiments, wrote parts of the manuscript, analyzed data; W.G. designed and conducted experiments, analyzed data; M.T. conducted experiments; M.A. conducted experiments and analyzed data; K.Q. conducted experiments and analyzed data; T.D. conducted experiments; N.R. designed experiments and provided intellectual input on select analyses; P.D.N. designed experiments; E.E.S. conducted and designed experiments and provided intellectual input on select experiments; I.C. designed experiments and analyzed data; R.B. designed experiments and analyzed data; J. C. provided intellectual input on select data sets and contributed toward editing, and S.R.S. designed experiments, analyzed data, wrote parts of the manuscript and directed the overall research.
Conflict of Interest
RPB has received industrial grants, including those matched by the Canadian government, and/or travel support related to work on brain fatty acid uptake from Arctic Nutrition, Bunge Ltd., DSM, Fonterra, Mead Johnson, Nestec Inc., and Pharmavite. Moreover, RPB is on the executive of the International Society for the Study of Fatty Acids and Lipids and held a meeting on behalf of Fatty Acids and Cell Signaling, both of which rely on corporate sponsorship. RPB has given expert testimony in relation to supplements and the brain. SRS has previously received industry grants including research related to n-3 fatty acids from GSK and Organic Technologies.
Acknowledgements
We thank Dr. Dale Cowley from the UNC Animal Models Core for his assistance in generating the ERV1/ChemR23 KO mice and UNC’s Microbiome Core Facilities.
Footnotes
The research was supported by: R01AT008375 (SRS), P30DK05635 (SRS), R01AR066660 (ES), NIH/NCRR S10 RR026522-01A1 (NR), R01DK096907 (PDN), Canadian Institutes of Health Research 303157 (RPB), SAF15-63674-R (Spanish Ministry of Economy and Science, JC) and 2017SGR1449 (AGAUR Generalitat de Catalunya, JC). This material is also based upon work supported by the National Science Foundation Graduate Research Fellowship Program under Grant No. 1650116 to AEA. Any opinions, findings, and conclusions or recommendations expressed in this material are those of the author(s) and do not necessarily reflect the views of the National Science Foundation. The microbiome studies were supported by the Microbiome Core Facilities, supported in part by NIDDK P30DK34987
References


