

Abstract
Aging is characterized by a progressive loss of physiological integrity, leading to impaired function and increased vulnerability to death 1. Despite rapid advances over recent years 2, many of the molecular and cellular processes which underlie progressive loss of healthy physiology are poorly understood. To gain a better insight into these processes we have created a single cell transcriptomic atlas across the life span of Mus musculus which includes data from 18 tissues and organs. We discovered cell-specific changes occurring across multiple cell types and organs, as well as age related changes in the cellular composition of different organs. Using single-cell transcriptomic data we were able to assess cell type specific manifestations of different hallmarks of aging, such as senescence 3, changes in the activity of metabolic pathways 4, depletion of stem-cell populations 5, genomic instability 6 and the role of inflammation as well as other changes in the organism’s immune system2. This Tabula Muris Senis provides a wealth of new molecular information about how the most significant hallmarks of aging are reflected in a broad range of tissues and cell types.
Results
We performed single cell RNA sequencing on 529,823 cells from male and female C57BL/6JN mice belonging to six age groups ranging from one month (human early childhood equivalent) to thirty months (human centenarian equivalent) (Figure 1a). We prepared single cell suspensions of the bladder, bone marrow, brain (cerebellum, cortex, hippocampus and striatum), fat (brown, gonadal, mesenteric and subcutaneous), heart and aorta, kidney, large intestine, limb muscle and diaphragm, liver, lung, mammary gland, pancreas, skin, spleen, thymus, tongue and trachea for all mice. Data were collected for all six age groups using microfluidic droplets (droplet), while the 3m and 24m time points were also analyzed using single cells sorted in microtiter well plates (FACS) (Extended Data Fig.1a; Supplementary Table 1; Supplementary Figs.1&2). The droplet data allow large numbers of cells to be analyzed using 3’ end counting, while the FACS data allow for higher sensitivity measurements over smaller numbers of cells as well as sequence information across the entire transcript length. Analyzing multiple organs from the same animal enabled us to create data controlled for age, environment, and epigenetic effects.

a, 18 organs from 19 male and 11 female mice were analyzed at 6 different time points. The bar plot shows the number of sequenced cells per organ prepared by FACS (n=18 organs) and microfluidic droplets (n=16 organs). b, Annotation workflow. Data were clustered together across all time points. We used the Tabula Muris (3m time point) as reference for the automated pipeline and the annotations were manually curated by the tissue experts. c, UMAP plot of all cells collected by FACS, colored by organ in the same manner as in panel a, overlaid with the Louvain cluster numbers; n = 81,478 individual cells. d, B cells (and T cells) independently annotated for each organ cluster together by unbiased whole-transcriptome Louvain clustering, irrespectively of the organ they were from (n=3,294 out of 3,729 B cells and n= 1,786 out of 1,818 T cells). e, UMAP plot of all cells collected by droplet, colored by organ in the same manner as in panel a, overlaid with the Louvain cluster numbers; n = 235,325 individual cells. f, B cells (and T cells) independently annotated for each organ cluster together by unbiased whole-transcriptome Louvain clustering, irrespectively of the organ they were from (n=23,897 out of 26,022 B cells and n= 10,585 out of 10,839 T cells).
The previously published 3m time point, referred to as the Tabula Muris 7, represents ~20% of the cells in the entire dataset and was used as the basis to perform semi-automated cell type annotation of the additional time points (Fig.1b, Extended Data Fig.1b). Using this approach, we were able to automatically annotate over 70% of the remaining cells; cellular populations that were not automatically annotated were manually curated and assigned to known cell types, resulting in annotations for >95% of all cells. All annotations were ultimately reviewed and approved by human experts, creating one of the largest manually curated single cell transcriptomic resources in existence. Many of these cell types have not previously been obtained in pure populations, and these data provide a wealth of new information on their characteristic gene-expression profiles. To demonstrate that the annotations performed separately for each tissue were consistent across the entire organism, we clustered all cells using an unbiased, graph-based clustering approach8,9 (Fig.1c,e) and showed that cell types such as B and T cells which are shared across different organs and tissues occupy the same clusters irrespectively of the tissue of origin (Fig.1d,f). The dataset can be explored interactively at tabula-muris-senis.ds.czbiohub.org. Gene counts, metadata and code used for the analysis are available from GitHub (https://github.com/czbiohub/tabula-muris-senis) and the raw data are available from GEO (GSE132042).
Tabula Muris Senis provides a powerful resource with which to explore aging related changes in specific cell types. For example, when we looked for cell types in which gene expression is most affected by age we found that bone marrow cell types are collectively among those with the highest number of differentially expressed genes (Extended Data Fig.2a,b). Another global trend that we observed across cell types and tissues was that the cumulative distribution of the number of distinct genes sequenced per cell shows that young mice have a higher number of genes per cell (Extended Data Fig2c; Extended Data Figs. 3,4), perhaps reflecting their greater use of developmental pathways. We also studied how the cellular composition of each tissue changes with age. For example, in the bone marrow (Fig.2a) we observed a significant increase in the relative abundance of granulocytes with age (Fig.2b), together with a small reduction of granulocytopoietic cells (Extended Data Fig.2d). Granulocytopoietic cells give rise to both granulocytes and monocytes. Granulocytes are short-lived cells10 and the fact that their numbers tend to increase with age might indicate that the process of granulocytopoiesis at later age is more biased towards granulocytes, at the expense of having fewer monocytes, also consistent with our data (Fig.2c). We independently validated this observation using freshly isolated cells from the bone marrow and examined changes in the ratio of putative granulocytes to putative monocytes across different ages (Extended Data Fig.5a). The trend that we observed was consistent with the observed changes in the single cell droplet dataset (Extended Data Fig.5b), supporting the idea that granulocytopoietic cells become biased towards the granulocyte progeny with time11.

a, Bar plot showing the relative abundances of cell types in the marrow across the entire age range for the droplet dataset. b,c, Granulocyte (b) and monocyte (c) relative abundances change significantly with age (p-value<0.05 for a hypothesis test whose null hypothesis is that the slope is zero, using two-sided Wald Test with t-distribution of the test statistic). d, Bar plot showing the relative abundances of cell types in the bladder across the entire age range for the droplet dataset. e,f, Bladder urothelial cell (e) and bladder cell (f) relative abundances change significantly with age (p-value<0.05 for a hypothesis test whose null hypothesis is that the slope is zero, using two-sided Wald Test with t-distribution of the test statistic). g, Bar plot showing the fractions of cells expressing Cdkn2a at each age group for FACS (left) and droplet (right).
The bladder is another example of a tissue with pronounced changes in cell type composition revealed using relative compositions (Fig.2d). While the mesenchymal compartment of this tissue decreases by a factor of three over the lifetime of the mouse (Fig.2e), the urothelial compartment increases by a similar amount (Fig.2f). The fact that the amount of bladder urothelial cells is increasing is concordant with known age-related urothelial changes12. Moreover, the leukocyte population consistently increases with age, opposite to the endothelial population. The decline of the endothelial population suggests that bladder aging in mice may be associated with lower organ vascularization, consistent with recent findings13,14. The increase in the leukocyte population could be indicative of the organ being in an inflammatory state, a common hallmark of aging which is consistent with current literature on overactive bladders15. Similar plots of cell type composition changes across all tissues can be found as part of the interactive online browser. When interpreting compositional data, one must bear in mind that dissociation does not affect all of the cell types in a tissue equally, so changes in the relative composition of a given cell type with age are more meaningful than trying to compare proportions of different cell types at a single age.
We then investigated aspects of cellular senescence, another aging hallmark. We compiled a list of senescence related genes and computed the fraction of cells expressing each gene as well as their median expression levels per cell for each age group (Supplementary Table 2). Out of 227 genes previously found to be associated with senescence (Supplementary Table 2), 32 were expressed in a larger fraction of cells in older mice compared to younger mice, and the median gene expression in cells which express the genes was significantly different between the two age groups. The most dramatic effect was observed for p16 (Cdkn2a): the fraction of cells expressing the gene more than doubled in older animals in both the FACS and the droplet data (Fig.2g,h), accompanied by a 2-fold increase in the actual expression level by those cells that did express it (Extended Data Figure 2e,f).
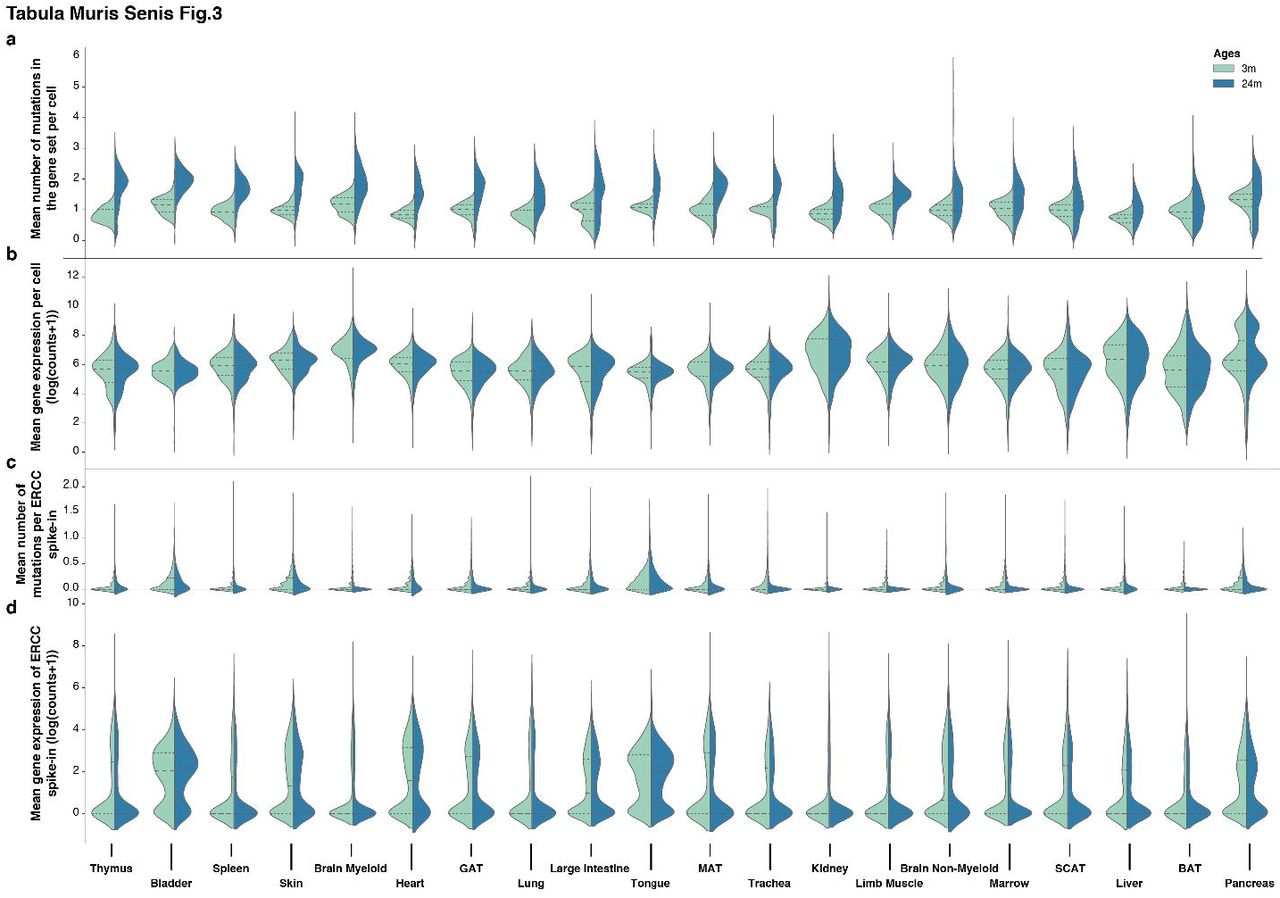
Genomic instability is among the most widely studied aging hallmarks1 and the full-length transcript data from the FACS data allows the analysis of somatic mutation accumulation with age. We used the Genome Analysis ToolKit (GATK)16 to perform SNP and INDEL discovery across all FACS samples simultaneously, using GATK Best Practices recommendations17,18. After removing 1366 genes found to be mutated in more than 50% of the cells, most likely as a result of a systematic difference in the germ line sequence from the reference, we focused on genes expressed in at least 75% of cells for each age group within a particular tissue. We observed an age-related increase in the number of mutations across all of the organs we analyzed (Fig.3a; Extended Data Fig.6a), with thymus and bladder being the most affected (Supplementary Table 3). This effect is larger than technical errors due to amplification and sequencing errors, which can be estimated using ERCC controls that were spiked into each well of the microtiter plates19 (Fig.3c; Extended Data Fig.6b). Our analysis also accounts for sequencing coverage and gene expression levels, using a gene set that did not change its expression with age (Fig.3b,d). Despite the fact that it is difficult to infer genome-wide mutation rates from the transcriptome, which is known to inflate apparent mutational rates for a variety of reasons19, the observed trend is a useful indirect estimate of mutational frequency and genome stability.

a,b, Mean number of somatic mutations (a) and raw expression (b) across all tissues per age group (3m and 24m). c,d, Mean number of mutations in ERCC spike in (c) and ERCC raw expression (d) across all tissues per age group (3m and 24m). Mutations are presented as the mean number of mutations per gene per cell.
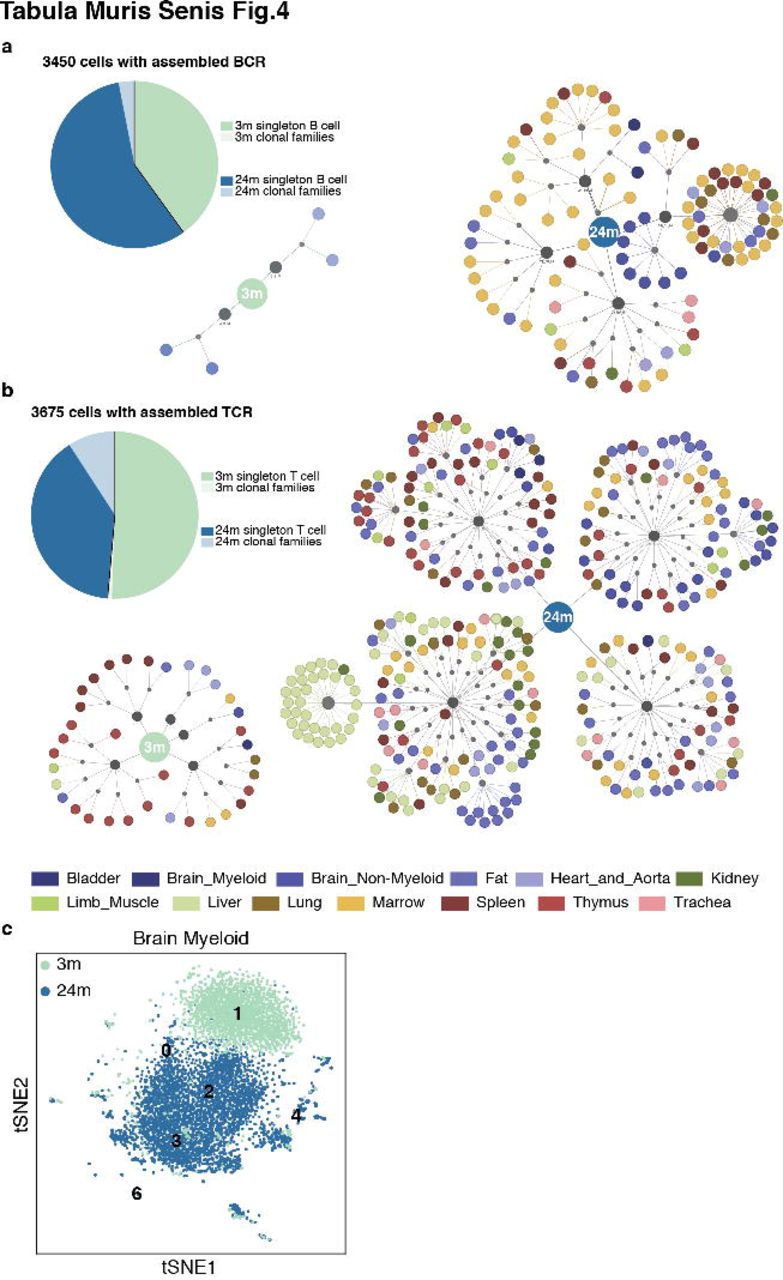
A final hallmark of aging which we investigated was how age-related changes may affect the immune system2. We computationally reconstructed the sequence of the B-cell receptor (BCR) and T-cell receptor (TCR) for B cells and T cells present in the FACS data using singlecell-ige and TraCeR, respectively20,21. We created an extended group of putative immune cells totaling 49,344 cells. Out of those, BCRs were assembled for 3,450 cells (Fig.4a) and TCRs for 3,675 cells (Fig.4b). The number of cells with assembled BCRs was roughly equal between 3m and 24m old mice (1,382 and 2,068 cells, respectively). We parsed the singlecell-ige20 output to define B-cell clonotypes based on the sequence of the assembled BCR (Supplementary Tables 4&5; see Extended Methods) and found that while most of the cells at 3m were not part of a clone, the number of B-cells belonging to a clonotype increased by a factor of twenty at 24m (~5%).

a, B-cell clonal families. The pie chart shows the proportion of singleton B cells and B cells that are part of clonal families at 3m and 24m. For each time point, the clonal families are represented in a tree structure for which the central node is age (blue). Connected to the age node there is an additional node (gray) that represents each animal and the clonal families are depicted for each animal. For each clonal family, cells that are part of that family are color coded by the organ of origin. b, T-cell clonal families. The pie chart shows the proportion of singleton T cells and T cells that are part of clonal families at 3m and 24m. For each time point, clonal families are represented in a tree structure for which the central node is age (blue). Connected to the age node there is an additional node (gray) that represents each animal and the clonal families are depicted for each animal. For each clonal family, cells that are part of that family are color coded by the organ of origin. c, t-SNE plot of the Brain Myeloid Louvain clusters (numbers) colored by age.
The number of cells with assembled TCRs were also roughly equal between 3m and 24m (1,895 and 1,780 cells, respectively). Clonotype assignment is part of the output obtained by TraCeR21 (Supplementary Table 6). Interestingly, only 33 out of 1,895 cells at 3m were part of a clone. For 24m, 333 out of 1,780 cells were part of a clone, indicating again an increase in clonality of the T-cell repertoire at later ages. These changes in clonality for both B and T cell repertoires are noteworthy because they suggest that the immune system of a 24m mouse will be less likely to respond to new pathogens, corroborating the literature suggesting that older individuals have higher vulnerability to new infections and lower benefits from vacination22,23.
In addition to changes in the clonality of B cells and T cells, we observed additional changes affecting cells of the immune system across different organs. Using brain as an example (Fig.4c), the majority of microglia transition from Cluster 1, to Clusters 2 and 3 as the animals age. Cluster 3 is mainly comprised of 24-month old microglia. These cells (Cluster 3) up-regulate MHC class I genes (H2-D1, H2-K1, B2m), along with a number of genes associated with degenerative disease (e.g. Fth1, Ftl1, Cd9, Cd63, Tyrobp, Ctsz, Cyba)24,25. Cluster 4 (predominantly from aged mice) is enriched with interferon responsive or regulatory genes (e.g. Oasl2, Oas1a, Ifit3, Rtp4, Bst2, Stat1, Irf7, Ifitm3, Usp18, Isg15, Ifi204, Dhx58, Ifit2), suggesting an expansion of this small pro-inflammatory subset of microglia in the aging brain26.
To characterize a potential cell-extrinsic aspect of aging in parallel with tissue analysis, we collected stool samples from the same mice prior to anaesthetization and performed 16S rRNA amplicon sequencing to identify the bacterial community composition in the gastrointestinal tract in mice of different ages. The number of observed species was significantly lower at 1 month than at 21, 24 and 30 months (almost two-fold lower, p≤ 0.01 based on a repeated measures ANOVA test considering cage effects; Extended Data Fig.7a). Shannon diversity (Extended Data Fig.7b) declines gradually after 21 months (p≤ 0.01 based on a repeated measures ANOVA test considering cage effects), with 30 month-old mice having the lowest microbiota diversity compared to all the other time points (p≤0.01, repeated measures ANOVA test considering cage effects). The decrease in Shannon diversity at 30 months, despite maintenance of observed species at this age, suggests increasing unevenness in the gut community in older mice; indeed, the microbiotas of 30 month-old mice all had a dominant taxon present at >33% (Extended Data Fig. 7c). To further identify the basis of this unevenness in the gut community, we examined relative abundance at various taxonomic levels. At the phylum level, we found that Bacteroidetes increased at later ages (21 months), with a commensurate decrease in Firmicutes; Proteobacteria decreased to almost undetectable levels after the first month (Extended Data Fig. 8). The age-associated dominance of Bacteroidetes over Firmicutes has been previously described in human subjects27. The Bacteroidetes dynamics are largely accounted for by the Parabacteroides genus (class Bacteroidia), and the decrease in Firmicutes is roughly evenly distributed between the Bacilli and Clostridia classes (Extended Data Fig. 8).
The Tabula Muris Senis is a comprehensive resource for the cell biology community which offers a detailed molecular and cell-type specific portrait of aging. We view such a cell atlas as an essential companion to the genome: the genome provides a blueprint for the organism but does not explain how genes are used in a cell type specific manner or how the usage of genes changes over the lifetime of the organism. The cell atlas provides a deep characterization of phenotype and physiology which can serve as a reference for understanding many aspects of the cell biological changes that mammals undergo during their lifespan.
Supplementary Tables
Supplementary Table 1. Number of cells for the FACS and the droplet datasets. The data is grouped per age, sex, mouse and organ.
Supplementary Table 2. Fraction of cells expressing senescence markers. The values correspond to the median expression levels per cell for each age group. The senescence marker gene list was collected from Ingenuity Pathway Analysis (Fall 2018 release, Qiagen) by exporting all genes associated with the search term senescence.
Supplementary Table 3. Summary statistics for the GATK analysis.
Supplementary Table 4. singlecell-ige assembly workflow output. This file is a counts table where each row is an Ensembl gene and each column is a cell
Supplementary Table 5. singlecell-ige alignment workflow output. This table contains parsed assembly data from all cells.
Supplementary Table 6. TraCeR output table.
Methods
All data, protocols, analysis scripts and an interactive data browser are publicly available.
Mice and organ collection
Male and virgin female C57BL/6JN mice were shipped from the National Institute on Aging colony at Charles River (housed at 67–73 °F) to the Veterinary Medical Unit (VMU; housed at 68–76 °F)) at the VA Palo Alto (VA). At both locations, mice were housed on a 12-h light/dark cycle and provided food and water ad libitum. The diet at Charles River was NIH-31, and Teklad 2918 at the VA VMU. Littermates were not recorded or tracked, and mice were housed at the VA VMU for no longer than 2 weeks before euthanasia, with the exception of mice older than 18 months, which were housed at the VA VMU beginning at 18 months of age. Before tissue collection, mice were placed in sterile collection chambers at 8 am for 15 min to collect fresh fecal pellets. After anaesthetization with 2.5% v/v Avertin, mice were weighed, shaved, and blood was drawn via cardiac puncture before transcardial perfusion with 20 ml PBS. Mesenteric adipose tissue was then immediately collected to avoid exposure to the liver and pancreas perfusate, which negatively affects cell sorting. Isolating viable single cells from both the pancreas and the liver of the same mouse was not possible; therefore, two males and two females were used for each. Whole organs were then dissected in the following order: large intestine, spleen, thymus, trachea, tongue, brain, heart, lung, kidney, gonadal adipose tissue, bladder, diaphragm, limb muscle (tibialis anterior), skin (dorsal), subcutaneous adipose tissue (inguinal pad), mammary glands (fat pads 2, 3 and 4), brown adipose tissue (interscapular pad), aorta and bone marrow (spine and limb bones). Organ collection concluded by 10 am. After single-cell dissociation as described below, cell suspensions were either used for FACS of individual cells into 384-well plates, or for preparation of the microfluidic droplet library. All animal care and procedures were carried out in accordance with institutional guidelines approved by the VA Palo Alto Committee on Animal Research.
Tissue dissociation and sample preparation
All tissues were processed as previously described7.
Sample size, randomization and blinding
No sample size choice was performed before the study. Randomization and blinding were not performed: the authors were aware of all data and metadata-related variables during the entire course of the study.
Single-cell methods
All protocols used in this study are described in detail elsewhere7. Those include: i) preparation of lysis plates, ii) FACS sorting, iii) cDNA synthesis using the Smart-seq2 protocol28,29, iv) library preparation using an in-house version of Tn530,31,v) library pooling and Quality control and vi) sequencing. For further details please refer to http://dx.doi.org/10.17504/protocols.io.2uwgexe
Microfluidic droplet single-cell analysis
Single cells were captured in droplet emulsions using the GemCode Single-Cell Instrument (10x Genomics), and scRNA-seq libraries were constructed as per the 10x Genomics protocol using GemCode Single-Cell 3′ Gel Bead and Library V2 Kit. In brief, single cell suspensions were examined using an inverted microscope, and if sample quality was deemed satisfactory, the sample was diluted in PBS with 2% FBS to a concentration of 1000 cells per μl. If cell suspensions contained cell aggregates or debris, two additional washes in PBS with 2% FBS at 300gfor 5 min at 4 °C were performed. Cell concentration was measured either with a Moxi GO II (Orflo Technologies) or a haemocytometer. Cells were loaded in each channel with a target output of 5,000 cells per sample. All reactions were performed in the Biorad C1000 Touch Thermal cycler with 96-Deep Well Reaction Module. 12 cycles were used for cDNA amplification and sample index PCR. Amplified cDNA and final libraries were evaluated on a Fragment Analyzer using a High Sensitivity NGS Analysis Kit (Advanced Analytical). The average fragment length of 10x cDNA libraries was quantitated on a Fragment Analyzer (AATI), and by qPCR with the Kapa Library Quantification kit for Illumina. Each library was diluted to 2 nM, and equal volumes of 16 libraries were pooled for each NovaSeq sequencing run. Pools were sequenced with 100 cycle run kits with 26 bases for Read 1, 8 bases for Index 1, and 90 bases for Read 2 (Illumina 20012862). A PhiX control library was spiked in at 0.2 to 1%. Libraries were sequenced on the NovaSeq 6000 Sequencing System (Illumina).
Data processing
Sequences from the NovaSeq were de-multiplexed using bcl2fastq version 2.19.0.316. Reads were aligned using to the mm10plus genome using STAR version 2.5.2b with parameters TK. Gene counts were produced using HTSEQ version 0.6.1p1 with default parameters, except ‘stranded’ was set to ‘false’, and ‘mode’ was set to ‘intersection-nonempty’. Sequences from the microfluidic droplet platform were de-multiplexed and aligned using CellRanger version 2.0.1, available from 10x Genomics with default parameters.
Clustering
Standard procedures for filtering, variable gene selection, dimensionality reduction and clustering were performed using the Scanpy32 Python package version 1.4 (https://scanpy.readthedocs.io).
Cell type annotation
To define cell types we analyzed each organ independently, but combining all ages. In a nutshell, we performed principal component analysis on the most variable genes between cells, followed by nearest-neighbor graph-based clustering. Next we subset the data for 3m (Tabula Muris7) and compute how many cell types map to each individual cluster. For the clusters that we had a single 1:1 mapping (cluster:cell type) we propagate the annotations for all ages; in case there is a 1:many mapping we flagged that cluster for manual validation. For the clusters that we need to manual validate we used cluster-specific gene expression of known markers and genes that are differentially expressed between clusters to assign cell-types annotations to each cluster. Using this method, we were able to annotated automatically (~1min per tissue) over 70% of the dataset and together with manual curation we confidently annotated >95% of all the cells. While comparing gene expression levels across datasets is not straightforward, we had in our favor the fact that the data in Tabula Muris and the new data have been consistently generated. Step-by-step instructions to reproduce this method are are available from GitHub. For each cluster, we provide annotations in the controlled vocabulary of the cell ontology to facilitate inter-experiment comparisons.
T-Cell processing
We used TraCeR21 version 0.5 to identify T-Cell clonal populations. We ran tracer assemble with--species Mmus set. We then ran tracer summarise with –species Mmus to create the final results. We used the following versions for TraCeR dependencies: igblast version 1.7.0, kallisto version v0.43.1, Salmon version 0.8.2, Trinity version v2.4.0, GRCm38 reference genome.
B-Cell processing
We used singlecell-ige20 version eafb6d126cc2d6511faae3efbd442abd7c6dc8ef (https://github.com/dcroote/singlecell-ige) to identify B-Cell clonal populations. We used the default configuration settings except we set the species to mouse.
Mutation analysis
We used samtools33 version 1.9 and GATK16 version v4.1.1.0 for mutation analysis. We used samtools faidx to create our index file. Then we used GATK CreateSequenceDictionary and GRCm38, as the reference, to create our sequence dictionary. Next we used GATK AddOrReplaceReadGroups to create a single read group using parameters -RGID 4 -RGLB lib1 -RGPL illumina -RGPU unit1 -RGSM 20.
Finally we used GATK HaplotypeCaller to call the mutations. We disabled the following read filters: MappingQualityReadFilter, GoodCigarReadFilter, NotSecondaryAlignmentReadFilter, MappedReadFilter, MappingQualityAvailableReadFilter, NonZeroReferenceLengthAlignmentReadFilter, NotDuplicateReadFilter, PassesVendorQualityCheckReadFilter, and WellformedReadFilter, but kept all other default settings.
Code availability
All code used for analysis is available on GitHub (https://github.com/czbiohub/tabula-muris-senis).
Acknowledgements
We thank Sony Biotechnology for making an SH800S instrument available for this project. Some cell sorting/flow cytometry analysis for this project was done on a Sony SH800S instrument in the Stanford Shared FACS Facility. Some fluorescence activated cell sorting (FACS) was done with instruments in the VA Flow Cytometry Core, which is supported by the US Department of Veterans Affairs (VA), Palo Alto Veterans Institute for Research (PAVIR), and the National Institutes of Health (NIH). We thank James Zou and his research group for insightful discussions of the data.


