

Abstract
Patient derived organoids (PDOs) closely resemble individual tumor biology and allow testing of small molecules ex vivo. To systematically dissect compound effects on 3D organoids, we developed a high-throughput imaging and quantitative analysis approach. We generated PDOs from colorectal cancer patients, treated them with >500 small molecules and captured >3 million images by confocal microscopy. We developed the software framework SCOPE to measure compound induced re-organization of PDOs. We found diverse, but re-occurring phenotypes that clustered by compound mode-of-action. Complex phenotypes were not congruent with PDO viability and many were specific to subsets of PDO lines or were influenced by recurrent mutations. We further analyzed specific phenotypes induced by compound classes and found GSK3 inhibitors to disassemble PDOs via focal adhesion signaling or that MEK inhibition led to bloating of PDOs by enhancing of stemness. Finally, by viability classification, we show heterogeneous susceptibilities of PDOs to clinical anticancer drugs.
Introduction
Patient derived organoids (PDOs) are physiological 3D tumor models that can be derived from cancerous and normal tissues1–3. In the colon, this is based on isolation of Lgr5+ stem cells that form organotypic structures and are expandable in vitro4. Organoid isolation from human primary tumors and metastases1,5 has enabled the establishment of living PDO biobanks2,3,6–8. Notably, PDOs have been shown to retain the molecular and morphological characteristics of the tissue/tumor of origin2,3,5,9, thereby allowing functional analyses of individual tumors ex vivo. So far, medium-scale drug screenings with luminescence based viability assay systems have been successfully performed in PDOs3,6.
High-throughput image-based profiling is used to measure a variety of morphological phenotypes in cells. Combined with chemical or genetic perturbations, this is a powerful method to gain systematic insights into biological processes10–12. For instance, image-based assays have been used to screen large libraries of small molecules to identify potential drug candidates, to analyze a drugs mode of action, or to classify drug-gene interactions by complex cell-morphology phenotypes12–14. Major challenges for high-throughput imaging assays include the standardization of experimental pipelines as well as the handling and automated analysis of large imaging data sets for a quantitative understanding of biological processes 15. Applying high-throughput imaging to three-dimensional organoid models for the analysis of more complex, multicellular phenotypes will open new windows to unravel the mode-of-action and resistance mechanisms of drugs and to improve personalized medicine. However, the complex 3D structure of organoid models pose experimental and data-analysis challenges for image-based high-throughput screening. Therefore, novel experimental and bioinformatics pipelines are needed that allow standardized experimentation and analysis of large imaging datasets.
In this study, we established a biobank of colorectal cancer PDOs from endoscopic biopsies of 19 patients by following a standardized clinical and laboratory workflow. To profile drug-induced sensitivities and phenotypes, we established a high-throughput pipeline for image-based compound profiling and automated image analysis of PDOs. We treated PDOs with a large experimental and a clinical compound library and captured their phenotypic profiles. We established SCOPE as a software framework for automated processing and analysis of large-scale 3D imaging data and generated profiles of morphological PDO drug responses on a single organoid level. Our experiments revealed heterogeneous PDO morphologies and a rich spectrum of reoccurring compound-induced phenotypes. Multicellular phenotypes clustered by compound mode-of-action and showed specificity to subsets of PDO lines. Additionally, we analyzed viability effects of compounds on PDOs and identified individual susceptibilities.
Results
Establishment of patient derived organoids for high-throughput image-based profiling
PDOs can be established from different epithelial tissues or tumors and have been shown to represent their tissue and tumor of origin with respect to morphologic and molecular features 1–3,5,7,16. To generate personalized cancer models for phenotypic compound screening, we built a standardized clinical and laboratory workflow to generate PDOs from patients with colorectal cancer using endoscopic biopsy samples (Figure 1a).

a, A standardized workflow for PDO establishment and high-throughput image-based drug profiling. Biopsies were taken via endoscopy from patients with colorectal cancer and PDOs were isolated according to a standardized protocol. For high-throughput compound profiling, PDOs were dissociated and evenly seeded in 384-well plates before perturbation with large experimental and clinical compound libraries. Morphological PDO response and overall viability were studied by high-throughput fluorescence microscopy and automated image analysis. b-e, Characteristics of 19 PDO lines undergoing molecular characterization. b, Tumor location (right/left/rectum) and AJCC/UICC stage of colorectal cancers that PDOs were derived from. c, Consensus molecular subtypes of PDOs determined by RNA expression analysis. Most PDOs represented the canonical CMS2 subtype, which is most frequently observed (Guinney et al., 2015). d, Mutation status in PDOs as analyzed by amplicon sequencing. APC and TP53 mutations were most frequently observed, in accordance with previous data from colorectal cancer (Cancer Genome Atlas Network, 2012). e, Examples of H&E stained slides of selected representative PDO cultures; scale bar: 25μm. Compare Figure S1 for details on case numbers and performed screening assays.
We prospectively developed PDOs from 19 patients with colorectal cancer in different clinical stages, which were regularly followed-up during their course of disease (Figure 1b, Supplemental Table S1). We performed molecular characterizations of PDO lines including expression profiling and amplicon sequencing of frequently altered genes in colorectal cancer (Figure 1c-d). This revealed mutational profiles that are characteristic for colorectal cancer with a high frequency of APC (47%), KRAS (47%) and TP53 (36%) mutations, in accordance with previous data17 (Figure 1d, Supplemental Table S2). On a transcriptional level, PDOs mainly represented the canonical consensus molecular subtype (CMS 2) of colorectal cancer18. In line with previous observations3,6, we found that PDOs showed a typical, yet heterogeneous morphology resembling colorectal cancer in H&E stained tissue sections (Figure 1e).
Automated morphological analysis of patient derived organoids
To systematically measure morphological phenotypes of PDOs and their alterations upon treatment with a large number of compounds, we established a framework for image-based drug profiling experiments (Figure 2a). Organoids were digested with trypsin, mechanically dissociated and filtered through a cell strainer to seed small fragments evenly onto 384-well imaging plates with basement membrane extract. We standardized the amount and size of seeded organoid fragments in order to reliably measure organoid phenotypes after perturbation. Also, the z-level of PDO fragments within the BME layer was controlled in order to allow imaging of PDOs within confocal layers. PDO fragments were incubated for three days to allow organoid formation before drug treatment. Subsequently, PDOs were treated with two compound libraries with a total of 527 small molecule inhibitors. Among them were 63 clinically used compounds that were added in 5 different concentrations (Clinical cancer library, N = 15 PDO lines) and a large experimental library (Ki-Stem library, N = 13 PDO lines) of 464 compounds (842 treatments in total; Figure S1 and Supplemental tables S3 and S4). Compounds were selected to target diverse developmental and signaling pathways, as well as clinically relevant targets for compound profiling. After four days of compound treatment, organoids were fixed and stained for actin (Phalloidin/TRITC), DNA (DAPI), and cell permeability (DeadGreen/FITC). Subsequently, plates were imaged at multiple z-positions by automated confocal microscopy. The procedure was repeated to generate two independent biological replicates of every PDO line.

a, An automated workflow for high-throughput confocal image processing and analysis (SCOPE framework). Four fields per well with z-stacks of 16 slices (z-steps of 5μm and a depth of field of 3.9μm) were acquired in three channels (DNA/DAPI, actin/TRITC, permeability/FITC) at 10x magnification. The multi-channel 3D image stack was projected onto a plane by retaining the pixel information with the strongest contrast to its neighboring pixels. A deep convolutional neural network subsequently recognized complete foreground organoids in the projected 2D image. Segmented objects that passed quality controls were analyzed and descriptive features extracted to quantify phenotypes. b, Segmentation of organoids in projected images. First, organoids were segmented based on fluorescence channel intensity (middle). The intensity segmentation was then used to train a deep convolutional neural network (DCNN) for object identification (right) improving the segmentation results by far; Representative segmentation results of 2 selected PDO lines are shown; scale-bar: 400μm. c, Replicate correlation of descriptive organoid features. Organoid-level features were aggregated on a well-wise basis. Individual features from two profiling replicates were correlated for every PDO line (973 features, including number of organoids per well as additional feature). Pearson correlation coefficients of all features are plotted in descending order for every PDO line individually. d, Hierarchical clustering of unperturbed organoid profiles shows distinct organoid-phenotype subsets. Principal components were calculated on well-based organoid phenotypes and subsequently aggregated by line. Proportion of variance of principal components is indicated (right). Color code: reds = disorganized, green = intermediate, blues = organized. e, Examples of unperturbed organoid from each subset. The morphologic classes of untreated organoids from d can be visually grouped by different degrees of intra-organoid organization, ranging from disorganized (compact) to organized (cystic) morphologies. Shown are representative images and descriptive features, arranged and color coded as classified in d. Descriptive feature plots show the median phenotype of unperturbed organoids derived from the same patient. Shown are six key features (area, actin intensity, DNA intensity, permeability, and two permeability related texture features: FITC Haralic angular second moment (ASM) and FITC intensity 1-percentile). Features are presented as z-score relative to all profiled organoid lines; scale-bar: 200μm. f, Volcano plot of differentially expressed genes between PDOs from the “organized” category (compare Figure 2d-e, blue groups) and other PDO lines (“disorganized” and “intermediate” groups). Blue dots indicate LGR5+ signature genes. Yellow dots indicate genes included in the proliferation signature (Merlos-Suárez et al., 2011). Statistical significance was assessed using a moderated t-test. The horizontal lines indicate 5% false discovery rate.
To rapidly analyze 3D imaging data of organoids, we developed a software framework called SCOPE (Selective 3D imaging for Contrast based Organoid Projection and feature Extraction). First, we projected the 3D image data onto a plane by applying a maximum contrast projection. This is an algorithm that uses the contrast surrounding a given pixel to determine the focal plane, allowing a precise structure detection and 2D representation of 3D objects. Next, individual organoids were segmented using a deep convolutional neural network. We developed a two-step procedure to establish segmentation: First, organoids were segmented based on fluorescence intensity of all channels. Then we used the intensity segmentation data to train a deep convolutional neural network for object identification. This improved the segmentation results by far, as observed by visual inspection (Figure 2b). Subsequently, morphological profiles were calculated for each individual organoid, yielding 486 phenotypic features. These features include shape features, such as area and eccentricity, features describing the intensity distributions of each color channel, and texture features. Median and median absolute deviation of all features grouped on a well-wise level (973 features in total, including number of organoids per well as additional feature) showed a robust correlation between biological replicates (Figure 2d).
Morphological diversity of organoids in unperturbed state
PDOs showed significant morphological diversity between lines derived from different donors. Therefore we first aimed to systematically assess the diversity of phenotypes between different PDO lines in their untreated state. We computed an automated morphological classification of PDO lines using the SCOPE pipeline. To this end, we aggregated features across all PDO-lines and reduced their dimensionality by principal component analysis (PCA, Figure 2d, Supplemental Figure S2). After hierarchical clustering of morphological profiles by organoid line, we identified six distinguishable phenotypic subsets of colorectal cancer organoids (Figure 2d). By visual inspection, we observed that these phenotypic subsets were characterized by a different degree of of intra-organoid organization ranging from disorganized (irregular shaped, compact or solid looking organoids) to more “organized” (round, regular shaped organoids with a smooth wall and a defined large lumen / cystic morphology). “Intermediate” PDOs had features of both categories. (Figure 2e). Based on this categorization, we investigated molecular differences between the identified subgroups. Morphological organoid subtypes did not match an unsupervised clustering of expression profiles and, we did not observe associations with cancer mutations analyzed or clinical variables. Interestingly, however, gene set enrichment analysis (GSEA) and testing for stem cell signatures19 revealed upregulation of Lgr5+ stem cell signature-related genes within the group of organized PDOs (blue) when compared to intermediate and disorganized PDOs (FDR=8.8E-3, NES=1.67). In contrast, the disorganized and intermediate PDO groups were enriched in signatures related to cell proliferation (FDR=6.7E-4, NES=1.93, Supplemental Figure S1b). We conclude that heterogeneous PDO phenotypes can be grouped into a limited set of morphological classes that are associated with defined molecular differences.
Machine learning differentiates between lethal and non-lethal PDO phenotypes
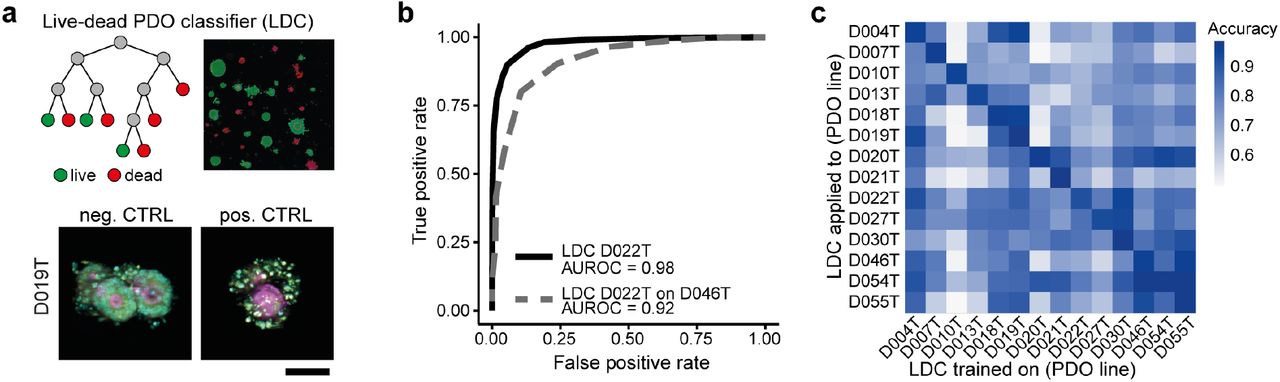
We demonstrated that high-throughput image-based profiling of PDOs can be used to identify morphological subclasses. To analyze compound induced morphological phenotypes, we first aimed to identify viability effects and the corresponding morphological profiles. We trained random forest live-dead classifiers (LDC) using organoid profiles from negative (DMSO) and positive controls (high-dose bortezomib and sn-38), based on single-organoid features generated with the SCOPE framework for every PDO line (Figure 3a). We analyzed receiver-operating characteristics (ROC) for all classifiers, revealing exceptional classification performance when applied to independent validation sets of positive and negative controls from the same PDO lines they were initially trained on (area under receiver operating characteristic curve (AUROC): 0.97 – 0.99, Figure 3b). Applying the classifiers to different PDO lines (which they were not initially trained on) also led to high classification performance in most PDO-line-classifier pairs (Figure 3c).

a, Live-dead PDO classifiers (LDC) were trained on the feature sets of negative- (DMSO, bottom left) and positive controls (high-dose bortezomib and SN-38, bottom right, Cyan = DAPI, magenta = Phalloidin, yellow = cell permeability; average images were selected and embedded in black background; scale bar: 50μm.) for every PDO line based on a random-forest classifier. b, Receiver operator characteristic curves (ROCs) were analyzed on validation sets of negative- and positive controls of the same lines and other lines. A representative example is shown (LDC trained on a set of D022T and used on a validation set of the same line (black) or a different line (D046T, grey). The AUROC (area under the receiver operating characteristic curve) is depicted below. c, Systematic analysis of the transfer-performance of all LDCs when applied across data from all PDO lines. Classification performance is measured as the AUROC (area under the receiver operating characteristic curve).
Further analyses revealed robust quality of our imaging assay and LDC with high reproducibility of LDC between biological replicates (Pearson correlation = 0.85 for the whole dataset and 0.67 −0.93 for individual PDO lines, Supplemantary Figure S3a-b) and a high fraction (median = 0.98) of PDOs correctly classified as “viable” in DMSO controls (Supplemental Figure S3c). Notably, by testing if a classifier relying on less information (i.e. fewer channels and fewer dyes) would result in similar accuracy, we found that classifiers relying on a combination of actin/TRITC and DNA/DAPI staining alone (mean accuracy 0.958) led to accuracies almost as high as the ones including cell permeability/FITC (mean accuracy 0.968, Supplemental Figure S3d). We also compared the viability prediction of our high-throughput imaging and LDC pipeline with a luminescence based metabolic (ATP-based) viability assay. Similar assays have previously been published3,6. We used our clinical cancer library for these analyses and performed viability profiling with CellTiter-Glo (CTG) and high-throughput-imaging with LDC in parallel (Supplemental Figure S5a). With the CTG-based read-out, we also observed high reproducibility among biological replicates and no relevant batch effects (Supplemental Figure S4a-d). The correlation between results obtained with both viability read-outs was generally high (Pearson correlation = 0.87, Supplemental Figure S5b), proving validity of our workflow. However, we also identified several examples with divergent results, such as the anti-folate drug methotrexate (Supplemental Figure S5c-g).
In conclusion, we established a robust classifier that can differentiate between viable and dead organoids in high-throughput imaging data.
Individual drug susceptibilities of PDOs and associations with molecular characteristics
We next used our live-dead classifier on the dataset of PDO lines profiled with the large experimental compound library (Ki-Stem library). We found that several compounds induced heterogeneous viability responses, killing subsets of PDO lines (e.g. EGFR-inhibitors, MEK-inhibitors, PLK-inhibitors), while others affected all organoid lines (e.g. CDK-inhibitors, Figure 4a). To test associations of PDO viability with molecular characteristics, we looked at some treatments in more detail. For instance, PDO lines that showed decreased viability upon EGFR inhibition had wild-type RAS alleles, while resistant organoid lines carried RAS mutations (including KRAS or NRAS, Figure 4b). Interestingly, only a subset of RAS mutant PDO lines were strong responders to MEK inhibition. We used our drug profiling dataset with 63 clinical anticancer drugs in five concentrations to calculate differential drug effects in PDOs by comparing areas under the dose response curves (AUCs) of each compound (Figure 4c, Supplemental Figure S6a-b). More than half of the clinical compounds led to strong and/or heterogeneous responses among PDO lines. While some lines were generally resistant to the majority of compounds (e.g. D007T), others were susceptible to several cytotoxic drugs like docetaxel or vinblastin and targeted therapies like erlotinib, afatinib and others (e.g. D021T, D020T, D027T) The majority of PDO lines responded at least to one of the tested drugs (Figure 4c, Supplemental Figure S6a, b). Next, we analyzed associations of drug response or resistance towards targeted therapies with molecular characteristics of PDOs (Figure 4d-f, Supplemental Figure S6d-f). For example, response to nutlin3a treatment, an MDM2 inhibitor, (Figure 4d, Supplemental Figure S6d) was significantly associated with TP53 mutational status (Figure 4d, Supplemental Figure S6e) and relative enrichment of gene expression associated with p53 signaling (Reactome R-HSA-5633008; q = 0.004; Figure 7e, Supplemental Figure S6f)20.

a, An experimental library compromising 464 compounds was profiled with high-throughput imaging, viability of PDOs (N=13) was clustered after live-dead classification (LDC). b, Clusters enriched for MEK inhibitors and EGFR inhibitors are shown in detail. RAS mutations include hot spots in both, KRAS and NRAS. Data for D013T treated with Pimasertib is missing due to complication during image acquisition. (c) Clustering of differential compound responses. Areas under the dose-response curve (AUCs) for 14 PDO lines and a library of 63 anticancer drugs screened in 5 concentrations were measured by image based profiling and LDC. Estimated AUCs for a particular treatment and line were centered to the median AUC across all lines. Treatments with differential viability are plotted. (d-f) Nutlin3a response is associated with TP53 mutation status. Viability was analyzed by high-throughput imaging with LDC. Additional PDO lines were profiled in parallel with the CTG viability assay shown in Supplemental Figure S6d-f. d, Comparison of AUC values from high-throughput imaging and LDC between 14 PDO lines with mutant (n = 6) and wild-type (n = 8) TP53. Each dot represents one organoid line. Horizontal red bars indicate the group means. Statistical significance was tested using a permutation test with 10,000 Monte Carlo resamples and the false discovery was controlled using the Benjamini-Hochberg method. e, Volcano plot of differentially expressed genes between 14 organoid lines that are more or less sensitive to nutlin3a treatment according to image based profiling and LDC. Blue dots indicate genes that were more highly expressed in organoid lines sensitive to the drug treatment. Yellow dots indicate genes that were found to be expressed more highly in organoid lines with increased resistance to the drug treatment. Statistical significance was assessed using a moderated t-test. The horizontal lines indicate 5% false discovery rate (FDR). f, Dose-response curve of nutlin3a determined by determined by high-throughput imaging and LDC. TP53 mutated cases are highlighted in black. g-i, Examples of dose response curves from targeted and conventional anticancer agents not currently used in colorectal cancer care showing differential responses between PDO lines (responder = black, non-responder = grey). Viability was determined by high-throughput imaging and LDC.
Several other targeted therapies and conventional chemotherapeutics not currently used for colorectal cancer therapy showed differential response profiles among PDO lines that could not be explained by the assessed genomic alterations or expression subtypes (Figure 4f-h, Supplemental Figure S6g-i). These findings suggest that functional drug testing with PDOs might help to develop novel therapeutic strategies and identify predictive markers ex vivo.
High-throughput imaging identifies compounds by mode-of-action
Beyond viability classification, we aimed to characterize compound response of PDOs in in more comprehensive and unbiased way. Diverse morphological responses to compound treatments have previously been reported for 2D monolayer cell culture models10,12,13. Therefore, we next aimed to investigate if complex phenotypic responses to small molecule treatments can be measured in three-dimensional, multicellular PDOs by automated image analysis.
We applied a support vector machine (SVM) approach on single organoid level data to describe compound induced morphological changes. Organoid profiles were measured after treatment with the Ki-Stem library of 464 compounds targeting developmental and signaling pathways (Figure 5a). We trained SVM classifiers to separate perturbed from unperturbed organoid profiles for every PDO-line and compound using the PCA-transformed single organoid features. Next, we selected active compound treatments in which robust morphological changes were observed in at least one line. We defined a compound treatment to be “active”, when treated and untreated organoids could be correctly identified by their corresponding SVM leading to an area under the receiver operating characteristic curve (AUROC) of 0.85 or greater (Figure 5b). Using approach, we identified between 92-192 active compounds across tested PDO lines (Supplemental Figure S7a).

a, Measuring drug-induced phenotypes using single-organoid data with a support vector machine (SVM) based approach. To define the phenotypic change that organoids undergo after treatment with drug A, an SVM classifier is trained to distinguish between individual untreated and treated organoids in a multidimensional PCA-transformed feature space. A normal vector (red) orthogonal to the SVM-hyperplane is used to describe the induced phenotype. Phenotype-vectors from multiple compound treatments can be compared by measuring the enclosed angle. Smaller angles between vectors (Drug C and D) represent more similar drug induced phenotypes than larger angles (Drug A and B). b, Histogram of compound treatment activities. A compound treatment of a given PDO line is tested for its activity to induce a diverging phenotype (compared to negative control DMSO) by assessing the classification performance of its corresponding SVM. Treatments in which the SVM reaches a classification performance of >0.85 area under the receiver operating characteristic curve (AUROC) are considered active. c, A map of related compound induced phenotypes across all organoid lines (N=13). Shown are multiple clusters with small angles between the aggregated normal vectors (i.e. similar compound induced phenotypes). Selected clusters enriched with the same perturbed molecular target are color-labeled. Clusters enriched with MEK inhibitors, CDK inhibitors, mTOR inhibitors, EGFR inhibitors and GSK3 inhibitors are zoomed out to show compounds exhibiting similar compound related phenotypes induced by effects on- or off the primary target. Fisher’s exact test was used to identify enrichments of compounds with the same mode of action. d, Significantly enriched clusters of compound induced phenotypes contain lethal, non-lethal and sub-lethal phenotypes. LDC was applied to profiling data from 13 PDO lines treated with 464 experimental compounds. Compounds (on the x-axis) were arranged in the same order as in c, to analyze viability of the compound induced multiparametric clusters identified with the SVM approach.
After filtering for active treatments across all PDO lines, we grouped induced phenotypes by determining the angle between unit vectors of their respective SVM-hyperplanes, so that treatments leading to similar drug induced phenotypes (i.e. with a small angle between SVM vectors) were grouped together. We found that PDO phenotypes induced by compound treatments with shared mechanisms of action had a high degree of similarity. Specifically, aggregating compound induced phenotypic profiles across all PDO lines and applying contingency testing21 showed a strong enrichment of specific mechanisms of action of many different compound classes (Figure 5c, Supplemental Figure S7b-i). For instance, one cluster contained a strong enrichment of MEK-inhibitors. Alongside MEK inhibitors, the cluster included a RAF inhibitor (RAF265) and an ERK inhibitor (ulixertinib), both targeting downstream components of MAPK signaling. Accordingly, the cluster enriched for mTOR inhibitors included one non-mTOR inhibitor (VS5584) targeting PI3K, which also belongs to the AKT/PI3K/mTOR signaling pathway. Notably, the greater meta-cluster containing the AKTi cluster (Supplemental Figure S7) included almost exclusively targets related to AKT/mTOR/PI3K signaling. The glycogen synthase kinase 3 (GSK3) inhibitors clustered together with the protein kinase c (PKC) inhibitor enzastaurin. This is in accordance with previous data, showing that enzastaurin targets the alpha and beta subunits of GSK besides its primary target PKC22. Interestingly, the EGFR inhibitors co-localized with the VEGF inhibitor ZM 306416, which has previously been revealed as potent EGFR inhibitor23 and two BCR-ABL / SRC tyrosine kinase inhibitors (imatinib and saracatinib). The effect of both BCR-ABL TKIs on EGFR is not clear, however, data suggests direct anti-EGFR effects of saracatinib24 and indirect effects of imatinib25. Finally, the cluster enriched for cyclin dependent kinase (CDK) inhibitors also featured two focal adhesion kinase (FAK) inhibitors and one p12 activated kinase (PAK) inhibitor. All three of these targets are closely related to the cell cycle and to apoptosis26,27. Accordingly, we hypothesized that the identified phenotypic cluster would be related to cell cycle arrest or apoptosis.
To analyze the relationship of multiparametric compound induced morphological profiles with PDO viability, we applied our LDC to the dataset. We arranged the viability measurement in the same order as the clustering of multiparametric PDO phenotypes generated with the SVM approach (Figure 5d) to visualize associations between enriched clusters and viability. As expected, this revealed the CDKi cluster to be related to cell death. Alongside, a few other drug induced phenotypic clusters, including those enriched for ATM inhibition, JAK inhibition or PLK inhibition represented dead PDOs. Consequently, these compounds aggregated in a meta-cluster defined by reduced viability in all or most PDO lines. Importantly, however, many other compound induced phenotypes, including those caused by PKC inhibitors, PI3K inhibitors, AKT inhibitors, mTOR inhibitors, WNT inhibitors, SRC inhibitors, VEGFR inhibitors, TGF-beta inhibitors, SRC inhibitors or GSK3 inhibitors were non-lethal or at most sub-lethal. Interestingly, some phenotypes (including those induced by MEK-inhibition or EGFR inhibition) showed viability effects only in a subset of PDO lines.
These analyses demonstrate that phenotypes induced by compounds in multicellular PDOs can be detected by unsupervised, automated image analysis. We found that compound-induced PDO phenotypes clustered by compound mode-of-action. This allows identification of novel modes-of-action or off-target effects of known compounds and can be used to classify compounds with unknown targets. Furthermore, we demonstrated that apart from viability defects, non-or sub-lethal morphological phenotypes are often responsible for compound clustering. Therefore, high-throughput imaging provides an in-depth phenotypic view complementary to viability drug profiling.
Compound-induced organoid phenotypes exhibit biological mechanisms
Next we aimed to characterize the compound induced phenotypes in more detail. Compounds with similar mode-of-action clustered together across different PDO lines, suggesting links to molecular targets and pathways (Figure 6a-c). The strongly enriched organoid phenotype caused by inhibition of MEK signaling for instance led to a cystic reorganization, i.e. development of a detectable lumen or enlargement of an existing lumen, towards round and thin-walled organoids from diverse basal phenotypic subsets (Figure 6a). On the feature level, this phenotype was represented by a greater degree of eccentricity, while actin and DNA intensity were reduced. The RAF (upstream of MEK) inhibitor, as well as the ERK inhibitor (downstream of MEK in the MAPK pathway) found in the MEKi-enriched cluster (compare Figure 5c) exhibited the same cystic phenotype (Supplemental Figure S8a). EGFR inhibition caused a less striking morphology (Supplemental Figure S8b), thereby suggesting the cystic reorganization phenotype to be related to MAPK signaling downstream of RAF kinase level. The cystoid phenotype occurred in PDOs not dying of MEK inhibition (e.g. D007T, D018T, compare Figure 5d) and PDOs with mild viability defects due to the treatment (D019T, D027T). Interestingly, we observed the same phenotype also in PDO lines with strong viability response (D004T, D046T, next to cloudy dead organoid in Figure 6a), suggesting that this phenotype is independent of PDO viability.
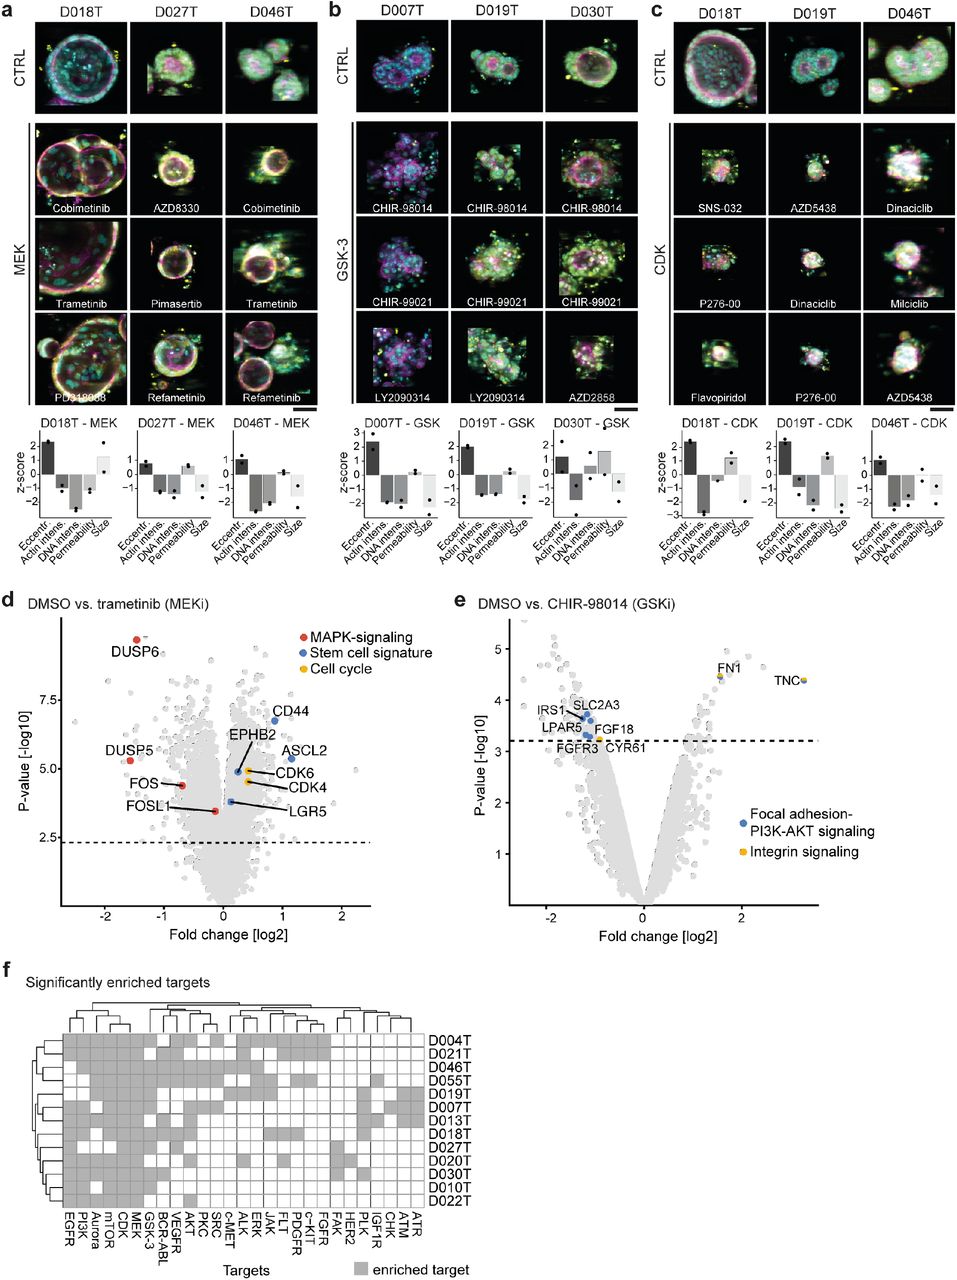
a-c, Representative compound induced phenotypes across different PDO lines. PDOs treated with the negative control (DMSO 0.1%) are shown at the top. Average images were selected for each organoid phenotype, automatically cropped and embedded in black background to visualize phenotype differences on organoid level. Cyan = DNA, magenta = actin, yellow = cell permeability; scale bar: 50μm. Bottom: Quantification of phenotype changes for each line and compound-cluster. Shown is the z-scaled deviation from the negative control of representative features for both biological replicates. a, Representative examples for the MEK1/2 inhibition induced phenotype illustrated by PDO lines D018T, D027T and D046T treated with three different MEK1/2 inhibitors, respectively. b, Representative examples for the GSK3 inhibition induced phenotype illustrated by PDO lines D007T, D019T and D030T, each treated with three different GSK3 inhibitors, respectively. c, Representative examples for the CDK inhibition induced phenotype illustrated PDO lines D018T, D019T and D046T, each treated with three different GSK3 inhibitors, respectively. d, Volcano plot of differentially expressed genes between PDO lines D004T, D007T and D019T treated with DMSO vs. MEK inhibitor trametinib. PDOs were incubated with the drug for 96 hours (analog to the screening setting) before expression profiling was performed. Three biological replicates were made. Red dots indicate MAPK signaling related genes, blue dots indicate stem cell signature genes. Yellow dots indicate genes related to cell cycle. Statistical significance was assessed using a moderated t-test. The horizontal lines indicate 5% false discovery rate. e, Volcano plot of differentially expressed genes between PDO line D019T treated with DMSO vs. GSK3 inhibitor CHIR-98014. PDOs were incubated with the drug for 96 hours (analog to the screening setting) before expression profiling was performed. Two biological replicates were made. Blue dots indicate focal adhesion PI3K-AKT-mTor related genes. Yellow dots indicate genes related to integrin signaling. Statistical significance was assessed using a moderated t-test. The horizontal lines indicate 5% false discovery rate. f, Perturbation induced phenotypes are differentially enriched for individual organoid lines. The SVM approach to identify similar compound induced phenotypes was performed on every profiled PDO line individually (N=13). Clusters of similar induced phenotypes were tested for enrichment of annotated molecular targets using Fisher’s exact test as described for Fig. 5. The odds ratio for significantly enriched targets is shown across all profiled PDO lines.
We have shown above that GSK inhibitors did not cause strong decreases in viability of PDOs in our phenotypic profiling assay. Nevertheless the phenotype caused by GSK-3 inhibition was striking, inducing a disintegration of PDO architecture towards irregular shaped organoids with small, dismembered structures, evocative of grape-like shapes (Figure 6b) In contrast, inhibition of CDKs prove to be related to cell death as shown by LDC. PDOs exhibited markedly reduced organoid size and disappearance of a lumen, sometimes with speckled satellite cells (Figure 6c). Intensity of actin and DNA staining were markedly reduced in this phenotype, while eccentricity and permeability staining were increased. Remarkably, the same death-phenotype was observable among PDO lines of considerably different baseline morphology. The phenotypes induced by inhibition of PI3K/AKT/mTOR signaling and others were less striking. mTORi for instance led to reduced organoid size and a more compact PDO organization (reduced eccentricity, Supplemental Figure S8c).
To elucidate the molecular mechanisms behind morphologic changes induced by compounds in more detail, we performed expression analyses of PDOs treated with MEK inhibitor trametinib and GSK inhibitor CHIR-09014. We selected PDO lines D004T, D007T and D019T that all showed the cystic reorganization phenotype but had different viability responses upon MEK inhibition. After treatment of the PDO lines with trametinib for 72h, we performed microarray analyses. Analyzing the data of all three tested PDO lines together, we observed a strong negative regulation of MAPK related genes and targets, showing effective targeting of MEK. Interestingly, we also observed upregulation of genes related to the cell cycle, alongside with LGR5/EphB2 stem cell signature genes. We had also observed these stem cell signatures to be enriched in large cystic PDOs in unperturbed state. Hence, sublethal inhibition of MEK kinase appeared to induce a paradoxical, stem cell rich phenotype in our colorectal cancer PDO models. Implications on MEK inhibiton in the clinical setting will have to be further studied. For analysis of the GSK inhibitor induced phenotype, we chose PDO line D019T and the compound CHIR-09014 as it strongly exhibited the grape-like phenotype. Next to increases in RNA processing, indicating strong transcriptional activity, we specifically observed a strong regulation of the Focal Adhesion-PI3K-AKT-mTOR-signaling pathway (Wikipathways; q < 0.04), IRS mediated signaling (Reactome; q < 0.04 and integrin cell surface signaling (PID; q < 0.04). These results point to a regulation of the phenotype via GSK, IRS/PI3K pathway and integrin signaling leading to disassembling of organoid structures. Notably, we found no regulation of genes related to apoptosis or cell cycle arrest, substantiating LDC results.
Next, we asked whether compound induced phenotypes were uniformly induced in all PDOs, or whether some were specific to subsets of PDOs. For that, we clustered compounds by phenotypic profiles for every individual profiled PDO line. By calculating the odds ratio of specific mechanisms-of-action to be enriched, we identified differences in number and type of enriched phenotypes (Figure 6f). Some compound classes (including MEK and CDK inhibitors) induced significantly enriched phenotypes in almost all PDO lines, while several others (including AKT inhibitors, PKC inhibitors or GSK3 inhibitors) were specific to subsets of PDO lines. Accordingly, PDO lines D020T or D021T treated with GSK inhibitors only rudimentarily exhibited the typical GSK phenotype observed in other PDO lines (Supplemental Figure S8d). We then wondered if occurrence of specific compound induced phenotypes could be dependent on molecular alterations observed in PDOs. (Supplemental Figure S9a-b). As a measure of compound activity, we again used the AUROC of the SVM to differentiate active compound treatments from inactive treatments. We then proceeded to check for compounds in which activity significantly depended on the mutation status of the treated PDOs. Here we focused on genes mutated at sufficient frequency in our organoid panel (n ≥ 3; PIK3CA, RAS, TP53 and APC). For most compounds we could not detect any genotype-dependent differences in activity, but we found a number of interesting exceptions (Supplemental Figure S9a). Our data suggests, for example, that the mutation status of PIK3CA influences the activity of several compounds targeting the PI3K/AKT pathway, including HER2 (Typhostatin AG 879), AKT (AT7867) or mTOR (WYE-354). Accordingly, images of PDOs treated with AT7867 revealed morphological differences between PIK3CA mutated and PIK3CA wild-type lines (Supplemental Figure 9b).
These analyses demonstrated that three-dimensional, multicellular PDOs showed characteristic and complex morphological responses to defined molecular perturbations. We detected compound specific phenotypes that were reproducible between PDOs from different donors. Furthermore, we explained morphological responses on a molecular level with changes in RNA expression programs of specific pathways. Also, we found phenotypes present only in subsets of PDO lines. Cancer mutations could influence the overall morphologic response of PDOs to targeted compounds even when the treatment might not affect viability of the PDOs.
Discussion
In this manuscript, we describe large-scale microscopy-based drug profiling of three-dimensional, multicellular PDOs. We found a variety of reproducible morphologic PDO phenotypes which can be detected by automated image analysis. Phenotypes clustered by compound mode-of-action and could be linked to molecular processes. Some of the phenotypes were specific to subsets of PDOs, indicating the value of personalized drug discovery with image based organoid profiling. Importantly, morphological compound induced phenotypes included both, lethal and non-lethal responses and therefore are not detectable using current viability profiling methods. Furthermore, complex compound induced phenotypes were influenced by cancer mutations. Finally, we show examples of the possible therapeutic potential of PDO drug profiling in personalized treatment.
The analysis of visual phenotypes upon perturbation of a biological system is a long established strategy in biological studies, for instance to identify genes involved in developmental processes in model organisms. High-throughput phenotypic screening of cells with automated microscopy has more recently become an important tool in cell and molecular biology to systematically cluster perturbations according to changes in cell morphology and thereby dissect molecular mechanisms10–12. For drug discovery, this can be used to decipher the mode-of-action or off-target effects of novel drug candidates12–14,28. Furthermore, using RNAi or genetic perturbations together with high-throughput imaging, gene function, cellular pathways or genes altered in cancer or other conditions have been analyzed11.
PDOs are currently the most complex and advanced in vitro cancer models with high morphological and molecular similarity to their tumors of origin1–3,5. Therefore, they have the potential to supersede current cell line models and -to some extent -animal models for improved drug discovery and personalized treatments29,30. In line with this, previous studies have successfully used PDOs to perform small- and medium-scale drug screenings to analyze differential drug responses measured by cell viability assays3,6,31. However, systematic analyses concerning the nature and extent of morphologic development and the organization of these complex multicellular models upon molecular perturbations were lacking. Importantly, morphologic features of the tissue of origin have repeatedly been shown to be represented by organoids2,3,7–9, yet automated analysis and quantitative description of those phenotypes has not been achieved so far.
With our high-throughput imaging and automated image analysis workflow, we have identified reoccurring compound induced phenotypes in PDOs that go far beyond identification of viable and dead organoids. In a novel approach we systematically used this resource to study molecular perturbations that alter the cellular organization of human multicellular in vitro models. Analysis of complex compound-induced morphologies allowed us to cluster compounds by mode-of-action and consequently to identify off-target effects of known compounds. The multicellular phenotypes of our complex 3D models were reoccurring, but often specific to subsets of PDOs (Figure 5–7). Capturing of non-lethal or sub-lethal phenotypes was important in classifying small molecule mode-of actions (Figure 4). The differences between imaging and metabolic viability assays also underline the added information from image-based profiling.
We were able to identify biological mechanisms underlying the phenotypic response. In particular, we identified a novel (paradox) activation of stemness and cell cycle related genes by MEK inhibition, which was independent of the viability response induced by MEK inhibitors. Further studies may elucidate the exact mechanism behind this, however, it may in part explain the limited success of using MEK inhibitors as monotherapy in colorectal cancer patients32. The grape-like phenotype of disassembled PDOs induced by different GSK inhibitors could be related to integrin regulation by the focal adhesion-PI3K-AKT-mTor signaling pathway.
In the image-based experiments presented here, we have profiled the response of a collection of heterogeneous PDOs to more than 527 defined compounds, a subset of these with varying concentrations. This resulted in a dataset of more than 3,700,000 images. Evidently, processing and analysis of PDO profiling data is a major challenge that will persist as future experiments will increase in size and 3D resolution. To facilitate the use of PDOs for high-throughput image-based profiling, we established the SCOPE framework for automated PDO image analysis. Both, our dataset and the described experimental and analysis toolkit can be regarded as a resource for future image based profiling studies with organoids. To capture organoids in 3D, we chose a fragmented 3D-imaging approach. Thereby, we gathered several confocal layers with considerable offsets per field and projected them onto a 2D plane. While recent imaging methods like light-sheet microscopy may be superior for a more detailed analysis of PDO organization, modifications to this method for screening multiple PDO lines against large drug libraries are still pending. In addition to hardware related limitations with respect to microscopy and computational power, the descriptive features currently used in biological image analysis are optimized for single cells and may not be ideal to capture PDO characteristics. As an outlook, future image based PDO profiling may benefit from improved microscopy solutions and increased computational power allowing rapid single cell resolution imaging and novel feature extraction methods based on machine learning algorithms33.
Apart from quantitative morphological analysis, we show potential clinical relevance of phenotypic drug profiling of PDOs. We identified known molecular markers for drug response like RAS status for EGFR inhibition or TP53 mutation status for nutlin3a response, illustrating the utility of our approach for biomarker discovery. We also identified associations between non-lethal phenotypes and cancer mutations with our multiparametric analysis. This was observed for example in the AKT inhibitor AT7867, which led to a morphological response in PIK3CA mutated but not in wild-type PDO lines (Supplemental Figure S9). Associations like these might be important information in drug discovery not gathered by viability profiling. Further studies are needed to characterize such associations, their mechanisms and clinical impacts in detail.
Our work opens new directions of research for PDO profiling. Given that PDO models can be established from a wide range of tumors and normal tissue with high efficiency1,7,16, our morphological profiling workflow has the potential to be used for analysis of drug action (or other perturbations) in many different patient derived models. Our work paves the way for imaging PDOs with higher spatial- and time resolution in the future. This may reveal mechanisms of organoid growth and perturbation response on a single cell level within multicellular organoids. Additionally, further development of imaging protocols will allow the analysis of mixed cultures in high-throughput imaging assays, for example to profile PDO and immune cell interactions30,34.
In conclusion, we have built a resource for high-throughput fluorescence microscopy of PDO models. We used our pipeline for large-scale compound profiling experiments that showed heterogeneous morphology of PDOs and diverse drug-induced morphologic phenotypes linked to molecular targets. Thereby, we showed systematically for the first time how molecular perturbations alter the cellular organization of human multicellular in vitro models. Morphological compound induced phenotypes could be both lethal-or non-lethal, providing complementary information to viability profiling methods. Our framework and dataset are thus resources that allow individual drug discovery with three-dimensional multicellular ex vivo models and open new avenues for drug discovery and personalized medicine.
Materials and Methods
Patients
All patients were recruited at University Hospital Mannheim, Heidelberg University, Mannheim, Germany. We included untreated patients with a new diagnosis of colon or rectal cancer in this study and obtained biopsies from their primary tumors and adjacent normal tissue via endoscopy. Exclusion criteria were active HIV, HBV or HCV infections. Biopsies were transported in phosphate buffered saline (PBS) on ice for subsequent organoid extraction. Clinical data, tumor characteristics and molecular tumor data were pseudonymized and systematically collected in a prospective database. The study was approved by the Medical Ethics Committee II of the Medical Faculty Mannheim, Heidelberg University (Reference no. 2014-633N-MA and 2016-607N-MA). All patients gave written informed consent before tumor biopsy was performed. In total, we extracted PDOs from 19 patients with colorectal cancer, 5 of them female, 14 male, with a mean age of 68 years (median 68). 12 patients had a primary rectum carcinoma, 7 a primary colon carcinoma. Detailed patient characteristics, including stage and treatment data can be found in Supplemental Table S1.
Organoid culture
Organoid cultures were extracted from tumor biopsies as reported by Sato et al.1 with slight modifications. Tissue fragments were washed in DPBS (Life technologies) and digested with Liberase TH (Roche) before embedding into Matrigel (Corning) or BME R1 (Trevigen). Advanced DMEM/F12 (Life technologies) medium with Pen/Strep, Glutamax and HEPES (basal medium) was supplemented with Noggin (Peprotech), B27 (Life technologies), 1,25 mM n-Acetyl Cysteine (Sigma), 10 mM Nicotinamide (Sigma), 50 ng/ml human EGF (Peprotech), 10 nM Gastrin (Peprotech), 500 nM A83-01 (Biocat), 10 nM Prostaglandin E2 (Santa Cruz Biotechnology), 10 μM Y-27632 (Selleck chemicals) and 100 mg/ml Primocin (Invivogen). Initially, cells were kept in 4 conditions including medium as described (ENA), or supplemented with additional 3 uM SB202190 (Biomol) (ENAS), 50% Wnt-conditioned medium and 20% R-Spondin conditioned medium (WENRA) or both (WENRAS), as described by Fujii et al.2. The tumor niche was determined after 7-14 days and cells were subsequently cultured in the condition with best visible growth. PDOs were passaged every 7-10 days and medium was changed every 2-3 days. 19 PDO lines were established, data of all PDO lines including niche and growth rate are denoted in Supplemental Table S1. For molecular characterization and high-throughput profiling we selected PDOs based on growth rate for sufficient availability of material, as well as those from diverse clinical stages.
Amplicon sequencing
DNA was isolated from 19 organoid cultures with the DNA blood and tissue kit (Qiagen). Sequencing libraries were prepared with a custom panel (Tru-Seq custom library kit, Illumina) according to the manufacturers protocol and sequenced on a MiSeq (Illumina). Targeted regions included the most commonly mutated hot spots in colorectal cancer in 46 genes captured with 157 amplicons of approximately 250bp length. A list of targeted hot-spots that were sequenced can be found in Supplemental Table S5. After mapping of the reads to GRC38 reference genome using Burrows-Wheeler Aligner (BWA), data were analyzed using the Genome Analysis Toolkit (GATK)35,36. Base recalibration was performed and variants were called using MuTect2 pipeline. Variants with a variant frequency below 10%, with less than 10 reads, or with a high strand bias (FS<60) were filtered out. Variants were annotated with Ensemble variant effect predictor37 and manually checked and curated using integrative genomics viewer, if necessary38. Only non-synonymous variants present in COSMIC39 were considered true somatic cancer mutations. Also, all variants annotated “benign” according to PolyPhen database and “tolerated” in SIFT database were excluded, as well as variants with a high frequency in the general population as determined by a GnomAD40 frequency of >0.001.
Expression profiling
Organoid RNA was isolated from 19 PDO lines with the RNeasy mini kit after snap freezing organoids on dry ice. Samples were hybridized on Affymetrix U133 plus 2.0 arrays. Raw microarray data were normalized using the robust multi-array average (RMA) method41 followed by quantile normalization as implemented in the ‘affy’42 R/Bioconductor43 package. In order to exclude the presence of batch effects in the data, principal component analysis and hierarchical clustering were applied. Consensus molecular subtypes were determined as described previously18 using the single sample CMS classification algorithm with default parameters as implemented in the R package ‘CMSclassifier’. In all cases, differential gene expression analyses were performed using a moderated t-test as implemented in the R/Bioconductor package ‘limma’44. Gene set enrichment analyses were performed using ConsensusPathDB45 for discrete gene sets or GSEA as implemented in the ‘fgsea’46,47 R/Bioconductor package for ranked gene lists.
Compound profiling
Cell seeding
PDO drug profiling followed a standardized protocol with comprehensive documentation of all procedures. Organoids were collected and digested in TrypLE Express (Life technologies). Fragments were collected in basal medium with 300 U/ml DNAse and strained through a 40μm filter to achieve a homogeneous cell suspension with single cells and small clusters of cells, but without large organoid fragments. 384 well μclear assay plates (Greiner) were coated with 10μL BME V2 (Trevigen) at a concentration of 6.3 mg/ml in basal medium, centrifuged and incubated for >20 min at 37° C to allow solidification of the gel. PDO cell clusters together with culture medium (ENA) and 0,8 mg/ml BME V2 were added in a volume of 50μl per well using a Multidrop dispenser (Thermo Fisher Scientific). Plates were sealed with a plate-loc (Agilent) and centrifuged for additional 20 min allowing cells to settle on the pre-dispensed gel. Cell number was normalized before seeding by measuring ATP levels in a 1:2 dilution series of digested organoids with CellTiter-Glo (Promega). The number of cells matching 10,000 photons was seeded in each well. After seeding of organoid fragments, plates were incubated for three days at 37°C to allow organoid formation before addition of compounds. Two biological replicates of each PDO line were profiled. Mean passage number of the PDO lines by the time of profiling of the first replicate was 9 (median 9) and PDOs were passaged one or two more times before the second replicate. In total, 16 PDO lines underwent profiling with the clinical cancer library (15 of those with both, CTG and high-throughput imaging read outs), while the KiStem library was used with 13 PDO lines (with high-throughput imaging).
Compound libraries
Two compound libraries were used for screening: A library containing 63 clinically relevant drugs (clinical cancer library) and a large library of 464 compounds targeting kinases and stem cell or developmental pathways associated genes (KiStem library). The clinical cancer library was manually curated by relevance for current (colorectal) cancer therapy, mechanism of action and potential clinical applicability. Compounds of this library are in clinical use or at least in phase I/II clinical trials. Five concentrations per compound were screened (five-fold dilutions). The concentrations were determined by analysis of literature data from previous 3D and 2D drug screens and own experiments. A list of compounds included in this library and maximum concentrations used can be found in S3. The KiStem library includes 464 compounds targeting a diverse set of kinases and stem cell relevant pathways S4. All compounds in this library were used in a concentration of 7.5μM. All compounds were obtained from Selleck chemicals. Compounds of both libraries were arranged in an optimized random layout. We stored compound libraries in DMSO at −80 C.
Compound treatment
Medium was aspirated from all screening plates and replaced with fresh ENA medium devoid of Y-27632, resulting in 45μl volume per well. Drug libraries were diluted in basal medium and subsequently 5μl of each compound was distributed to screening plates. All liquid handling steps were performed using a Biomek FX robotic system (Beckmann Coulter). Plates were sealed and incubated with the compounds for four days.
Luminescence viability read out
Plates undergoing viability screening were treated with 30μl CellTiter-Glo reagent after medium aspiration with a Biomek FX. After incubation for 30 minutes, luminescence levels were measured with a Mithras reader (Berthold technologies).
Image-based phenotyping
Image-IT DeadGreen (Thermo Fisher) was added to the cultures with a Multidrop dispenser (Thermo Fisher) in 100nM final concentration and incubated for four hours. Afterwards, medium was removed and organoid cultures were fixed with 3% PFA in PBS with 1% BSA. Fixed plates were stored at 4° C for up to three days before permeabilization and staining. On the day of imaging, organoids were permeabilized with 0.3% Triton-X-100 and 0.05% Tween in PBS with 1% BSA and stained with 0.1μg/ml TRITC-Phalloidin (Sigma) and 2μg/ml DAPI (Sigma). All liquid handling steps were performed with a BiomekFX. Screening plates were imaged with an Incell Analyzer 6000 (GE Healthcare) line-scanning confocal fluorescent microscope. We acquired 4 fields per well with z-stacks of 16 slices at 10x magnification. The z-steps between the 16 slices had a distance of 5μm, the depth of field of each slice was 3.9μm.
Immunohistochemistry
PDOs were fixed for 20 min in 4% (v/v) Roti Histofix (Carl Roth) followed by embedding into MicroTissues 3D Petri Dish micromolds (Sigma Aldrich) using 2 % (w/v) Agarose LE (Sigma) in PBS supplemented with 0.5 mM DTT. Thereafter, PDOs were subjected to dehydration steps and embedding in paraffin. Formalin-Fixed Agarose/Paraffin-Embedded sections (3-5μm) were manually cut from blocks with a microtome (Leica RM 2145) and transferred to glass slides (Superfrost, Thermofisher Scientific) before H&E staining using automated staining devices.
Proliferation assay
Organoids were collected, digested, strained, normalized and seeded as in the drug profiling protocol described above. Medium change was performed on days 2 and 4. Viability of plated organoids was measured 2, 4 and 8 days after seeding using CellTiter-Glo as described above.
Image analysis
Image processing
Microscopic image z-stacks were compressed to HDF5 format for archival and underwent maximum contrast projection using the R/Bioconductor package MaxContrastProjection for further processing of the images. Segmentation of the projections based on intensity did not sufficiently identify organoids. Instead, we trained a deep convolutional neural network (DCNN) on the partially correct intensity segmentation, leveraging the robustness of DCNNs with regards to mislabeled training data and eliminating the need for expensive manual annotations. Standard image features, including shape, moment, intensity, and Haralick texture features48 on multiple scales, were extracted using the R/Bioconductor package EBImage49. Initially, we extracted a total of 1572 features for each individual organoid image. However, texture features are meaningless for scales larger than the actual organoid size. To simplify analysis, we only retained texture features for further analysis that were well defined for all organoids, i.e. on a scale smaller than the smallest organoids in the image dataset. This ensured that the dataset contained no NA-values that would complicate the analysis or require imputation. A feature is considered “well-defined’ if the median absolute deviation across the entire dataset is strictly greater than 0. In other words, if more than half of all organoids exhibit an identical value for a feature then that feature is discarded for further analysis. This resulted in 973 well-defined features. We did not perform feature selection based on between-replicate correlation of well-averaged features as we used single-organoid features for further analysis and because the downstream methods used (SVM, Random-Forrest) do not require pre-selection of features.
Out-of-focus objects were programmatically removed from the dataset using a feature based random forest classifier. Data from one PDO line (D015T) screened with the clinical cancer library had to be excluded from image analysis due to too many out of focus objects.
Drug-induced phenotypes
A principal component analysis (PCA) was performed on the entire dataset to reduce the dimensionality. 25 principal components were selected, explaining approx. 81% of the total variance within the dataset. A linear support vector machine (SVM) was trained per line and treatment (and per concentration where applicable) to differentiate treated organoids from negative controls based on the PCA-transformed features50. To allow comparison between various PDO lines and drug perturbations, the distributions of features describing organoids from different batches were adjusted. Drugs were categorized as either active or inactive based on the accuracy of the SVM. The histogram of accuracies made a threshold of 85% the most intuitive. The direction of the vector perpendicular to the SVM hyperplane was interpreted as the drug-induced effect. Drugs were clustered with regard to the angles of their corresponding effect vectors in PCA-feature space.
Live-dead classification
A random forest classifier was trained on the original single organoid features to differentiate living from dead organoids. Organoids treated with DMSO were used as negative (i.e. living) controls while organoids treated with Bortezomib and SN-38 at the two highest concentrations were used as positive (i.e. dead) controls. Visual inspection of the projected images confirmed our choice of positive controls. Binary classification results were averaged within wells to obtain viability scores ranging from 0 to 1, indicating how lethal a treatment was. A separate classifier was trained for each individual line to ensure inter-line independence.
Analysis of luminescence data and dose-response relationships
Raw luminescence data of each plate were first normalized using the Loess-fit method 51 in order to correct for edge effects where increased luminescence intensity was observed along the edges of each plate. Subsequently, each plate was normalized by division with the median luminescence intensity of the DMSO controls. Drug response Hill curves (DRC) were fitted and area under the curve values were calculated for each DRC using the ‘PharmacoGx’52 R/Bioconductor package.
Proliferation assay
The viability data gathered from day 2 and 4 was used to estimate organoid doubling times. Measurements from day 8 were excluded from further analysis because not all cell lines were in a log-phase of organoid growth at this time point. Organoid doubling time (Td) was calculated using the established formula below relying on time (t) and median photon count (pc) data:

Software and data availability
Software within the SCOPE framework for organoid image analysis (including segmentation, feature extraction, analysis of drug-induced phenotypes, live-dead-classification), as well as the pipelines for analysis of luminescence data, dose response relationships and expression data are available under https://github.com/boutroslab/Supplemental-Material/tree/master/Betge&Rindtorff&Sauer&Rauscher_2018. Organoid feature data are included within a package that bundles these scripts with all required source data in the figshare repository (https://figshare.com/s/e465d65a9964d3b999e9). Microarray data are made available in Gene Expression Omnibus (GEO, https://www.ncbi.nlm.nih.gov/geo/) under accession no. GSE117548. Amplicon sequencing data are made available through controlled access in the European Genome Phenome Archive (EGA, https://www.ebi.ac.uk/ega/home, accession no. EGAD00001004313). Data access requests for sequence data will be evaluated and transferred upon completion of a data transfer agreement and authorization by the data access committee of Division Signaling and Functional Genomics, DKFZ and Department of Medicine II, Medical Faculty Mannheim.
Author contributions
Conceptualization, J.B., N.R., J.S., M.E. and M.B; Methodology, J.B., N.R., H.G., T.M., and F.H.; Formal Analysis, J.S., B.R. N.R. and E.V.; Software, J.S. and B.F.; Investigation, J.B., N.R., C.D., H.G., F.H., V.H., T.Gu., L.F., S.B., T.Ga., I.B., R.J, N.H. and T.Z.; Writing – Original Draft, J.B. and N.R.; Writing – Review & Editing, J.B., N.R., J.S., B.R., M.E. and M.B.; Data curation, J.B., N.R., J.S. and B.R.; Visualization, J.B., N.R., J.S. and B.R.; Funding Acquisition, M.E. and M.B.; Resources, M.E. and M.B.; Supervision, K.B-H., E.B., M.E. and M.B.
Declaration of interests
The authors declare no competing interests. The group of M.B. received industry-academic research funding from GlaxoSmithKline for an unrelated project.
Acknowledgements
We thank all patients participating in this study as well as the teams approaching patients for consent. We thank K. Kaiser, A. Falzone and K. Srour for excellent technical assistance, C. Scheeder and F. Heigwer for helpful discussions on the manuscript and C. Cai for help with immunohistochemical stainings. We are grateful to H, Farin for helpful discussions. We also thank J. Hodzic, M. Hirth, G. Kähler, M. Sold and the Central Endoscopy Unit (ZIE) of the University Hospital Mannheim for inclusion of patients and asservation of biopsies. We thank the microarray unit of the DKFZ Genomics and Proteomics Core Facility and the Center for Medical Research (ZMF) Mannheim for assistance with Microarrays and H/E stainings, respectively. We thank the Institute of Clinical Radiology and Nuclear Medicine Mannheim for providing CT and MRI images. This work was supported by the Hector Stiftung II, Weinheim, Germany. J.B. was supported by the “Translational Physician Scientist (TraPS)” program of the Medical Faculty Mannheim, Heidelberg University and the State of Baden-Württemberg and by the Dr. Hans und Lore Graf Stiftung, Germany. B.R. was supported by the BMBF-funded Heidelberg Center for Human Bioinformatics (HD-HuB) within the German Network for Bioinformatics Infrastructure (de.NBI). M.P.E was supported by grants from the State of Baden-Württemberg for the “Center of Geriatric Oncology (ZOBEL) – Perspektivförderung” and “Biology of Frailty – Sonderlinie Medizin”. Research in the lab of MB was supported by an ERC Advanced Grant.


