

Abstract
Motivation Cancer subtype classification has the potential to significantly improve disease prognosis and develop individualized patient management. Existing methods are limited by their ability to handle extremely high-dimensional data and by the influence of misleading, irrelevant factors, resulting in ambiguous and overlapping subtypes.
Results To address the above issues, we proposed a novel approach to disentangling and eliminating irrelevant factors by leveraging the power of deep learning. Specifically, we designed a deep-learning framework, referred to as DeepType, that performs joint supervised classification, unsupervised clustering and dimensionality reduction to learn cancer-relevant data representation with cluster structure. We applied DeepType to the METABRIC breast cancer dataset and compared its performance to alternative state-of-the-art methods. Deep-Type significantly outperformed the existing methods, identifying more robust subtypes while using fewer genes. The new approach provides a framework for the derivation of more accurate and robust molecular cancer subtypes by using increasingly complex, multi-source data.
Availability and implementation An open-source software package for the proposed method is freely available at www.acsu.buffalo.edu/~yijunsun/lab/DeepType.html.
1 Introduction
Human cancer is a heterogeneous disease initiated by random somatic mutations and driven by multiple genomic alterations (Hanahan and Weinberg, 2011; Sun et al., 2017). In order to move towards personalized patient treatment regimes, cancers of specific tissues have been divided into molecular subtypes based on the gene expression profiles of primary tumors (Sørlie et al., 2001, 2003; Curtis et al., 2012; Parker et al., 2009). The premise is that patients who share molecular subtypes are likely to have similar disease etiology, response to therapy, and clinical outcomes. Thus, the analysis of molecular subtyping can reveal information valuable for a range of cancer studies from etiology and tumor biology to prognosis and personalized medicine.
Most early work on molecular subtyping for oncology has been performed on data obtained from breast cancer tissues (Sørlie et al., 2001, 2003). Typically, breast cancer is not lethal immediately and thus, there is an opportunity to assist with prognostication and patient management using molecular information. Molecular subtyping of breast cancer initially focused on mRNA data obtained from microarray platforms and parsed molecular profiles to stratify patients according to clinical outcomes (Sørlie et al., 2001). Refinement of the subtype categories through validation in independent datasets identified five broad subtypes, including normal-like, luminal A, luminal B, basal, and HER2+, each with distinct clinical outcomes (Sørlie et al., 2003; Parker et al., 2009). These early studies altered our understanding of breast cancer and offered a foundation for the development of therapies tailored to specific subtypes. However, possibly due to the small number of tumor samples used in initial analyses and the technical limitations of the methods used for gene selection and clustering analysis, several large-scale benchmark studies have demonstrated that the current stratification of breast cancer is only approximate, and that the high degree of ambiguity in existing classification systems can induce uncertainty in the classification of new samples (Weigelt et al., 2010; Mackay et al., 2011).
The desire for levels of accuracy that can ultimately lead to clinical utility continues to drive the field to refine breast cancer subtypes (Shen et al., 2013; Parker et al., 2009; Sun et al., 2017; Haibe-Kains et al., 2012; Sun et al., 2014) and to identify molecular subtypes in other cancers (Abeshouse et al., 2015; Cancer Genome Atlas Network, 2014). The recent establishment of international cancer genome consortia (Cancer Genome Atlas Network, 2012; Abeshouse et al., 2015; Cancer Genome Atlas Network, 2014; Curtis et al., 2012) has generally overcome the sample size issue. In this paper, we focus mainly on developing methods to address the computational challenges associated with detecting cancer related genes and biologically meaningful subtypes using high-dimensional genomics data. Molecular subtyping can be formulated as a supervised-learning problem, that is, to use established tumor subtypes as class labels to perform feature selection and construct a model for the classification of new patients. The strategy, though computationally simple, may not enable us to identify novel subtypes. Consequently, most existing methods were developed within the unsupervised learning framework. Representative work includes SparseK (Witten and Tibshirani, 2010), iCluster (Shen et al., 2009, 2013) and non-negative matrix factorization (Kormaksson et al., 2012). The basic idea is to perform gene selection and clustering analysis simultaneously to detect compact tumor groups by optimizing a certain cost function. A major issue with the existing methods is that there is no guarantee that subtypes identified through de novo clustering analysis are biologically relevant. Presumably, genomics data records all ongoing biological processes in a cell or tissue, where multiple factors interact with each other in a complex and entangled manner. Tumor samples can be grouped based on factors that are not related to the actual disease (e.g., race and eye color). Another major limitation is that for computational considerations most existing methods perform data dimensionality reduction through linear transformation (e.g., feature weighting used in SparseK (Witten and Tibshirani, 2010)). Thus, they cannot adequately deal with complex non-linear data and extract pertinent information to detect subtypes residing in non-linear manifolds in a high-dimensional space. Note that the molecular subtyping analysis was initially performed on mRNA data (Sørlie et al., 2001, 2003). Conceivably, the integration of the information from multi-source genomics data could refine established cancer subtypes. However, some existing methods do not scale well to handle high-dimensional data. For example, iCluster (Shen et al., 2009, 2013) involves matrix inversion and thus can only process a few thousands of genes. A commonly used practice is to perform preprocessing and retain only the most variant genes (Curtis et al., 2012). However, there is no guarantee that low-variant genes contain no information and the cut-offs used to select variant genes were usually set somehow arbitrarily.
In this paper, we propose a novel deep-learning based method, referred to as DeepType, that addresses all the aforementioned technical limitations. Due to the ability to learn good representation in problem solving, deep learning has recently achieved state-of-the-art performance in computer vision (LeCun et al., 2015), pattern recognition (Parkhi et al., 2015) and bioinformatics (Zheng et al., in press). For our purpose, by leveraging the power of a multi-layer neural network for representation learning, we map raw genomics data into a space where clusters can be easily detected. To ensure the biological relevance of detected clusters, we incorporate prior biological knowledge to guide representation learning. We train the neural network by minimizing a unified objective function consisting of a classification loss, a clustering loss and a sparsity penalty. The training process can be easily performed by using a mini-batch gradient descent method. Thus, our method can handle large datasets with extremely high dimensionality. Although the idea of using deep learning for clustering is not new (see, e.g., Xie et al. (2016)), to the best of our knowledge, this work represents the first attempt to use deep learning to perform joint supervised and unsupervised learning for cancer subtype classification. A large-scale experiment was performed that demonstrated that DeepType significantly outperformed the existing approaches. The new approach provides a framework for the derivation of more accurate and robust molecular cancer subtypes by using increasingly complex, multi-source data.
2 Methods
In this section, we give a detailed description of the proposed method for cancer subtype identification. We also propose novel procedures for optimizing the associated objective function and estimating the hyper-parameters.
2.1 Deep Learning for Cancer Subtype Identification
Let X = [x1, …, xN] be a cohort of tumor samples and Y = [y1, …, yN] be a rough stratification of the samples (e.g., subtyping results from previous studies), where xn ∈ ℝD is the n-th sample and yn ∈ ℝJ is the corresponding class label vector with yjn = 1 if xn belongs to the j-th group and 0 otherwise. Our goal is to identify a small set of cancer related genes and perform clustering analysis on the detected genes to refine existing classification systems and detect novel subtypes. To this end, we utilize the representation power of a multi-layer neural network to project raw data onto a representation space where clusters can be easily detected. As discussed above, clusters identified through unsupervised learning may not be biologically relevant. To address the issue, we impose an additional constraint that the detected clusters are concordance with previous results. Specifically, we cast it as a supervised-learning problem, that is, to find a representation space where the class labels can be accurately predicted.
Figure 1 depicts the network structure of the proposed method. It consists of an input layer, M hidden layers, a classification layer and a clustering module. The M-th hidden layer is designated as the representation layer, the output of which is fed into the classification layer and the clustering module. Mathematically, the neural network can be described as follows:
 where Wm, bm, and om are the weight matrix, bias term and output of the m-th layer, respectively, and
  is the output of the classification layer. For the purpose of this study, we use the rectified linear unit (ReLU) (Nair and Hinton, 2010) and softmax as the activation functions for the hidden and classification layers, respectively. For notational convenience, let
  and denote
  as the mapping function that projects raw data onto a representation space, where DM is the number of the nodes in the representation layer and DM << D.

Overview of the proposed deep-learning based method for cancer molecular subtyping. It consists of three major components: representation learning, biological knowledge integration, and subtyping. The first part maps raw genomics data onto a representation space, the second part introduces prior biological knowledge to guide representation learning, and the third part generates subtyping results. The network parameters are learned by minimizing a unified objective function consisting of a classification loss, a clustering loss and a sparsity penalty.
We optimize network parameters Θ through joint supervised and unsupervised learning by minimizing an objective function that consists of a classification loss, a clustering loss and a regularization term. The classification loss measures the discrepancy between the predicted and given class labels. By construction, the j-th element of  can be interpreted as the probability of xn belonging to the j-th group. Thus, we use the cross entropy to quantify the classification loss:

We use the K-means method (Lloyd, 1982) to detect clusters in the representation space. The clustering loss optimized by K-means is given by
 subject to
  , where K is the number of clusters, C is a center matrix with each column representing a cluster center, and sn is a binary vector where skn = 1 if xn is assigned to cluster k and 0 otherwise.
Finally, we impose an 𝓁2,1-norm regularization (Nie et al., 2010) on the weight matrix of the first layer to control the model complexity and to select cancer related genes:
 where W1ij is the ij-th element of W1 and D2 is the number of the nodes in the second layer. The 𝓁2,1-norm regularization has an effect of automatically determining the number of nodes activated in the input layer, and thus the number of genes used in subtyping analysis.
Combining the above three losses, we obtain the following novel formulation for cancer subtype identification:
 where S = [s1, …, sN] and λ is a regularization parameter that controls the sparseness of a solution. The above formulation can be interpreted as finding a representation space to minimize the clustering loss while maintaining the classification loss smaller than a user defined upper bound ζ. For ease of optimization, we move the classification-loss constraint to the objective function and write the problem in the following equivalent form:
 where α is a tradeoff parameter that controls the balance between the classification and clustering performance. In the following sections, we describe how to solve the above optimization problem and estimate the hyper-parameters.
2.2 Optimization
The above optimization problem contains three sets of variables, namely, network parameters Θ, assignment matrix S, and cluster centers C. It is difficult to solve the problem directly since the parameters are coupled and S is a binary matrix. To address the issue, we partition the variables into two groups, i.e., Θ and (S, C), and employ an alternating optimization strategy to solve the problem. Specifically, we first perform pre-training to initialize the network by ignoring the clustering module (i.e., setting α = 0). Then, we fix Θ and transform the problem into
 which can be readily solved by using the standard K-means method (Lloyd, 1982). Then, we fix (S, C) and write the problem as
 which can be optimized through back-propagation by using the mini-batch based stochastic gradient descent method (Kingma and Ba, 2014). The above procedures iterate until convergence.

2.3 Parameter Estimation
We describe how to estimate the three hyper-parameters of the proposed method, namely regularization parameter λ, tradeoff parameter α, and number of clusters K. In order to avoid a computationally expensive three-dimensional grid search, we first ignore the clustering module by setting α = 0 and perform supervised learning to estimate λ. The rationale is that previous subtyping results could provide us with sufficient information to determine the value of λ. Specifically, we randomly partition training data into ten equally-sized sub-datasets, perform ten-fold cross-validation and estimate λ by using the one-standard-error rule (Hastie et al., 2009). Once we determine the value of λ, we perform K-means analysis on the outputs of the representation layer and pre-estimate the number of clusters, denoted as  , as the one that maximizes the average silhouette width (Wiwie et al., 2015). Since the data representation is obtained through supervised learning, which tends to group samples with the same labels together,
  is likely to be the lower bound of the true value. Let
  . For each Ki, we train a deep-learning model by using different α values and record the corresponding ten-fold cross-validation classification errors. By design, α controls the tradeoff between the classification and clustering performance, and the classification error increases with the increase of α. Again, by using the one-standard-error rule, for each Ki, we find the largest α, denoted as αi, that results in a classification error that is within one standard deviation of the one obtained by setting α = 0 (i.e., we require that the obtained classifier does not perform significantly worse than the existing subtyping system), and record the corresponding average silhouette width si. Once we run over all possible Ki, we obtain T + 1 triplets
  . Finally, we determine the number of clusters K and the tradeoff parameter α as the pair that yields the largest average silhouette width. The pseudo-code of parameter estimation is given in Algorithm 1, and the proposed procedure performed quite well in our numerical experiment (See Figure 2).

Hyper-parameter estimation. (a) The regularization parameter λ was estimated to be 0.006 based on the one-standard-error rule. (b) The number of clusters was pre-estimated to be 9 based on the average silhouette width. (c) We searched a range of values to estimate the number of clusters. For each K ≥ 9, we trained a deep-learning model by using different α values and estimated the optimal α by using the one-standard-error rule. The figure presents an example showing that the optimal α was estimated to be 1.2 for K = 11. (d) The number of clusters was finally determined to be 11 by maximizing the average silhouette width. See Section 2.3 for a detailed description of hyper-parameter estimation.
3 Experiments
We conducted a large-scale experiment that demonstrated the effectiveness of the proposed method.
3.1 Experiment Setting
The experiment was performed on the data from the METABRIC project (Curtis et al., 2012), which contains the expression profiles of 25,160 genes from 1,989 surgically excised primary breast tumor samples and 144 normal breast tissue samples. It is probably the largest single breast cancer dataset assayed to date. For computational convenience, we retained only the top 20,000 most variant genes for the downstream analysis. For model construction and performance evaluation, we randomly partitioned the data into a training and test datasets, each containing 80% and 20% of the samples, respectively. In this study, we used the PAM50 subtypes (Parker et al., 2009) as class labels in the training process. We designed a four-layer neural network model for the joint supervised and unsupervised learning. The numbers of the nodes in the input layer, the two hidden layers and the output layer were set to 20,000, 1,024, 512, and 6, respectively. We employed the Adam method (Kingma and Ba, 2014) to tune the parameters of the model. The learning rate was set to 1e-3, the numbers of training epochs for model initialization and the joint supervised and unsupervised training were set to 300 and 1,500, respectively, and the batch size was set to 256. By using the method proposed in Section 2.3, the number of clusters K, the tradeoff parameter α and the regularization parameter λ were estimated to be 11, 1.2 and 0.006, respectively (Figure 2).
3.2 Clinically Relevant Subtypes Revealed by DeepType
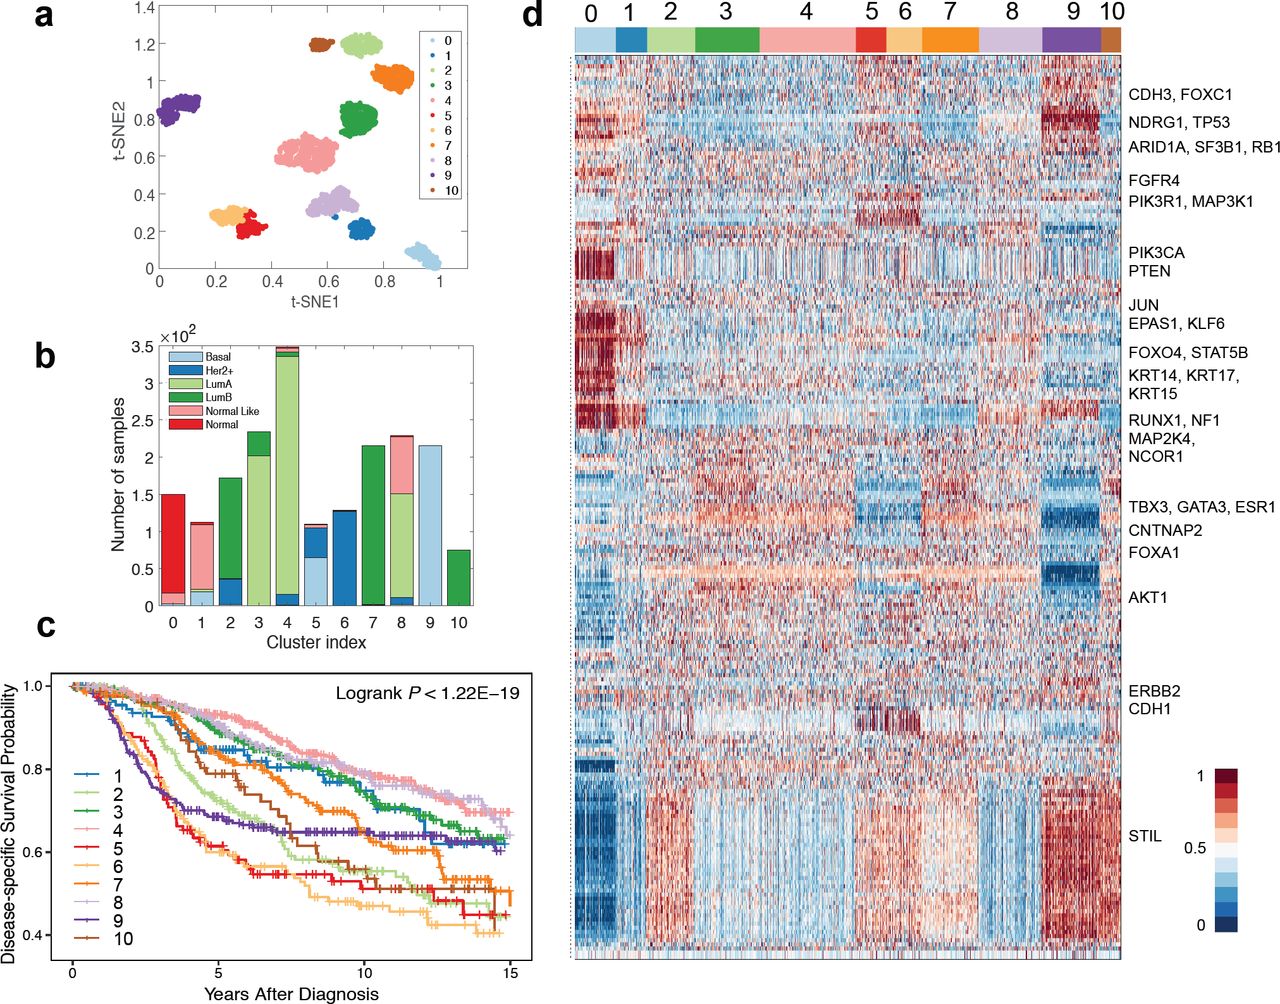
By applying the proposed DeepType method to the breast cancer dataset, a total of 218 genes were selected and 11 clusters were detected. To visualize the identified clusters, we applied t-SNE (van der Maaten and Hinton, 2008) to the outputs of the representation layer. Figure 3 (a-b) present the sample distributions of the identified clusters and their PAM50 compositions, respectively. We can see that nearly all of the normal tissue samples were grouped into a single cluster (i.e., Cluster 0), and the tumor samples were grouped into ten well-separated clusters, labelled as DeepType 1-10. To demonstrate the clinical relevance of the identified tumor subtypes, a disease-specific survival data analysis was performed. Figure 3(c) shows that the ten subtypes are associated with distinct prognostic outcomes (logrank test, p-value < 1.22e-19). Further internal and external validation analysis of the detected clusters is presented in Section 3.3.

DeepType identified ten clinically relevant breast cancer subtypes. (a) The sample distributions of the identified clusters visualized by t-SNE. Nearly all of the normal tissue samples were grouped into a single cluster (i.e., Cluster 0), and the tumor samples were grouped into ten well-separated clusters, labelled as DeepType 1-10. (b) The PAM50 composition of the identified clusters. (c) The ten identified subtypes were associated with distinct clinical outcomes. (d) The heatmap of the 218 selected genes showed that the identified clusters exhibited distinct transcriptional characteristics on several gene modules. The samples were arranged by the clustering assignments, and the expression levels were linearly scaled into [0, 1] across samples.
Figure 3(d) presents the heatmap of the 218 selected genes, and the descriptions of the genes are given in Supplementary Table S1. The discovered subtypes contain distinct transcriptional characteristics associated with several gene co-expression modules and key cancer genes. Most normal-like samples were grouped into DeepType 1, and have an expression pattern similar to the normal samples. The luminal A samples were separated as DeepTypes 3, 4 and 8 with low expression on the STIL module (key gene: STIL) and intermediate expression on the GATA3 module (key genes: TBX3, GATA3, ESR1, CNTNAP2 and FOXA1). Among the three subtypes, the expression of the KRT family (key genes: KRT14, KRT15 and KRT17) were highest in DeepType 8, intermediate in DeepType 4 and lowest in DeepType 3. The luminal B samples were grouped into DeepTypes 2, 7 and 10, with intermediate to high expression of the GATA3 and STIL gene modules, and low expression of CDH3 and FOXC1. Among the three subtypes, the expression of the genes in the STIL module were highest in DeepType 10, intermediate in DeepType 2 and lowest in DeepType 7. DeepTypes 5 and 6, which were dominated by HER2+ and mixed HER2+/basal samples, respectively, had very high expression on ERBB2 and CDH1 and low expression on TBX3, GATA3 and ESR1 genes. DeepType 9, composed entirely of basal samples, had low expression in the GATA3 module and high expression in the STIL and KRT modules.
DeepType identified 218 genes to be informative for breast cancer subtyping
Clinical and prognostic characteristics of breast cancer
3.3 Comparison Study
To further demonstrate the effectiveness of the proposed method, we compared it with two state-of-the-art methods, namely SparseK (Witten and Tibshirani, 2010) and iCluster (Shen et al., 2009). Both methods perform feature selection and clustering analysis simultaneously, and iCluster was also used in the METABRIC project (Curtis et al., 2012). The source code of the two methods was downloaded from the CRAN website1,2. Following the procedure described in (Shen et al., 2013), we tuned the parameters of iCluster (i.e., the number of clusters K and the sparsity penalty coefficient λ) by maximizing the reproducibility index. SparseK also contains two parameters, the number of clusters K and the 𝓁1 regularization parameter λ. By using the method described in (Witten and Tibshirani, 2010; Tibshirani et al., 2001), we first estimated the optimal λ for each K, and then determined the value of the optimal K based on gap statistic (Tibshirani et al., 2001). To test the ability of the three methods to handle high-dimensional data, we generated four datasets each containing a different number of the most variant genes, ranging from 5,000, 10,000, 15,000 and 20,000. Although in this study, we considered only gene expression data, it is possible to perform cancer subtyping by integrating genomics data from different platforms, including copy number, methylation and mutational data. Therefore, the ability to handle high-dimensional data is an important consideration in algorithm development. For each dataset, we performed a series of quantitative and qualitative analyses to compare the performance of the three methods.
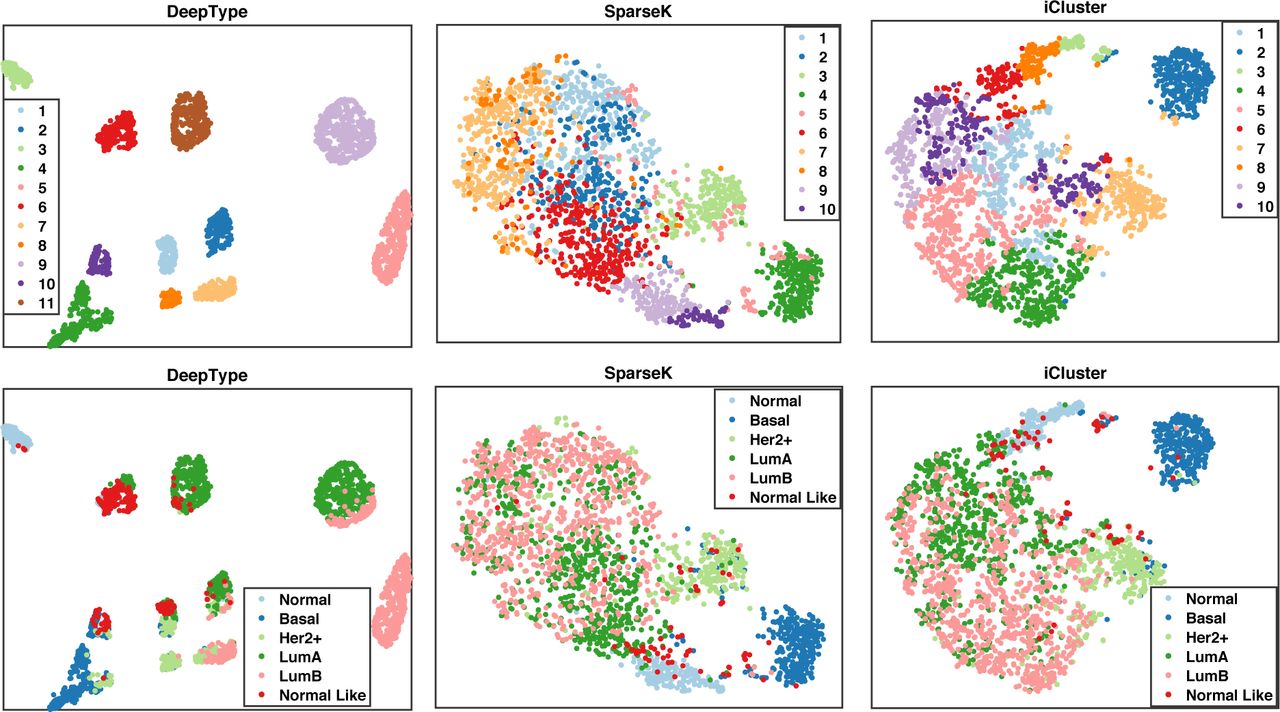
We first visualized the sample distributions of the clusters detected by the three methods (Figure 4). Since iCluster failed on the datasets with 15,000 and 20,000 genes due to the need of performing matrix inversion of high-dimensional data, we considered only the results generated by using the dataset with 10,000 genes. From the figure, we can see that DeepType identified eleven well-defined clusters, nearly all normal tissue samples were grouped into a single cluster, and the clusters that composed of tumor samples were well-separated and highly concordant with the PAM50 labels. In contrast, for SparseK and iCluster, the normal tissue samples were grouped into multiple clusters, which suggests that genes unrelated to cancer were selected. Moreover, the tumor samples with different PAM50 labels overlapped considerably, and did not exhibit a clear clustering structure.
Visualization of the sample distributions of the clusters detected by three methods applied to data containing 10,000 most variant genes. Each sample was color-coded by its clustering assignment (top) and PAM50 label (bottom). DeepType revealed a clear eleven-cluster structure including a cluster comprising primarily normal tissue samples.
We then performed a series of external and internal evaluations of the clusters detected by the three methods. For external evaluation, we assessed the concordance between the identified cancer subtypes and some widely used clinical and prognostic characteristics of breast cancer, including the PAM50 subtype (Parker et al., 2009), histological grade, Nottingham prognostic index (NPI) (Haybittle et al., 1982), gene expression grade index (GGI) (Sotiriou et al., 2006) and the Oncotype DX prognostic test (Paik et al., 2004) (See Supplementary Table S2 for a detailed description). Specifically, we used average purity and normalized mutual information (NMI) (Cover and Thomas, 2012) to evaluate the extent to which the identified subtypes matched the above described characteristics (Table 1). Our analysis showed that the subtypes identified by DeepType were highly concordant with the clinical variables and prognostic information. In all cases, the results generated by DeepType matched the PAM50 labels to the highest degree. This is expected since the PAM50 labels were used in training DeepType. Our method also produced the highest agreement with the histological grades, NPI and GGI. Notably, when compared with Oncotype DX, the average purities and NMI scores of DeepType were much higher than the other two methods. This is highly significant since while both NPI and GGI provide some values in predicting the clinical outcomes of breast cancer patients, Oncotype DX is the only test supported by level II evidence (Sparano et al., 2018). We performed a Wilcoxon rank-sum test to compare the overall performance of DeepType and the two competing methods. The p-values are 7.7e-14 (DeepType vs. SparseK) and 1.3e-19 (DeepType vs. iCluster).
External evaluation of subtypes identified by three competing methods applied to datasets with a various number of input genes. iCluster failed on datasets with 15,000 and 20,000 genes. DeepType significantly outperformed SparseK (p-value ≤ 7.7e-14) and iCluster (p-value ≤ 1.3e-19, Wilcoxon rank-sum test).
We next performed internal evaluation of the subtypes identified by the three methods. Internal evaluation utilizes only the intrinsic information of cluster assignments to assess the quality of obtained clusters, and compactness and separability are the two most important considerations (Halkidi et al., 2001). A compact and separable clustering structure means that samples in each cluster are homogeneous and different clusters are far away from each other, allowing new patients to be assigned with high certainty and low ambiguity. For the purpose of this study, we used the silhouette width (Wiwie et al., 2015) and the Davies-Bouldin index (Davies and Bouldin, 1979) to quantify the cluster compactness and separability. The results are reported in Table 2. In all cases, DeepType resulted in the highest silhouette width and the lowest Davies-Bouldin index, which is consistent with the visualization result presented in Figure 4. To compare the overall performance, the Wilcoxon rank-sum test was performed. Deeptype significantly out-performed SparseK (p-value ≤ 7.8e-5) and iCluster (p-value ≤ 7.8e-5). Our analysis suggested that our method resulted in subtypes with significantly higher cluster quality than the competing methods.
Internal evaluation of subtypes identified by three methods applied to datasets with a various number of input genes. The Davies–Bouldin index results in a value in [0, inf), and a smaller value suggests a better clustering scheme. DeepType significantly outperformed SparseK (p-value ≤ 7.8e-5) and iCluster (p-value ≤ 7.8e-5, Wilcoxon rank-sum test).
Finally, we compared the ability of the three methods to select relevant genes from high-dimensional data for clustering analysis. Table 3 reports the numbers of genes selected by the three methods applied to the data with a various number of input genes. Notably, while DeepType achieved the best result in terms of both internal and external criteria, it selected the fewest genes in all cases. For clinical applications, the ability to select fewer genes can help to develop a more economic clinical assay for breast cancer subtype identification.
The numbers of genes selected by DeepType, iCluster and SparseK applied to datasets containing a various number of input genes.
4 Conclusion
In this paper, we developed a deep-learning based approach that addresses some technical limitations of existing methods for cancer subtype identification. We demonstrated that the new method performed significantly better than two commonly used approaches in terms of both internal and external evaluation criteria. Although in our numerical study we considered only mRNA data, cross-platform data may provide more comprehensive information about cancer. Thus, as the future work, we will apply the proposed model to datasets of larger sample sizes from multiple genomic sources (mRNA, copy number, somatic mutation, methylation). It is expected that more accurate and robust cancer subtypes would be revealed.
Footnotes
References


