

Abstract
Single-cell RNA-seq has emerged as a powerful method to unravel heterogeneity of complex biological systems; this has enabled in vivo characterization of cell type compositions through unsupervised sampling and modelling of transcriptional states in single cells. Here we used the high-throughput microfluidic-based single-cell RNA-seq method Drop-seq to elucidate the cellular composition and functional diversity of breast tumours during the induction of metastatic disease in a transgenic model related to pregnancy-associated breast cancer (PABC). We characterised with unprecedented definition, how the activation of developmental programs associated to pregnancy results in the acquisition of an aggressive phenotype. We show that cancer cells are classified in a structure comparable with the lineages of the epithelial mammary gland hierarchy, revealing high dynamics and plasticity of cancer cells during disease progression. This cancer progression program is orchestrated by alveolar milk secretory cells, that in conjunction with cell types from the tumour microenvironment (TME), including cancer-associated fibroblasts (CAFs), form a multi-cellular process that resembles an aberrant involution. Finally, we analysed the interactome of the tumour ecosystem to define a high-resolution landscape of the molecular pathways of cell-to-cell communication that underpins extra-cellular remodelling and inflammation associated with the aggressive involution mimicry.
In conclusion, our study recapitulates developmental mechanisms that have gone awry during carcinogenesis in a model of PABC. We provide a large-scale single-cell transcriptional landscape of breast tumours that allows unprecedented understanding of breast heterogeneity and deep analysis of key molecular events that result in cancer malignancy.
1. Introduction
The mammary gland is a unique organ that undergoes a series of developmental processes that mostly occur postnatally, reaching its functional secretory capacity after puberty 1. In its adult form, the mammary gland is mainly formed of an epithelial ductal tree surrounded by the fat pad, a structure rich in adipocytes and fibroblasts that serves as a scaffold 2,3. The mammary epithelium is highly dynamic and its hierarchical structure varies in response to physiological factors 4 and the local paracrine factors within the tissue microenvironment (TME) 5–10. Such dynamic hierarchical structure is underpinned by a number of intermediate progenitors and cells with pluripotent capacity (reviewed in 11,12, however the existence of unipotent or bipotent stem cells and their identity is still controversial 13–21
The developmental stages that take place during pregnancy, lactation and involution are the most intense and result in extensive changed in tissue morphogenesis 11. During pregnancy the mammary gland undergoes extensive gland maturation and alveologenesis in preparation for lactation; this is characterised by epithelial cell proliferation and differentiation into alveolar milk-secretory cells, followed by the replacement of the interstitial adipose tissue with alveolar cells and an increase in vascularisation. Adipocytes, fibroblasts and endothelium are thus reorganised to support the newly formed epithelium and the intensive metabolic demand of milk production 1. The immune system is also intimately involved during pregnancy, participating in ductal branching and epithelial invasion through the fat-pad 1. In preparation for lactation, at the second half of pregnancy, Prl induces the up-regulation of Elf5, the master transcriptional regulator of alveolar cell fate 22,23, and other factors involved in milk production and mammary gland remodelling such as, Stat5 24–26 and Gata-3 27–29. The expression of Elf5 orchestrates the differentiation of the CD61+ luminal progenitor cells (also EpCAMhigh/Sca1+/CD49b+, 12) towards the CD61-alveolar differentiated population developing epithelial-like properties and polarisation and that ultimately result in the acquisition of secretory properties 11,23.
Mammary involution is also a highly complex multicellular process that occurs upon weaning when the lactating mammary gland returns to a quasi-nulliparous state 1,30; it can be divided into two stages, the first one is characterised by intense apoptosis of the secretory alveolar cells, and the second phase is governed by tissue remodelling, mediated by stromal fibroblasts and immune cells, and adipogenesis. In the involuting mammary gland, neutrophils and macrophages are in charge of cleaning the apoptotic bodies of the collapsing alveoli as well as regulating inflammation by suppressing the adaptive immune response. Fibroblasts are also activated during involution to fill the areas left by the dying epithelium in a pseudo-wound healing process 31. Thus, the exquisitely regulated morphogenesis of the mammary gland implies a high degree of cell-to-cell communication within the mammary epithelium but also throughout a vast array of cell types from the tissue microenvironment.
One of the most active areas of research in the last years has been the study of the contribution of normal process during mammary gland development to breast cancer. The different epithelial cell lineages of the mammary gland have been associated with the cell of origin of the breast cancer subtypes 32,33, including those with specific genetic aberrations 33,34. Furthermore, the association of developmental cues within breast cancer is not restricted to the epithelial compartment, as tissue morphogenesis encompasses dramatic changes within the epithelial ductal tree as well as its surrounding stroma. Importantly, pregnancy-associated breast cancer (PABC) is correlated with metastatic disease and poor prognosis (reviewed in 35). One of the possible reasons for the higher mortality in PABC is the effects of the hormonal load associated with the onset of pregnancy, however there is increasing evidence pointing to a direct effect of the TME and the events of tissue remodelling that occur in the mammary gland during pregnancy, in particular those associated to involution, as the driving force behind PABC 31,35,36. In this context, we have previously shown that pregnancy-associated transcriptional networks driven by Elf5 promote a lethal phenotype in breast cancer, including resistance to therapy37 and promotion of metastatic disease38. Elf5 profoundly affects cell intrinsic properties of breast cancer cells but it also heavily alters the TME dramatically increasing metastasis formation.
Here we use our pregnancy-associated breast cancer pre-clinical model of Elf5 overexpression in the MMTV/PyMT mice to study tumour heterogeneity at single-cell resolution. Our high-resolution cellular landscape analysis reveals strong plasticity and functional diversity of distinct cancer cell lineages, identifying cell types that are involved in key events during breast cancer progression, EMT, collagen deposition, inflammation and hypoxia. Our model recapitulates developmental mechanisms that have gone awry during carcinogenesis and that are heavily implicated in the promotion of metastatic disease on Elf5/PyMT tumours at single-cell resolution. Using orthogonal methods, we confirm how cancer cells hijack and subvert a developmental program that resembles mammary gland involution to promote pro-tumourigenic properties, including tissue remodelling, sustained inflammation that results in cancer immunotolerance and ultimately in metastasis. Lastly, we describe the cell to cell interactions in tumours from all cellular compartments. We find two particular cancer-associated fibroblast (CAF) subpopulations with features of involuting mammary fibroblasts that are dominantly presented in Elf5 tumours and suggest a crosstalk between cancer epithelial cells and CAFs to promote features of involution in breast cancer.
2. Materials and Methods
Animal statement, doxycycline induction
To promote tumour progression, ELF5 expression was specifically induced in mammary epithelial cells since puberty (6 weeks-old) through doxycycline containing food as performed previously 38. At ethical endpoint (7-13% tumour/body weight) mice were euthanized and tumours harvested and processed for single cell digestions as previously performed 38.
Tumour digestion and FACS
Mammary tumours were collected from MMTV-PyMT mice at 14 weeks of age, when tumour weights were 10±3% of total weight. Areas of necrosis were excluded and only regions of epithelial mammary carcinomas were used for digestion and analysis. Tumours were manually dissected into 3-5mm pieces using a surgical scalpel blade before being chopped to 100µm with maximum blade force on a McIlwain Tissue chopper. Tumour samples were incubated with 15,000 U of collagenase (Sigma #C9891) and 5,000 U of hyaluronidase (Sigma #H3506dissolved in DMEM high glucose with 5% FBS at 37°C shaking in 220rpm for 1 hour. Samples were briefly disrupted with a pipette every 15 min during the incubation time to ensure the tissues were sufficiently resuspended. 0.25% trypsin (Gibco #15090-046) in 1mM EGTA was used to digest the samples for 1min in 37°C waterbath before proceeding with a 5 minute incubation with 5mg/mL of dispase (Roche #04942078001) dissolved in PBS in 37°C waterbath. Red blood cells were then lysed with 0.8% ammonium chloride (Sigma #A9434) dissolved in water for 5 min in 37°C waterbath. Samples were washed with PBS containing 2% FBS and spun at 1200rpm for 5min at 4°C between each step. The supernatant was aspirated and 1mg/mL DNase (Roche) was mixed with the sample before incubation with each step. Finally, cells were filtered through a 40µM nylon mesh (Corning) and resuspended in PBS with 2% FBS. FACS was performed as detailed in 37,38. Briefly, cells were sorted on the FACSAriaIII (Becton Dickinson) following automated compensation (FACSDiVa) using a 100um nozzle. Cell were sorted using a purity mask to ensure purities of the sorted population in excess of 99%. Antibodies with conjugated fluorophores for sorting stromal cells used included CD140b (clone REA634) from MACS (Miltenyi Biotech), CD140a (clone APA5) from Biolegend, and CD34 (clone RAM34) from BD Pharmingen.
Auto macs cleanup
The viability of the cells was assessed by FACS. All tumours that contained less than 80% viable cells were labelled with Annexin specific MACS beads and dead cells were removed by passing the labelled cells through the autoMACS® Pro (Miltenyi). Highly viable cells (>85% viability assessed by DAPI in FACS) were loaded into the microfluidic Drop-seq pipeline.
Drop-seq
Cells were captured using the microfluidic devices described for Dropseq 39 following the Online Drop-seq Laboratory Protocol version 3.1 (www.mccarrolllab.com/dropseq). The tagmented and multiplexed cDNA libraries were sequenced in Nextseq 500 using Nextseq 500 High Output v.2 kit (75 cycles, Illumina Cat# FC-404-2005) following Macosko et al. recommendations with the following modifications. Drop-seq denatured libraries were loaded at 1.3pM final concentration and were spiked in with 10% of 1.8pM PhiX Control v3 (Illumina Cat# FC-110-3001). Sequencing specifications were as follows: 26bp Read1, 51bp Read 2 and single Nextera indexing (8bp). A total of ~3,000 cells/ per run were sequenced.
Bioinformatic analysis
The sequencing output was analysed using the McCaroll lab cookbook a custom genome (mm10 plus Trinity assemblies of transgene sequences 40) and gene annotation (gencode vM14 plus). Seurat (v Seurat_2.3.4 41) was the main platform for downstream analysis.
Firstly, we removed low-quality cells by modelling mitochondrial to nuclear gene content to <15% 39 and considering differences between homeostatic tissues and tumours (SuppFig. 1). We subsequently removed outlier cells that contained more than 4,000 genes as they could potentially constitute cell doublets. Thus, in summary, DGE matrices were trimmed for quality metrics (>200 genes, <15% mitochondrial reads, <1200 UMI and genes expressed in at least 3 cells).
These genes were organised into principal components that defined the variation in gene expression among our samples, SuppFig. 2 contains the genes associated to the most informative principal components in decreasing contribution to variation in gene expression (SuppFig. 2C) numbered PC1-18 (SuppFig. 2D). A graphic representation of the most informative PCs (SuppFig. 2E) revealed little variation among tumours from different animals of the same genotype. Two thirds of the total variation of the system was defined by the first 20 PCs corresponding to the second inflection point of the “elbow” plot shown in SuppFig. 2C.
Evaluation of potential batch effect was performed by PCA visualisation in the first 3 dimensions and outlier experiments were omitted. PyMT tumours are derived from the signal of the Polyoma middle-T oncogene in congenic FBVn animals of pure background, thus the effects of the environment are minimised as the individuals are exposed to identical controlled standard laboratory conditions.
QC filtering resulted in expression data for 15,702 genes across 28945 cells. Downstream analysis was performed according to Butler et al with UMI number regression and 20 principal components of variable genes being used for dimensional reduction (TSNE) and cluster calling 41.
Clustering tree 42 was employed in conjunction with cluster validation, and split error estimation across a range of clustering resolutions to identify optimal resolution values. CCA was performed on experiments split by genotype using the union of the top 2000 variable genes for each genotype. No cells were discarded from downstream analysis to retain unique subpopulations between the experiments and downstream analysis was performed as above using CCA in place of PCA.
Monocle (v2 ole43) was used to assemble cells assigned to epithelial clusters along a pseudotime vector generated from single cell expression of “Gorsmy” 44. States were assigned using DDRTree according to the manual.
CellphoneDB 45was performed for 100 cells expressing the highest number of genes in each cluster. A specific interaction was considered as significant if p<0.01 and mean score >0.3. Expression values of ligand/receptor gene pairs were plotted using Seurat DotPlot function for all cells in each cluster.
GSVA 46was calculated for averaged expression values for clusters or Poisson distributed counts data using gene mouse hallmark gene lists downloaded from http://bioinf.wehi.edu.au/software/MSigDB47,48. Metasignatures were generated by calculating the sum of scaled expression scores for all genes nominated for the signature in each cell. The relative contribution of each gene to the score was used to rank genes in the signature.
Clinical samples and survival analysis We used the METABRIC (Molecular Taxonomy of Breast Cancer International Consortium) dataset for our survival analysis 49. This dataset contains RNAseq data as well as detailed clinical information from breast cancer patients.
Patient survival analysis was performed using the “survminer” package (https://github.com/kassambara/survminer). Survival Curves were drawn using ‘ggplot2’. R package version 0.4.3 on METABRIC data accessed from the R-Based API for Accessing the MSKCC Cancer Genomics Data Server, CGDSR (R package cgdsr version 1.2.10). Cohorts were split by ELF5 expression and then by metascores and overall survival was compared by cox proportional hazards analysis.
Second Harmonic Generation (SHG) collagen imaging and analysis
SHG signal was acquired using a 25x 0.95 NA water objective on an inverted Leica DMI 6000 SP8 confocal microscope. Excitation source was a Ti:Sapphire femtosecond laser cavity (Coherent Chameleon Ultra II), tuned to a wavelength of 880 nm and operating at 80 MHz. Signal intensity was recorded with RLD HyD detectors (420/40 nm)). For tumour samples, 5 representative regions of interest (512 µm x 512 µm) per tumour were imaged, for CDMs 3 representative areas of 3 technical replicates over a 3D z-stack (20 µm depth; 20 µm depth for CDM, with a z-step size of 1.26 µm). SHG signal coverage in tumour samples was measured with ImageJ (National Institutes of Health, Bethesda, MD, USA). For CDMs mean SHG intensity was measured using Matlab (Mathworks). Representative images of maximum projections are shown.
Polarized light microscopy of picrosirius red stained sections and quantification of collagen content and birefringence
Paraffin-embedded samples were cut into 4 µm sections and stained with 0.1% picrosirius red for fibrillar collagen according to manufacturer’s instructions. As previously performed 50,51 polarized light imaging was performed on a Leica DM6000 fitted with a polarizer in combination with a transmitted light analyser. Quantitative intensity measurements of fibrillar collagen content and birefringent signal were carried out using in house scripts in ImageJ. The relative area of red-orange (high birefringent) fibres, yellow (medium birefringent) fibres, and green (low birefringent) fibres (as a % of total fibres) was calculated.
Hypoxia analysis
Tumours and lungs were harvested and fixed in 10% neutral-buffered formalin overnight. FFPE tissues were sectioned to 4µm for IHC staining as described in 38. Following the manufacturer’s instructions, the FITC-conjugated pimonidazole primary antibody (Hypoxyprobe, 1:1000) and the anti-FITC secondary antibody (Hypoxyprobe 1:100) was used to stain for the pimonidazole adducts. Quantification of hypoxia in IHC was performed using Andy’s DAB Algorithm 52.
Mammary gland whole mounting and immunohistochemistry
Mouse mammary glands from FVB/N mice with established lactation and mammary tumours from PyMT/WT and PyMT/ELF5 were fixed, defatted, dehydrated and carmine stained and paraffin embedded as previously described 53. Sections were stained with haematoxylin and eosin and with a mouse milk specific protein antibody (Accurate Chemical & Scientific CO, Cat #YNRMMSP) under conditions previously described 53.
Western Blot and Immunohistochemistry
Western Blot analyses of protein were performed as previously detailed in 37. The primary antibodies not described in Kalyuga et al were used as follows: E-Cadherin (BD bioscience #610181, 1:10,000) and Vimentin (Leica Biosystems # VIM-572-L-CE).
Mouse mammary glands and tumours from PyMT mice were fixed, defatted, dehydrated, stained in Carmine alum and Paraffin embedded as previously described 53. Sections were stained with the rabbit anti-mouse milk proteins antibody (Accurate Chemical & Scientific CO, # YNRMTM) diluted 1:12,000 as per 53.
3. Results
Unbiased high-resolution scRNAseq captures cell heterogeneity of MMTV-PyMT mammary tumours
Fifteen MMTV-PyMT mouse mammary tumours were harvested and analysed using Drop-seq, eight tumours from MMTV-PyMT/WT mice (PyMT/WT) and seven tumours from MMTV-PyMT/ELF5 (PyMT/ELF5) mice (Fig 1A). We Drop-seq-captured and sequenced a total of 26,613 cells (18,828 from WT tumours and 7,785 from ELF5 tumours). After applying stringent filtering conditions (See Material and Methods), 15,702 cells proceeded with the analysis (11,490 WT cells and 4,212 Elf5 cells). The distribution of genes identified in each replicate was consistent in all tumours analysed with the exception of tumour WT5 that showed a generally lower coverage with a consistent lower number of UMIs identified (SuppFig. 2A). However, this did not seem to impact subsequent analysis when the tumours were grouped by genotype, the distribution of number of genes identified and number of transcripts was very similar. The mean of genes that characterised each tumour cell was 1,079 unique genes from 2,535 UMIs, this included low and high transcriptionally active cells. We found a very strong correlation (0.97) between the number of UMIs and number of genes identified, indicating that the vast proportion of sequences obtained contributed to define the gene expression profile of each cell (SuppFig. 2B).

A) Experimental workflow showing a schematic representation of the transgenic MMTV-PyMT/Elf5 mouse model, the number of tumours analysed and the number of cells passing the QC filter in each genotype. B) Distribution of variable genes defined by expression and dispersion, highlighting typical canonical makers for each of the main lineages. C) Heatmap showing differential expression of the top expressed genes contributing to the epithelial, stromal and immune signature. The top right panel shows the score of the signature and the percentage of cells classified to each main cell lineage analysed. The tSNE visualisation shows the coordinates of each analysed cell after dimensional reduction coloured by its main cell lineage. Roman numerals define each of the spatially formed clusters (inset). The dot plot shows the top differential markers form each of the main cell lineages and their level of expression. Bottom left panel shows a representative contour plot of the cell composition of a MMTV-PyMT tumor analysed by FACS defined by EpCAM antibodies (epithelial cells), CD45 (leukocytes) and double negative cells (stroma). Violin plot shows distribution of the number of genes per cell in each of the main cell lineages. D) Feature tSNE plots showing the expression of typical canonical markers of each of the main cell lineages.
We used the dispersion and robustness of gene expression to define 6,176 informative genes in our data set that showed differences in expression level. Amongst these genes we identified typical marker genes of the three main cell compartments of PyMT tumours, namely epithelium, stroma and immune (Fig. 1B, highlighted in red, blue and green, respectively). We used these top-20 PCs to model the cell diversity in PyMT tumours (SupplFig. 2C and D) and performed K-means neighbour clustering classification of cells (SuppFig. 3). Cells from the biological replicates contributed to all cell clusters (SuppFig. 3A) indicating that the defined principal components were not driven by technical batch effects; rather induction of ELF5 expression was the major driver of diversity in variation of gene expression, we found a strong east-west polarisation in the main cluster driven by forced ELF5 expression (cluster I, SuppFig. 3B), however this effect was not observed in the smaller cell clusters (II-VII, SuppFig. 3B).
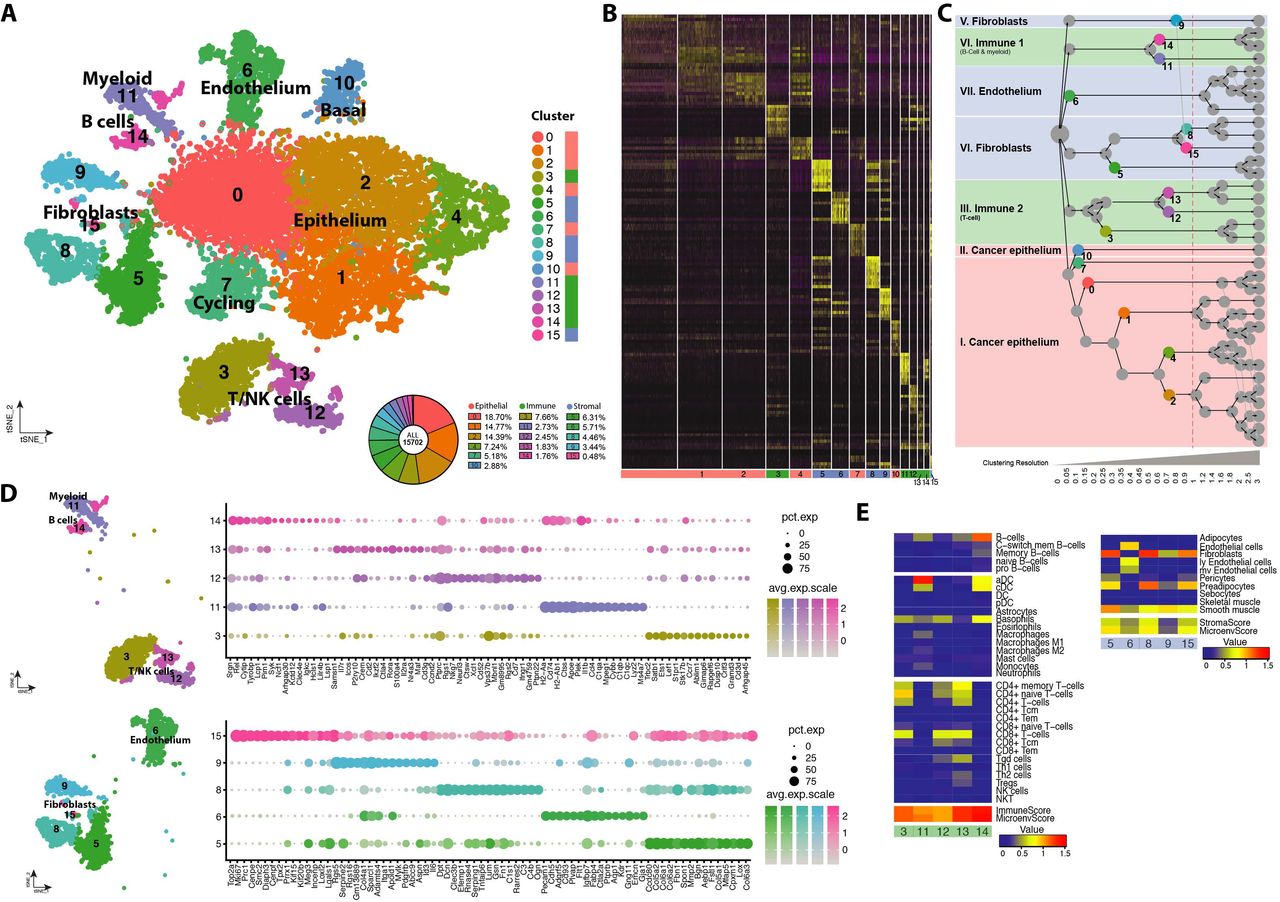
We identified the presence of the main cellular compartments in the tumours using cell signatures defined by Aran and colleagues, 54 (Fig. 1C). This analysis classified our cells into the three major cell classes, epithelium, stroma and immune cells. The majority of cells were defined as epithelial cells (63.16%); tumour associated stroma represented 20.41% of the cells identified; and the tumour-infiltrated immune cell compartment accounted for 16.44%. The composition of PyMT tumours found using Drop-seq was consistent with cell surface marker analysis (FACS) using EpCAM to define epithelial cells, CD45 to define leukocyte and non-stained cells to define the stroma (Fig. 1C, left bottom panel). The main cluster (I) was of epithelial origin and thus the polarisation effect derived from forced Elf5 expression was confined to the epithelial cell compartment. We confirmed the identification of these three major cellular components using the expression of canonical markers for each compartment (Fig. 1D).
We then used differential gene expression analysis and k-means clustering to identify cell lineages within these major cell classes (Fig. 2A & B). This clustering method generated 16 different cell classes present in the tumours at different abundances, revealing further cell heterogeneity in all major cell cluster; 6 classes of cancer epithelial cells (clusters 0, 1, 2, 4, 7 and 10), 5 stromal classes (clusters 5, 6, 8, 9 and 15) and 5 classes of tumour infiltrated immune cells (clusters 3, 11, 12, 13 and 14). We used a cluster tree representation 42 to visualise the phylogeny of the different clusters (Fig. 2C). Two main “families” of immune cells, three of stromal cells and two of cancer cells where defined very early in the phylogeny representing the major cell subclasses. The top differential marker genes that define stromal and immune cell compartments is shown in Fig. 2D). Such cell diversity within the major compartments was also validated using xCell algorithm 54 (Fig. 2E). The xCell signatures clearly identified endothelial cells and various classes of fibroblasts in the stromal compartment; a clear segregation between T-cells and all the other immune species such as B-cells, the diverse array of myeloid cells, macrophages, dendritic cells, monocytes, basophils and neutrophils. In the cancer epithelial cell compartment a separate cluster of cancer cells consistent with a basal stem-cell enriched population (cluster 10) and a cluster rich of cell cycle related genes (cluster 7) were the only two clusters not related to the previously shown east-west axis of cell polarisation driven by forced Elf5 expression.

A) tSNE plot showing cell clusters defined in each of the main cell lineages and their relative frequency. Far right column depicts the main cell lineage of origin for each cluster, showing 6 clusters of epithelial origin, 5 immune and 5 stromal. B) Heatmap showing the top differentially expressed genes that define each of the clusters. C) Cluster tree modelling the phylogenic relationship of the different clusters in each of the main cell types compartments at different clustering resolutions. Dashed red line shows the resolution chosen. Coloured circles in the cluster tree represent the origin of the clusters represented in the tSNE plot shown in panel A, the full cluster tree can be found in SuppFig 4A. D) Visualisation of the top differential genes for each of the defined clusters in the immune lineage (top) and in the stroma (bottom). E) Cell identification using score values for each of the metasignatures of the xCell algorithm in the immune and stromal compartment divided by cluster.
PyMT cancer cells are organised in a structure that resembles the mammary gland epithelial hierarchy
In our Drop-seq analysis, the major difference between genotypes was confined to the epithelial cell compartment. Thus, we performed an independent clustering on the epithelial subset cohort of cells (6475 PyMT/WT and 3233 PyMT/Elf5 cells) at an increased resolution (Fig. 3). Epithelial tumour cells were distributed in 11 clusters (Figure 3A and SupplFig 4B). Figure 3B shows the strong genotype-driven cell polarisation in the epithelial compartment, which was not due to batch effects (SuppFig. 5 and Extended Methods). The tSNE plot from Figure 3B shows that clusters 1 and 6 were formed mostly in response to forced ELF5 expression (>2 Fold of cells belong to PyMT/ELF5 mice, Fig. 3B Sankey diagram), while clusters 0, 7, 9, 4 and 3 were formed mostly by WT cells (>2Fold of cells belong to PyMT/WT mice). Clusters 2, 5, 8 and 10 were present in both WT and forced ELF5 expressing tumours (<2 Fold of cells from any of the genotypes). This distribution is consistent with the expression of Elf5 in each of these clusters (Fig 3B, top violin plots). Concomitantly with the scRNAseq data, FACS analysis of the cancer epithelial cells revealed that Elf5 forced differentiation of the luminal progenitors, defined by a decrease in the proportion of Sca1low/CD49b+ progenitor cells 12 within the luminal (EpCam+/CD49f+) population (Fig 3C).
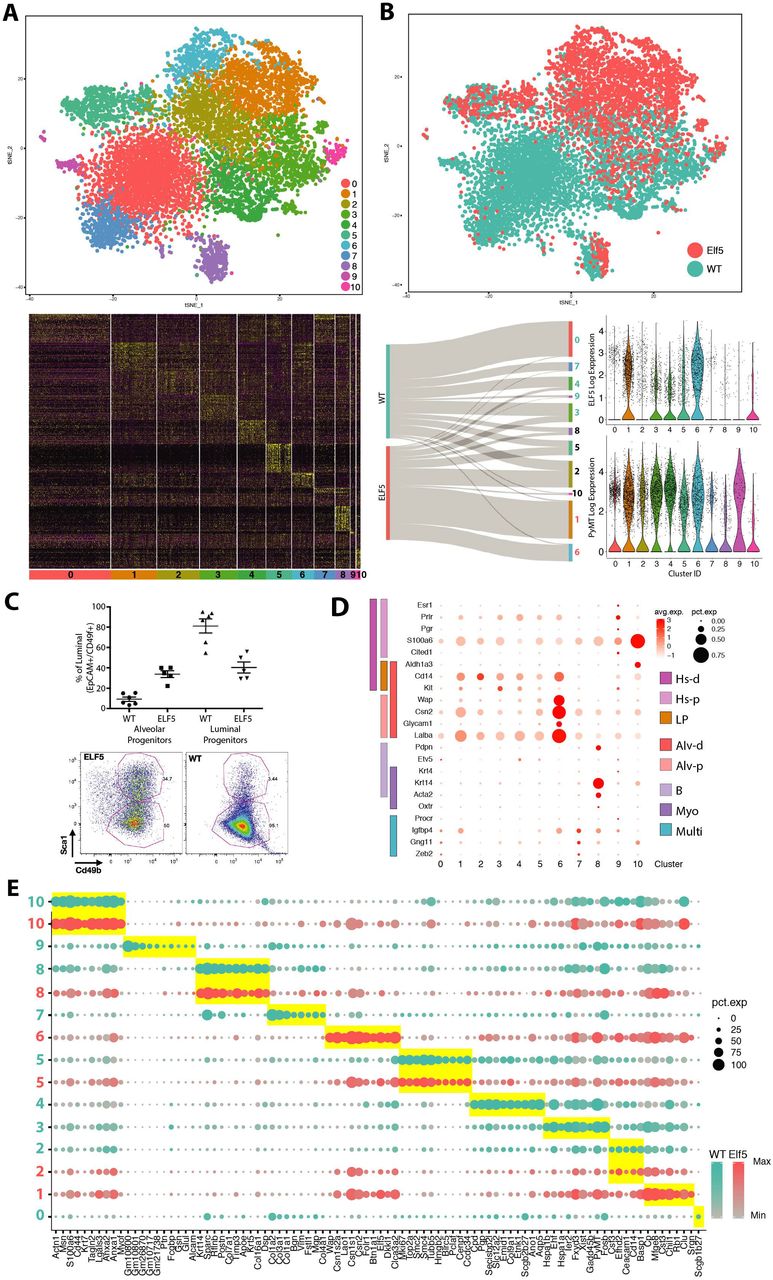
A) tSNE visualisation of the cell groups defined by k-means clustering analysis. Bottom panel shows a gene-expression heatmap of the top expressed genes for each cell cluster. B) Distribution of cells by genotype in the defined tSNE dimensions. The Sankey diagram shows the contribution of each of the genotypes to the cell clusters. Cluster numbers are coloured by the dominant genotype (>2-fold cell content of one genotype), Elf5 (red), WT (green). Violin plots showing Elf5 (upper plot) and PyMT (bottom plot) expression in each cell cluster. C) Scatter plot showing FACS data to define the % alveolar versus luminal progenitors using canonical antibodies that define the epithelial mammary gland hierarchy (EpCAM, CD49f, Sca1 and CD49b), in PyMT tumours. Each dot represents one animal (WT n = 6 and Elf5 n = 5); bottom panels are representative FACS plots of one of the replicates for each genotype. D) Dot plot representing the expression level (red jet) and the number of expressing cells (dot size) of the transcriptional mammary gland epithelium markers in each PyMT cluster. These marker genes were grouped according to each mammary epithelial cell type as defined by Bach, et al.: Hormone sensing differentiated (Hs-d, dark pink), Hormone-sensing progenitor (Hs-p, light pink), Luminal progenitor (LP, orange), Alveolar differentiated (Alv-d, dark red), Alveolar progenitor (Alv-p, light red), Basal (B, light purple), Myoepithelial (Myo, dark purple), Undifferentiated (Multi, light blue). E) Dot plot of the expression level of the top differential marker genes in each of the PyMT clusters coloured by genotype. The yellow rectangles highlight the top genes represented by each cluster. The size of the dots represents the percentage of cells/cluster that express each particular gene (pct. exp) and the colour gradient shows the level of expression for each gene/cluster. Note both colours are shown only when the cluster was populated similarly by both genotypes according to panel B.
We used the gene expression signatures defining the major epithelial cell lineages of the normal mammary gland 44 to determine which cell lineages best represented our MMTV-PyMT epithelial cell clusters. Ternary plots shown in SuppFig. 6A revealed that most clusters fell closest to the luminal progenitor corner, but clusters 7 and 8 were located towards the basal region while cluster 10 and a portion of the cells that belonged to cluster 9 were located towards the ML signature. Importantly, Cluster 10 showed very low levels of the PyMT oncogene (Fig. 3B bottom violin plot), suggesting that this cluster could be formed of untransformed normal cells that were trapped within the mass of the tumours, this hypothesis is consistent with the small number of cells that belonged to this cluster. To increase the definition provided by these signatures we also annotated PyMT clusters using the mammary epithelial lineage markers defined by Bach and cols. 55 (Fig. 3D). Cluster 0 and 7 expressed genes consistent with Procr+ multipotent/stem cells. Cluster 9 cells expressed hormone sensing (Hs) lineage markers, cluster 8 expressed markers for Basal (B)/ Myoepithelial (Myo) cells, clusters 1, 2, 3, 4, and 6 presented markers consistent with luminal cells, with clusters 2, 3, and 4 presenting progenitor markers while cluster 1 and 6 presented markers consistent with alveolar differentiated cells. By far, Clusters 5 and 10 were the most undefined clusters, showing mixed luminal and myoepithelial markers. Figure 3E shows the top differential markers associated to the malignant state of the main lineages of the mammary gland. Interestingly cluster 5 markers were strongly consistent with cycling cells, indicating that dividing cells are clustered together irrespective of their origin and could explain the reason why this cluster shows mixed gene markers.
Dynamic relationship and states of the malignant lineages of PyMT tumours: implications for the cell of origin of cancer
To further investigate the differentiation states present within the luminal lineage in the PyMT tumours, we performed pseudotime analysis using Monocle (Fig. 4). We used the mammary gland hierarchy gene signature 44 to build the pseudotime structure of the PyMT cancer epithelial cells identifying 7 discrete states (Fig. 4A). Consistent with previous results, ELF5 had a profound impact upon the structure of the epithelial cell diversity biasing the composition of the cells towards one of the right axes of the pesudotime plot (dominated by state 7) at the expense of a depletion of states 2, 4, 5 and 6. We then visualised the Monocle defined cell states using the coordinates from the tSNE (Fig. 4B) which allowed us to overlap the cell cluster identity defined in Figure 3 with the pseudotiming states from Fig. 4B (Fig. 4C and Supp.Fig 6B).

A) Pseudotiming alignment of the PyMT cancer epithelial cells along the gene signatures that define the main lineages of the mammary gland epithelial hierarchy using the DDRTree method in Monocle2. Right panels show the distribution of the cell states by genotype. B) Projection of the states defined by pseudotime analysis into tSNE clustering coordinates overall and per pseudotime state (miniaturised tSNE plots). Right panels show the projection by genotype. C) Overlay representation of the cell identities (k-means clustering as per Fig.3) and cell lineage identification (pseudotime analysis), the proportion of cells in each cluster that belong to each defined state is shown in the bar chart (right hand side). D) Enrichment analysis (GSVA score) for the gene signatures that define the main mammary gland lineages: Basal, Luminal Progenitor (LP) and Mature Luminal (ML) for each of the clusters. Bottom panels show the expression of each of the gene signatures at single cell resolution. The top bar shows the assigned mammary epithelial cell type as per section C. E) Frequency of the different cell lineages in each genotype. F) Cluster tree showing the phylogeny relationship of the different clusters. Red arrow shows the resolution used (0.7). G) Illustration of cell diversity of PyMT tumours based on the canonical structure of the mammary gland epithelial lineages.
The alveolar lineage was clearly defined by 2 distinct cell identities (cell clusters 1 and 6); the sensor lineage was composed of cluster 9, and the myoepithelial/basal lineage was formed by clusters 7 and 8. An undifferentiated cluster with multipotent/stem characteristics (cluster 0, apart from the cluster 5 of the cycling cells) sat in a position equidistant from the myoepithelial and the luminal lineages (alveolar and sensor). Interestingly, and consistently with the literature where stem cell properties are confounded by myoepithelial properties 56, cluster 7 was classified by Monocle as part of the basal/myoepithelial lineage, however this cluster presents strong multipotent characteristics similar to those present in cluster 0. The most difficult compartment to define was the luminal progenitor (represented by cluster 2, 3 and 4) presumably due to their strong plasticity and subtle differential features.
To gain insights in this definition, we used GSVA and metasignatures (See Material and Methods) to score each of the clusters according to the mammary gland epithelial signatures defined by Pal and cols. (Fig. 4D). Hierarchical clustering based on GSVA scores associated Cluster 2 with the alveolar lineage suggesting its identity as a pre-alveolar committed luminal progenitor, or a cell type that sits in the hinge between the luminal progenitor and the alveolar lineages. Similarly, Cluster 4 was associated to the hormone-sensing lineage represented by Cluster 9, indicating a luminal progenitor committed towards this lineage. In this scenario, Cluster 3 remained undefined so we classified it as uncommitted luminal progenitor. tSNE visualisations of these metasignatures are shown in Fig 4D which further confirmed the cell distribution of the three main mammary epithelial lineages. The distribution of the different lineages in the two genotypes is shown in Fig. 4E.
Figure 4F shows the relationship between clusters at different resolutions. These cluster tree groups are consistent with the cell states defined in the trajectory analysis. The phylogeny shown in the cluster tree revealed an early separation between the two major lineages, the myoepithelial/undifferentiated (Cluster 0 from resolution 0.1) and luminal lineages (Cluster 1 from resolution 0.1).
Altogether, the combination analysis of gene signatures, gene markers and pseudotiming enabled the precise annotation of PyMT cell clusters within the mammary hierarchy proposed by Pal et al., identifying a large luminal lineage that retains most of the cell diversity and strong plasticity, a basal/myoepithelial compartment and a hormone-sensing lineage (Fig. 4G).
Molecular mechanisms of cancer progression associated to cancer cells of Alveolar origin
The functional annotation of the identified epithelial cell clusters, using GSVA, showed the expected functions of the annotated cell types from Figure 4G (Supp. Fig. 7 and Table 1). A detailed discussion on the biological functions associated to each cluster can be found in Supplementary Information
Functional annotation of each cell cluster from the tumour epithelium.
We next sought to validate some of the functional findings found in cancer cells of Alveolar origin (Clusters 1 and 6) characteristic of PyMT/ELF5 tumours, including the decrease of cell proliferation, lack of EMT and increase of hypoxia (37,38,57 and Table 1). Figure 5A shows the distribution of cell cycle marker signatures 58 in the epithelial cell compartment. These signatures identified a specific group exclusively populated by cells undergoing G2M/S, PyMT/ELF5 tumours showed an enrichment on G1, this is consistent with our previous results of the effects of Elf5 increasing cell cycle times by delaying entry in S phase in cell lines of human breast cancer 37, and with reduced cell proliferation in PyMT tumours 38.

A) Cell cycle stages of the PyMT cancer cells as defined by gene expression signatures using tSNE coordinates and their deconvolution (middle panel). Circled area shows the cycling cluster (C5 in Fig. 3) characterised by a total absence of G1 cells. The quantification of the proportion of cells in each stage grouped by genotype is shown in the bar chart. B) Enrichment GSVA analysis of gene expression metasignatures of cancer-related and Elf5-related hallmarks associated to PyMT/WT (green) and /Elf5 (red) tumours. C) tSNE representation of the EMT gene expression metasignature at the single cell level. Right panel shows a western blot of canonical EMT markers (E-Cadh, E-Cadherin and Vim, vimentin) on PyMT/WT or ELF5 full tumour lysates. Note: the two images correspond to the same western blot gel cropped to show the relevant samples. D) Hypoxia metasignature at the single cell level is shown in the tSNE plot, bottom panel shows a bar plot of the extension of the hypoxic areas in PyMT/WT (green) and /Elf5 (red) tissue sections (tumours and lung metastasis) stained using IHC based on hypoxyprobe binding, representative images are shown in the right panels. E) Lactation and Late Involution (stage 4, S4) metasignatures at the single cell level is shown in the tSNE plots. Pictures show IHC with an anti-milk antibody in tissue sections from a lactating mammary gland at established lactation compared with a mammary gland from an aged-matched virgin mouse; and in PyMT/WT and Elf5 tumours. F) Kaplan-Meier survival curves based on Elf5 expression using the METABRIC cohort. Patient were segregated according to Elf5 expression levels based on tertiles. Elf5-high patients (red) were defined as the top-tertile and Elf5-low patients (green) as the bottom-tertile, Log-rank p values <0.05 are shown in red. The bar chart (bottom panel) corresponds to the distribution of the PAM50 classified breast cancer subtypes in the top and bottom Elf5 expressing tertile of patients. G) Upper panel: Survival analysis (Kaplan-Meier curves) for the expression of Elf5 (left hand side) and the Involution metasignature (right hand side) in luminal breast cancer patients as per section F) Bottom panel: Kaplan-Meier survival curves for the late involution metasignature in Elf5-high patients (left hand side, ELF5-H) and Elf5-low patients (right hand side, ELF5-L). Each group of patients (ELF5-H and ELF5-L) were segregated according to tertiles for the combined expression levels of the genes from the involution metasignature: Green, inv low, bottom third; Blue, inv mid, middle third and Red, inv high, top third. Log-rank p values <0.05 are shown in red.
We then performed GSVA for specific signatures of known functions of Elf5, and functions suggested by the Hallmark analysis from SupplFig 7, which included lactation, involution, EMT and hypoxia (Fig. 5B). This analysis revealed strong inductions of lactation, involution, MET and hypoxia associated to Elf5/alveolar tumours (Fig. 5B). A tSNE visualisation of the EMT gene signature showed strong association with myoepithelial and undifferentiated cells and a negatively enrichment in cells of other lineages, including alveolar cells (Fig. 5C) which it is a known characteristic of Elf5 effects 37,38,57. Western Blot on total cell lysates of PyMT/WT and /ELF5 tumours for canonical markers of EMT that have been previously identified to be regulated by Elf5 via repression of SNAI2 57 confirmed that Elf5 tumours were depleted of such EMT markers at the protein level. Although E-Cadherin levels were not significantly different, Elf5/alveolar tumours show a clear reduction of Vimentin (Vim) indicating MET (Fig. 5C).
We have previously shown that PyMT/ELF5 tumours presented extensive vascular leakiness, a fact that can lead to increased hypoxia 38. Cells enriched for a hypoxic gene signature concentrated in myoepithelial and alveolar cells (Fig. 5D). We confirmed these findings using hypoxyprobe to identify hypoxic regions in the tumours. Immunohistochemistry showed extensive hypoxic regions in PyMT/ELF5 tumours compared to their WT counterparts, indicating that alveolar cells are strong drivers of events leading to hypoxia or these cells are able to survive better in hypoxic regions. This phenotype was strong enough to induce hypoxia in the metastases of a highly oxygenated tissue such as the lung (Fig. 5D).
As expected, the lactation signature was strongly enriched in cells of alveolar origin (Fig. 5E, top tSNE plot). Immunohistochemistry using anti-milk antibodies revealed a strong production of milk in PyMT/ELF5 tumours compared to PyMT/WT tumours (Fig. 5E, IHC pictures). The production of milk in a context where there is no suckling pup or structure of the mammary gland to be able to eject milk, results in the accumulation of milk in PyMT/ELF5 tumours. In the normal mammary gland, milk stasis subsequently generates the signals that trigger mammary involution. In this scenario, we could identify an involution gene signature 59 associated with the luminal lineage in PyMT tumours, specifically enriched in alveolar cells (Fig. 5E, bottom tSNE plot).
High Elf5 expression levels are a poor prognosis factor in luminal breast cancer 38, thus we asked whether lactation and/or involution signatures could predict for patient survival. We used the METABRIC dataset 60 first to assess the effects of Elf5 expression in breast cancer patents in this cohort. We found a significant association between Elf5 high expression and poorer patient prognosis, and also a consistently higher proportion of TNBC basal subtype in the Elf5-high group (Fig. 5F), which goes in line with previous reports 37. We have previously shown the importance of Elf5 in the acquisition of endocrine therapy resistance, thus we next assessed the prognostic value of the involution and lactation signatures in the luminal subtype. Importantly, Elf5 expression, the involution signature (Fig. 5G, top panels) or the lactation signature alone (data not shown) did not have predictive value, however the presence of the involution gene signature in Elf5-high patients was exclusively associated with poor prognosis (Fig. 5G, bottom panels). The lactation signature combined with Elf5 did not show any significant association (data not shown).
Taken together, single-cell transcriptomics enables the identification of biological properties of mammary tumours and, in particular, the role of mimicry involution associated with the Elf5-alveolar subtype in luminal breast cancer.
Characterisation of cancer-associated fibroblasts in PyMT tumours
The involution process involves cell apoptosis and tissue remodelling, the latter of which is orchestrated by stromal and immune cells 61. Among these cell types, fibroblasts have a critical role in the extracellular matrix remodelling and immune suppression during involution 62. Thus, we further explored the role of cancer-associated fibroblasts (CAFs) in aberrant involution in our model.
Unsupervised clustering on the fibroblast subset (2,255 pooled cells from PyMT/WT and PyMT/Elf5 tumours, SuppFig. 8A) revealed three major fibroblast clusters (res 0.1) (Fig. 6A and SuppFig. 8B). tSNE representation of the cell cycle showed that a cell subgroup of Cluster 2 corresponded to cycling cells (SuppFig. 8C, LHS), which was further grouped as a unique cluster under a higher resolution (res 0.4) (SuppFig. 8C, RHS).

A) tSNE plot groups defined by k-means clustering analysis showing a total of three cell clusters defined within the fibroblast subtype. B) Metasignatures of Cancer-associated fibroblast (CAF) signature (upper plot) and myfibroblasts (bottom panel) plotted in the fibroblast tSNE. The gene list of each metasignature was manually annotated from published scRNAseq data in human tumours 64,65. C) Desmoplastic (upper plot), Inflammatory (middle plot) and Contractile (bottom plot) metasignatures plotted in the fibroblast tSNEs from public data 67. D) Violin plots displaying marker genes for each of the three fibroblast clusters defined in section A: ECM-CAFs (0), immune-CAFs (iCAFs, 1) and myofibroblasts (2). E) Upper plot: tSNE illustration of the involution signature from 62. Middle plot: tSNE plot defined by k-means clustering analysis at resolution 1 of the fibroblast population showing a total of nine cell clusters. Bottom section: Violin plots on these nine cell clusters of the three out of four genes from the involution signature. F) Upper plot: Distribution of fibroblasts by genotype (Elf5: red), WT: green) in the defined tSNE dimensions. Bottom plot: Sankey diagram showing the contribution percentage of each of the genotypes to the cell clusters. Cluster numbers are coloured by the dominant genotype (>2-fold cell content of one genotype), Elf5 (red), WT (green). G) GSVA enrichment analysis of involuting mammary fibroblast metasignatures associated to PyMT/WT and /Elf5 tumours. Violin plots of Cxcl12, Mmp3 and Col1a1 genes in all fibroblasts of each genotype. PyMT/WT (green) PyMT/Elf5 (red).
CAFs are known to be highly diverse, which it was confirmed in our system as classical fibroblast markers 63 failed to be specific to our transcriptomically defined clusters (SuppFig. 8D). Previous unbiased scRNAseq analyses in human tumours has classified two major CAF subtypes 64,65: activated myofibroblasts, involved in tissue remodelling architecture by physical forces; and secretory CAFs related to ECM synthesis and cyto- and chemokine production 66. Clusters 0 and 1 were enriched for a secretory CAF signature (CAFs-0 and CAFs-1) while the activated myofibroblast signature was concentrated in Cluster 2 (CAFs-2) (Fig. 6B). Functional annotation using GSVA analysis (SuppFig. 9A) revealed that secretory CAFs-0 were governed by hallmarks of EMT, suggesting a tissue remodelling function; while secretory-CAFs-1 clearly showed immune-related functions (top enriched hallmarks “Interferon alpha response”, “IL6/JAK/STAT3 signalling” and “Interferon gamma response”). Additional datasets of CAF function 67 further confirmed such differences among clusters (Fig 6C & D): CAFs-0 were enriched for an desmoplastic signature, characterised by genes involved in extra cellular matrix (ECM) interactions; CAFs-1 showed characteristics of immune/inflammatory fibroblasts, with genes involved in cytokine-cytokine receptor interactions, monocyte recruitment and the Complement Cascade; and CAFs-2 were enriched for a contractile signature, characterised by the expression of genes involved in actin cytoskeleton organisation.
Taken together, we have functionally characterised three different classes of fibroblasts in PyMT tumours, 2 secretory-CAFs classes that we defined as ECM-CAFs (CAFs-0) and immune-CAFs (iCAFs) (CAFs-1); and a contractile CAF-myofibroblast class.
CAFs from Elf5/PyMT mammary tumours show features of mimicry involution
Mammary involuting fibroblasts have unique properties that include a high production of fibrillar collagen, ECM remodelling and immune suppression trough monocyte recruitment 62. This specialised class of fibroblast involved in involution are characterised by the expression of Col1a1, Cxcl12, Tgfb1 and Mmp3. Within our PyMT tumours we identified a group of ECM-CAFs and iCAFs with high expression of these involution markers (Fig. 6E, upper tSNE plot). These cells were further defined as discrete groups when a higher resolution was applied in the clustering (Fig. 6E middle panel. Clusters 2 and 3) and confirmed an enriched CAF-involution signature for both cell Clusters 2 and 3 (Figure 6E bottom violin plots), from now on called involution-iCAFs and involution-ECM-CAFs, respectively. Involution-CAFs were enriched in PyMT/Elf5 tumours where >2 fold of involution-CAFs, Cluster 2 and 3, belonged to PyMT/ELF5 mice (Fig. 6F). Supplementary Figure 8E demonstrated that such genotype polarisation was not due to batch effects. Consistently, GSVA of the CAF-involution signature and involution marker genes were significantly enriched in the CAFs from ELF5 tumours compared to the WT (Fig. 6G).
The functional annotation of the involution fibroblasts revealed specific differences within each ECM- or immune-CAF subpopulations (SuppFig. 9B). For example, the top pathways of the involution ECM-CAFs that were unique of this ECM subgroup, fatty acid metabolism and peroxisome hallmarks, suggested that these cells may correspond to adipocyte-like fibroblasts arisen through a de-differentiation process of mature adipocytes 68 or transdifferentiation process of activated fibroblasts 69. Adipocyte-derived fibroblasts secrete fibronectin and collagen I and have invasive properties 68,70. Moreover, during the stromal remodelling stage in involution, there is a re-differentiation of the adipocytes 61,71. Thus, this involution ECM-CAF population might correspond to highly secretory CAFs that are able to remodel the ECM in a similar way to that which involuting fibroblasts would re-organise the ECM to facilitate the detachment of the apoptotic alveoli and the repopulation of the stroma by adipocytes. Involution iCAFs, on the other hand, showed pathways linked to a wound-healing process, including inflammation through the complement cascade and coagulation 59,72,73. The late stages of involution share many wound-healing properties such as high immune cell infiltration and immune suppression 74, thus this involution iCAFs might be responsible for these two immune-related processes.
Our finding on CAFs activation mediated by Elf5-alveolar epithelial cells has never been reported before, thus we performed orthogonal functional validation for the role of CAFs in ECM remodelling by the production of collagen fibres in both PyMT/WT and PyMT/Elf5 tumours. Second Harmonic Generation (SHG) imaging and picrosirius red staining of tumour sections showed an increase in fibrillar collagen coverage in PyMT/Elf5 tumours compared with their PyMT/WT counterparts (Fig. 7A and B). Polarised light microscopy showed that PyMT/Elf5 tumours had a significantly higher proportion of thicker and mature collagen fibres than PyMT/WT tumours (Fig. 7C). Further analysis of matrix ultrastructure revealed a more complex spatial arrangement (peak alignment (+/-10 degrees from peak)) of collagen fibres in PyMT/Elf5 tumours than in PyMT/WT tumours (Fig 7D). Taken together these results show higher fibroblast activity both in collagen deposition and in their rearrangement in PyMT/Elf5 tumours.

A) Representative bright field images and quantification of total coverage of picrosirius red-stained PyMT/WT and PyMT/ELF5 tumours sections n=4 mice per genotype with 10 regions of interest (ROI) per tumour. B) Representative maximum intensity projections of SHG signal and quantification of SHG signal intensity at depth (µm) and at peak in PyMT/WT and PyMT/ELF5 tumour sections, n=6 mice per genotype with 6 ROI per tumour. C) Polarised light imaging of picrosirius red stained PyMT/WT and PyMT/ELF5 tumour sections, and quantification of total signal intensity acquired via polarised light. Thick remodelled fibres/high birefringence (red-orange), medium birefringence (yellow) and less remodelled fibres/low birefringence (green) n=4 mice per genotype with 10 ROI. D) SHG images of PyMT/WT and PyMT/ELF5 tumours assessed for differences in fibre orientation angle and quantification of frequency of fibre alignment ranging from the peak alignment. Different colours correspond to specific angles of orientation n=6 PyMT/WT and n=4 PyMT/ELF5. Inset shows the cumulative frequency of fibre alignment +/-10 degrees from peak.
Characterisation of the cell-to-cell interactions involved in the cancer-associated involution mimicry
Our findings showed that CAFs responded to involution signals presumably originated in the alveolar cancer cell compartment. As the TME is highly complex and there are numerous possible cellular interactions we used our high-resolution single cell RNAseq data to identify networks of cell-to-cell communication in PyMT tumours.
Recently, CellphoneDB was implemented to explore cellular interactions among ensembles of cells from scRNAseq data 45. CellphoneDB is a manually curated repository of ligand-receptor interacting pairs (www.CellPhoneDB.org) combined with a statistical framework to predict cell-to-cell connections (see Material and Methods). CellphoneDB analysis in PyMT tumours revealed an intricate network of cell interactions, allowing us to define molecular pathways for cell communication in almost all of the cell clusters (Fig. 8). Figure 8A shows the interactome of all cell clusters defined in this study (Figure 3 for the epithelial clusters, Figure 6 for the CAFs and Figure 2 for all other clusters). These interactions were ranked from strongest to weakest (Fig 8A, count above mean 0.3) which allowed us to divide them in three levels: 1) Fibroblast-Fibroblast interactions were the strongest followed by Fibroblast-epithelium connections; 2) Endothelium-fibroblast or -epithelium and epithelium-epithelium interactions were ranked as mid interactions; and 3) the weakest connections were found in the immune cell compartment. These results show a pivotal role of CAFs as hubs of communication within the TME.

A) Heatmap of the cell-cell interactions of all cell types from PYMT tumours based on Cellphone DB. Cell classification was based on the annotation from Figure 3 for the epithelial compartment; from Figure 6 at resolution 1 in the case of fibroblasts, where the cycling cluster (Cluster 6) and the residual cluster of 15 cells (Cluster 8) were removed; in addition, Clusters 7 and 2 were considered as a sole group annotated as “Myofibroblasts”. The rest of the cells from the immune and stromal compartments were classified according to the annotation done in Figure 2 (See Supplementary Figure 9C for global annotation). The Scale at the right-hand side shows the interaction strength based on the statistical framework included in CellphoneDB (count of statistically significant (p<0.01) interactions above mean= 0.3, see methods). B) Graphical representation of all significant cell-cell interactions identified by CellphoneDB using the parameters of more than 10 significant interactions with a mean score greater than 0.3, number cut as more than 10 connections and number split 10. The red circles correspond to the cell types from the epithelial compartment; the blue triangles represent the cells from the stromal compartment and the green squares are the cells from the immune compartment. The size of geometric figures is relative to the number of cells involved in the interactions (display as count). Different number splits were applied to establish the most significant interactions for the fibroblast and immune cell types. Fibroblast showed the strongest interactions (highlighted as blue lines) when a number split of 67 (1st Tier) and 50 (2nd Tier) were used. The immune system showed weaker interactions (highlighted as green lines) at a number split of 15 (3rd Tier) and 11 (4th Tier). C) Representative dot plots of ligand (no background)-receptor (red background) pairs. The size of the circles is relative to the number of cells within each annotated cluster that showed a positive expression of each gene and the blue gradient represents the average scaled expression. D) Violin plots of genes from canonical pathways known to recruit and expand MDSCs. E) Proposed molecular model of involution mimicry driven by Elf5 where CAFs and MDSCs are the major cell types involved.
Involution accounts for an interactive cell network where epithelial cells, fibroblasts and immune cells are the key players 61. Thus, we next focused on exploring such communication network based on CellphoneDB. We interestingly found that when the most restrictive cut offs were applied (Fig. 8B, 1st and 2nd Tier, blue lines), the ECM-CAFs (involution and fibroblast cluster 2) and involution iCAFs showed the largest number of interactions between themselves and also with the two Elf5 enriched-alveolar epithelial cells clusters (epithelial Clusters 1 and 6), the myoepithelial cells and the luminal progenitor hormone sensing cells (LP Hs). In the immune system interactive network (Fig. 8B, 3rd and 4rd Tiers, green lines). The myeloid compartment showed the strongest and biggest number of connections and interestingly, myeloid cells communicate with the two alveolar epithelial clusters, with ECM CAFs (involution and fib cluster 2), involution iCAFs, myofibroblasts and with the endothelium. Involution is associated with the M2-like innate response, such these results are in line with an activated and interactive innate myeloid response 30,59,75.
We then investigated what particular ligand/receptor interactions were found among CAFs, alveolar epithelial and myeloid cells in order to find common pathways linked to involution (Fig. 8C). Overall, we found pathways associated with the multi-functional aspects of involution (TGFβ axis) 76,77; networks associated with an immune suppressive ecosystem (Cxcl12 and Dpp4 axis) 62,78 and ECM remodelling (IGF axis) 79 (Fig. 8C). Transforming growth factor β2 and 3 (TGFβ2 and TGFβ3) are ligands produced by CAFs and the two alveolar epithelial clusters, while their receptor TGFβR3 is exclusively expressed in involution ECM and iCAFs and in iCAFs-1 (Fig. 8C and D).
The chemokine Cxcl12 is exclusively expressed in the involution iCAFs and two of its known receptors, CXC chemokine receptor 4 (CXCR4) and atypical chemokine receptor 3 (ACKR3 or CXCR7), are expressed in iCAFs-1 and B and T cells, respectively. Dipeptidyl peptidase-4 (Dpp4) was expression was restricted to iCAFs-1 and showed a highly interactive axis; Dpp4 connected with the involution iCAFs through Cxcl12 and with myeloid cells through Cxcl2 and Cxcl10. The IGF1/IGF1R signalling pathway was found to be highly specific to the two involution CAF subtypes, ECM and immune, in which a predicted positive feedback loop among these cells was observed. Of note is that IGF signalling is classically associated with collagen and ECM remodelling in fibroblasts 79.
We have previously demonstrated that infiltrated myeloid-derived suppressor cells (MDSC) are involved in Elf5-driven lung metastasis in PyMT tumours 38 and our CellphoneDB analysis confirmed a high number of interactive networks of myeloid cells with the rest of the tumour components, therefore suggesting that MDSC might be responsible for some of these interactions. Unfortunately, due to the low number of myeloid cells from our unbiased Drop-seq approach we were unable to further divide the myeloid compartment into their subtypes, especially for the detection of MDSC which is a rare-cell population 80. However our scRNAseq showed expression of genes from well-known signalling pathways for MDSC expansion, recruitment and malignant activation 81 (Fig. 8D). G-CSF (Csf3), a potent growth factors to attract and recruit MDSCs, was expressed in cancer cells associated to the alveolar clusters, which could explain the increased infiltration of MDSCs in PyMT/Elf5 tumours 38. Malignant activation of MDSCs is also driven by M-CSF (Cfs1), mainly expressed by CAFs. In addition, VEGF (Vegfa), was highly secreted by alveolar, basal cancer cells and CAFs, and IL6 is mainly secreted by CAFs and endothelial cells, these are factors that contribute to MDSC expansion. Potent MDSCs chemo-attractants were expressed by a diverse range of cell types within the tumour, Cxcl1 is ubiquitously expressed in most cell types, while Cxcl2 which can be found at low expression on many cell types, was highly expressed in the myeloid cell cluster, suggesting this is a mechanism that tumours may use to maintain a feedback loop enabling continuous myeloid cell recruitment. Other recruitment factors such as Cxcl12 previously described or Ccl2 are specifically secreted by CAFs. Altogether, our results show that MDSCs recruitment and malignant activation is not just driven by cancer cells but by a complex molecular network that originates within all cell compartments in the TME, mainly CAFs, endothelial cells and infiltrated myeloid species.
In summary, we have found that cells in the TME of PyMT tumours are highly interactive. We have identified a particular functional network in Elf5 tumours involving ECM CAFs, involution iCAFs and alveolar epithelial cells that orchestrate developmental pathways similar to established involution.
4. Discussion
Here, we study the molecular and cellular events acquired during metastatic progression by alteration of the composition of the mammary epithelium towards the basal epithelial-like TNBC subtype. We use a doxycycline-inducible MMTV-PyMT/Elf5 mouse model to force the differentiation of the alveolar lineage, simultaneously characterising the composition of the mammary epithelium and the TME during the acquisition of the metastatic phenotype using highly-parallel scRNAseq technology.
Conventional transcriptional analyses have classified PyMT tumours within the luminal subtype of breast cancer 33,82, presumably due to the prevalent presence of the luminal progenitor cells; however our scRNAseq analyses reveal a much higher diversity of epithelial cell types which resemble all of the intrinsic subtypes of breast cancer coexisting within each tumour (Fig. 4) 13,17,21,44,55,83,84. For many years, the study of the mammary gland epithelial hierarchy has provided important insights into the cell of origin of the different breast cancer subtypes 32-34,82,85,86. Our high-resolution analysis has revealed intermediate “states” within the luminal progenitor compartment that show features and some commitment towards a hormone-sensing lineage (epithelial cluster 4), or alveolar lineage (epithelial cluster 2), a quality also found in the normal mammary epithelium 55. The structure of the mammary epithelial hierarchy has been recently investigated using scRNAseq technology both in mice 44,55,84, and in humans 87. These studies support the current understanding of the presence of three main epithelial lineages both in mouse and human. Interestingly, a transcriptional definition of a cell type consistent with a stem-cell identity was not achieved, suggesting that the “stem-cell state” is not static and rather is a highly dynamic state within a transcriptional space that is strongly influenced by the cell’s niche 88. These studies however support the bi-progenitor theory 16,89 as they identify an early basal progenitor, responsible for giving rise to the myoepithelial lineage and a luminal progenitor, which gives rise to the alveolar and hormone sensing lineages. Thus, our findings underscore the intense plasticity associated with the luminal progenitor population, and supports the current understanding of these transit-amplifying cells as the cell of origin of basal and luminal cancers (reviewed in 32) and thus contributing to the inter-tumour heterogeneity.
Our Elf5 transgenic model recapitulates the differentiation of the pregnancy associated alveolar epithelium during tumour progression 7,22. Transformed alveolar cells endow tumours with a highly metastatic capacity, typical of the basal TNBC subtype. As a differentiated subtype, cell-intrinsically properties of alveolar tumours would generally indicate better outcomes 90. Alveolar cells however, are centrally involved in cell-to-cell interactions (Fig. 8.) and orchestrate an intense deregulation of the TME activating metastatic cues, specifically through communication with CAFs and tumour infiltrated myeloid cells. We have previously shown that Elf5-driven alveolar tumours presented enhanced cancer immunotolerance, vascular leakiness and angiogenesis, which in turn produced a dramatic increase of metastasis, similar to that induced by pregnancy 38. Our scRNAseq study reveals that cells with a transcriptional profile consistent with an alveolar cell identity are present in the wild-type PyMT tumours, although at a very low frequency (1.2%). Nevertheless the blueprint of these cells are highly represented within the LP transcriptional pool, suggesting that tumours are well equipped to stimulate a clonal expansion of alveolar cells upon the right selective conditions. This has profound therapeutic implications, in the clinical setting; patients with luminal tumours receive standard-of-care anti-estrogen therapy. In this context, an endorsed alveolar fate does represent a route of escape from endocrine therapy, as these cells are insensitive to estrogen 37, subsequently giving rise to an alveolar (basal) TNBC tumour 37 with much poorer survival rate 38. As such, Elf5 expression is associated with the Basal subtype 37, and is a poor prognostic factor in Luminal A breast cancer patients 38.
Despite reducing a patient’s lifetime risk of developing breast cancer 35,91-93, pregnancy has been shown to produce a transitory short-term increased risk in the following 5 years after pregnancy. However, there are still contrasting reports on the protective or non-protective effect of pregnancy in breast cancer, which is due in part to the poor knowledge of the molecular mechanisms involved in pregnancy-associated breast cancer (PABC). Our Elf5 MMTV-PyMT model represents much of the molecular and cellular mechanisms that are induced during pregnancy as we are able to reorganise the mammary gland hierarchy by forcing the differentiation of the alveolar epithelium. The resultant tumours recapitulate many of the features characteristic of PABC 38, and has been an invaluable model for studying the underlying molecular mechanisms associated with this aggressive type of breast cancer.
Our simultaneous observation of cancer cells and cells from the TME, has allowed us to uncover multicellular mechanism of cancer spread as a consequence of an aberrant mammary involution program. We demonstrate that Elf5 CAFs have transcriptomic and biological features of involution CAFs, and patients with high-levels of Elf5 expression that present with an involution signature have a poorer outcome. Taken together, these suggest that the pro-metastatic effects of Elf5 are driven by a mimicry involution process. In this line of evidence, involution has been previously shown to be involved in PABC 36 however the molecular drivers of this process have not been not fully identified. Mammary involution is a wound-healing like process that accounts for two different stages 1) Alveolar Cell apoptosis induced by milk stasis and 2) Tissue remodelling with fibroblast activation to reorganise the ECM and accommodate the cellular branching reduction and myeloid infiltration to remove all apoptotic bodies 1,30. Our data presented here support the hypothesis that the chronic Elf5-forced expression induces the production of milk by alveolar cells, in a tumour, milk protein accumulation triggers the involution cascade. This mimicry involution process results in alveolar apoptosis that is rapidly restored by Elf5-driven differentiation of luminal progenitors and a chronic induction of inflammation by involution iCAFs and myeloid cells (hallmark of cancer) encompassed by ECM remodelling driven by involuting ECM-CAFs (Fig 8E).
Our scRNAseq analyses have also allowed us to identify putative molecular candidates responsible of this epithelium-fibroblast-myeloid crosstalk during mimicry involution (Fig 8). For example, we find that only alveolar epithelial cells express TGFβ2 and 3 ligands and their receptor TFGβR3 is expressed in involution CAFs. TGFβ is linked to tumour malignancy by affecting both cancer cells and the TME, including CAF activation and immune suppression 76 suggesting that this could be a specific pathway driving mimicry involution. In fact, TGFβ3 is induced in response to milk stasis during the first stage of involution for the induction of alveolar apoptosis and TGFβ signalling is also key in the second stages of normal involution for the induction of ECM deposition and immune suppression 77. Altogether, this suggests that TGFβ signalling might be one of the pivotal pathways triggered by Elf5-alveolar cells and thus a potent pathway to be therapeutically targeted.
We also find specific pathways of crosstalk among involution CAFs, other CAF-types and the tumour-infiltrating immune system, which might be activated following this Elf5-mediated TGFβ activation. These include the expression of Cxcl12 by the involution iCAFs and IGF1 from both ECM and inflammatory involution CAFs. Cxcl12 is a stromal chemokine that attracts leukocytes through CXCR4 94 and enhances cell adhesion, survival through ACKR3 95, these receptors are expressed in T/B cells and iCAFs, respectively. Interestingly, involuting mammary fibroblasts that highly express Cxcl12 induce monocyte recruitment and are associated with blockade of CD8+ T cell tumor infiltration 96. Cxcl12 is also a known recruitment factor for MDSCs 81. In this context, CAFs also show high expression of other classical markers for MDSC recruitment and activation, including M-CSF, IL-6 and Ccl2 81 underpinning the high infiltration and activation of MDSCs previously described in Elf5-high tumours 38. Dpp4 is a ligand from one of the iCAFs groups that could also build the communication bridge between Cxcl12-expressing involution iCAFs and Cxcl2 and Cxcl10-expressing myeloid cells. Dpp4 cleaves and inactivates these chemokines promoting an immunosuppressive environment by the inhibition the recruitment effector T cells 97 and by the promotion of chronic inflammation 98. This suggests the M1-innate response from myeloid cells and fibroblasts is inhibited by Dpp4-expressing iCAFs. In addition, Costa and colleagues recently demonstrated that a subtype of CAF from human breast tumours was responsible for the increase of regulatory T cells through the expression of Dpp4 78, so the involvement of Tregs in Elf5-mediated immunosuppression might be another area to further explore. Thus, our data suggest that most of the immunosuppressive signals come from the presence of activated MDSCs in the tumour, that the main “attractor” of these immunosuppressive cells are involution CAFs that have been activated by mimicry involution signaling by alveolar cells.
Altogether our data illustrates a highly interactive TME, particularly with CAFs and myeloid cells, with cancer-differentiated cells that are pivotal initiating the events that result in tumour tolerance and metastasis as a consequence of mimicry involution. Our data highlights the relevance of targeting cancer-associated cell species as a strategy for anticancer therapy, an approach particularly important in the context of PABC.
5. Acknowledgments
We thank Dr Marina Pajic and Dr Christine Chaffer from the Garvan Institute for their review and feedback on the manuscript. This work is supported by Cancer Institute NSW Career Development Fellowship (DG00625) and Cancer Council NSW project grant (RG18-03) to DGO; National Breast Cancer Foundation postdoctoral fellowship (2013-2018, PF-13-11) and Cancer Institute NSW Career Development Fellowship (2019-2021, CDF181218) to FVM; and the National Health and Medical Research Council project grant (NHMRC 1068753) to CJO; Australian Government Research Training Program (RTP) Scholarship to AMKL and UNSW Sydney University Tuition Fee Scholarship (TFS) to YCS.
7. References
- 1.↵
- 2.↵
- 3.↵
- 4.↵
- 5.↵
- 6.
- 7.↵
- 8.
- 9.
- 10.↵
- 11.↵
- 12.↵
- 13.↵
- 14.
- 15.
- 16.↵
- 17.↵
- 18.
- 19.
- 20.
- 21.↵
- 22.↵
- 23.↵
- 24.↵
- 25.
- 26.↵
- 27.↵
- 28.
- 29.↵
- 30.↵
- 31.↵
- 32.↵
- 33.↵
- 34.↵
- 35.↵
- 36.↵
- 37.↵
- 38.↵
- 39.↵
- 40.↵
- 41.↵
- 42.↵
- 43.↵
- 44.↵
- 45.↵
- 46.↵
- 47.↵
- 48.↵
- 49.↵
- 50.↵
- 51.↵
- 52.↵
- 53.↵
- 54.↵
- 55.↵
- 56.↵
- 57.↵
- 58.↵
- 59.↵
- 60.↵
- 61.↵
- 62.↵
- 63.↵
- 64.↵
- 65.↵
- 66.↵
- 67.↵
- 68.↵
- 69.↵
- 70.↵
- 71.↵
- 72.↵
- 73.↵
- 74.↵
- 75.↵
- 76.↵
- 77.↵
- 78.↵
- 79.↵
- 80.↵
- 81.↵
- 82.↵
- 83.↵
- 84.↵
- 85.↵
- 86.↵
- 87.↵
- 88.↵
- 89.↵
- 90.↵
- 91.↵
- 92.
- 93.↵
- 94.↵
- 95.↵
- 96.↵
- 97.↵
- 98.↵


