

Abstract
Recycling of wood ash from energy production may counteract soil acidification and return essential nutrients to soils. However, wood ash amendment affects soil physicochemical parameters that control composition and functional expression of the soil microbial community. Here, we applied Total RNA-sequencing to simultaneously assess the impact of wood ash amendment on the active soil microbial communities and the expression of functional genes from all microbial taxa. Wood ash significantly affected the taxonomic (rRNA) as well as functional (mRNA) profiles of both agricultural and forest soil. Increase in pH, electrical conductivity, dissolved organic carbon and phosphate were the most important physicochemical drivers for the observed changes. Wood ash amendment increased the relative abundance of the copiotrophic groups Chitinonophagaceae (Bacteroidetes) and Rhizobiales (Alphaproteobacteria) and resulted in higher expression of genes involved in metabolism and cell growth. Finally, Total RNA-sequencing allowed us to show that some groups of bacterial feeding protozoa increased concomitantly to the enhanced bacterial growth, which shows their pivotal role in the regulation of bacterial abundance in soil.
1. Introduction
Wood ash from energy production is often considered a waste product (Vance, 1996; Demeyer et al., 2001) despite that recycling of wood ash may have beneficial effects as it counteracts acidification and returns essential nutrients to soil (Demeyer et al., 2001; Augusto et al., 2008). Wood combustion is becoming more popular in several countries and increased reuse of wood ash as soil amendment holds the potential to improve the sustainability of this practice (Karltun et al., 2008; Huotari et al., 2015). However, wood ash application affects several soil physicochemical parameters important to the structure and function of microbial communities; e.g. pH, electrical conductivity and dissolved organic carbon (DOC), (Ohno & Susan Erich, 1990; Demeyer et al., 2001; Pitman, 2006; Augusto et al., 2008; Maresca et al., 2017; Hansen et al., 2017). As the soil micro-biota carries out an array of key biochemical processes (Blagodatskaya & Kuzyakov, 2013), knowledge of its response to disturbance is important; not least in production soils due to potential impact on soil fertility.
The soil micro-biome, which includes prokaryotes as well as micro-eukaryotes, is one of the most diverse and complex biomes on Earth. It has a pivotal role in nutrient cycling and carbon sequestration and is a key component in the maintenance of soil fertility of managed ecosystems (Wall et al., 2012; Fierer, 2017). Wood ash amendment causes changes in soil micro-biome composition, activity and quantity (Perkiömäki & Fritze, 2002; Aronsson & Ekelund, 2004; Huotari et al., 2015). Ash amendment induces changes in community structure followed by increased microbial activity and growth, which is usually explained by the increased soil pH brought about by the alkaline oxides in the ash (Cruz-Paredes et al., 2017; Vestergård et al., 2018). Still, some studies show no or only minor microbial response to wood ash application (Aronsson et al. 2004; Huotari et al. 2015). Only few studies have concomitantly analysed microorganisms from all domains of life (i.e. Archaea, Bacteria, Eukaryotes) and most of these rely on cultivation, model organisms or molecular fingerprinting, which only provide limited resolution of taxonomical and functional responses. Total RNA-sequencing, or metatranscriptomics, makes it possible to investigate active soil microbial communities from all domains of life, incl. their transcriptional activity, simultaneously. Because total RNA-sequencing allows for the study of immediate regulatory responses to environmental changes (Carvalhais et al., 2012), it has also proven useful in the assessment of active microbial communities’ functional roles in soil (Urich et al., 2008; Hultman et al., 2015; Epelde et al., 2015; Geisen et al., 2015; Schostag et al., 2019).
We therefore aimed to investigate how the active soil prokaryotic and micro-eukaryotic communities in agricultural and forest soil responded structurally and functionally (transcriptional) to wood ash application. Both soil types are relevant for large scale application of wood ash. We applied wood ash in concentrations corresponding to field application of 0, 3, 12 and 90 t ha−1, where 3 t ha−1 is the currently allowed dose in Scandinavian countries. We expected wood ash to increase soil pH, electrical conductivity and dissolved organic carbon and therefore hypothesised that (I) the pH increase would favour bacteria more than fungi, (II) the nutrients in the wood ash would benefit the copiotrophic microbial groups, (III) multitrophic responses would appear gradually over time after wood ash application, and (IV) that microbial stress responses would be observable in the transcriptome.
2. Materials & Methods
2.1. Soils and wood ash
We used two contrasting soils for the experiment. The first was a loamy sand (Typic Hapludult) from the plough layer (0-10 cm) of an agricultural field (Research Center Foulum, DK, 56°29’42”N 9°33’36”E). The other was from the O-horizon (0-10 cm) of a forest (Gedhus, DK, 56°16’38”N 09°05’12”E). The forest is a second-generation Norway spruce stand (Picea abies (L.) Karst.) on Podzol heathland. Qin et al. (2017) provide soil characteristics for both soils. On both sites, we removed visible plant parts before taking ten 100 g soil samples within a 30 m2 area. The 10 samples from each site were sieved (4 mm), pooled and stored in the dark at 4 °C until further processing.
Wood ash was a mixture of bottom-and fly-ash from a heating plant (Brande, Denmark) produced by combustion of wood chips from predominantly coniferous trees. We homogenized the ash by sieving (2 mm). Maresca et al. (2017) provide a list of mineral nutrients and heavy metals in the ash.
2.2. Microcosm set-up and incubation
We prepared microcosms in triplicates of 50 g soil in 250 ml sterilised airtight glass jars. We mixed the ash thoroughly with soil to ash concentrations corresponding to field application of 0, 3, 12 and 90 t ash ha−1. The water content was adjusted to 50 % of the water holding capacity of the two soils. We prepared 12 microcosms for each soil-ash combination to allow four destructive samplings; i.e. a total of 96 microcosms. Samples were also collected at the start of the experiment. Microcosms were incubated at 10 °C in the dark and all microcosms were opened once a week inside a LAF-bench to maintain aerobic conditions.
2.3. Physicochemical soil parameters
At destructive sampling, after 3, 10, 30 and 100 days of incubation, we prepared soil extracts from 15 g soil and 75 ml sterile ddH2O followed by 1 h shaking and settling for 0.5 h. In the supernatant, we measured electrical conductivity using a TetraCon 325 electrode adapted to a conductivity meter Cond 340i (WTW, Weilheim, Germany) and pH using a pH electrode (Sentix Mic) connected to pH meter Multi 9310 (WTW). The remaining supernatant was filtered (5C filters, Advantec, Tokyo, Japan; 1 μm pore size) and analysed for dissolved organic carbon (DOC), nitrate (NO3−), ammonium (NH4+) and phosphate (PO43-). DOC concentrations were determined on a TOC-5000A (Shimadzu, Kyoto, Japan). Nitrate, ammonium and phosphate concentrations were determined by flow injection analysis (FIAstar™ 5000, FOSS, Hillerød, Denmark) following manufacturer’s instructions.
2.4. Nucleic acid extraction, qPCR and library preparation for sequencing
RNA and DNA were co-extracted from 2 g soil samples using the RNA PowerSoil Total RNA Isolation Kit (MOBIO, Carlsbad, USA) in combination with DNA Elution Accessory Kit (MOBIO) following manufacturer’s protocol. Agricultural soil amended with the highest ash concentration had an RNA yield below detection limit and was not sequenced.
We quantified 16S rRNA and ITS2 gene copies (DNA level) using qPCR. 16S rRNA genes were amplified in technical duplicates using a CFX Connect (Bio-Rad, Richmond, USA). We used a dilution series of genomic DNA from Escherichia coli K-12 (with 7 copies of 16S rRNA genes) as a standard (Blattner et al., 1997). The master-mix consisted of 2 µl bovine serum albumin (BSA) (20mg/ml; BIORON, Ludwigshafen, Germany), 10 µl SsoFast EvaGreen Supermix (Bio-Rad), 0.8 μl of primer 341f (5′-CCTAYGGGRBGCASCAG-3′), 0.8 μl of primer 806r (5′-GGACTACNNGGGTATCTAAT-3′) (Hansen et al., 2012); 1 μl of 10× diluted template, and 5.4 µl sterile DEPC-treated water. PCR conditions for 16S rRNA gene amplification were 98°C for 15 min, followed by 35 cycles of 98°C for 30 s, 56°C for 30 s, and 72°C for 30 s (with fluorescence measurements) and ending with 72°C for 7 min and production of melt curves. The PCR efficiencies for the 16S assays were 96.1±1.0% (SEM, n=3) with R2 = 0.99±0.001. ITS gene copies were quantified as described for the 16S rRNA above with minor modifications: Vector cloned ITS2 DNA regions from Aureobasidium pullulans were included as standards, primers used were gITS7 (5′-GTGARTCATCGARTCTTTG-3′ (Ihrmark et al., 2012)) and ITS4 (5′-TCCTCCGCTTATTGATATGC-3′ (White et al., 1990)), annealing temperature was 60 °C and 40 amplification cycles were used. The PCR efficiencies for the ITS assays were 106.0±4.6% with R2 = 0.99±0.003.
Prior to Total RNA library building, we removed potential DNA carryovers using the DNase Max Kit (MOBIO) following manufacturer’s protocol. Successful DNA removal of RNA extracts were tested with the 16S qPCR protocol described above but with 50 amplification cycles: All DNase treated RNA extracts had higher or equal Cq values than the negative samples (sterile DEPC-treated water as template) and DNA was thereby not present.
Quality of the DNase treated RNA was tested using RNA 6000 Nano Kit (Agilent, Santa Clara, USA) on a 2100 Bioanalyzer System (Agilent) following manufacturer’s protocol (Average RIN number was 7.85±0.13 (SEM, n=69)
Subsequently, DNase treated RNA extracts from time points 0, 3, 30 and 100 days were fragmented into ∼150 bp segments and prepared for sequencing using the NEBNext Ultra Directional RNA Library Prep Kit for Illumina in combination with the NEBNext Multiplex Oligos for Illumina (New England BioLabs, Ipswich, USA) according to the manufacturer’s protocol. We sequenced the resulting metatranscriptome libraries using HiSeq 2500 (Illumina Inc., San Diego, USA) in high output mode (8 HiSeq lanes, 125bp, paired end reads) at the National High-throughput DNA Sequencing Centre (Copenhagen, Denmark).
2.5. Bioinformatic processing
We obtained a total of 3.3 billion paired sequences (SRA accession number: PRJNA512608) and processed them through the following bioinformatic pipeline. Adapters, poly-A tails, sequences shorter than 60 nt and nucleotides with phred score below 20 at the 5’ and 3’ end of sequences were removed using Cutadapt v.1.9.1 (Martin, 2011). Five samples were removed prior to subsequent processing due to low quality of reads (one replicate of 3 t ha−1, day 100 from the agricultural soil and two replicates of 0 t ha−1, day 0 and two replicates 0 t ha−1, day 100 from the forest soil). Sequences were then sorted into small subunit (SSU) rRNA, large subunit (LSU) rRNA and non-rRNA sequences using SortMeRNA v.2.1 (Kopylova et al., 2012).
2.5.1. rRNA
A subset of 1.5 million randomly chosen SSU rRNA sequences per sample were assembled into longer SSU rRNA contigs using EMIRGE (Miller et al., 2011). Contigs were taxonomically classified using CREST (Lanzén et al., 2012) and rRNA reads were mapped to resulting EMIRGE contigs using BWA (Li & Durbin, 2009), as in Epelde et al. (2015), resulting in a table of taxonomically annotated read abundance across samples (Supplementary Datasheet 1).
2.5.2. mRNA
A combined pool of non-ribosomal sequences from all samples was assembled using trinity v.2.0.6 (Grabherr et al., 2011). From the resulting assembled contigs, non-coding RNA contigs were filtered away by aligning contigs to the Rfam database v.12.0 (Nawrocki et al., 2015) using cmsearch v.1.1.1 with a significant e-value threshold of <10−3. Input sequences used for non-ribosomal RNA assembly were then mapped to coding mRNA contigs. We normalized the contigs by removing those with relative expression lower than 1 out of the number of sequences in the dataset with least number of sequences. EMBOSS (Rice et al., 2000) was used to search six possible open reading frames (ORFs) of the contigs. SWORD (Vaser et al., 2016) was used to align ORFs against the Md5nr protein database (Wilke et al., 2012). The output was then parsed with custom Python scripts and filtered hits with minimum e-value of 10−5 as threshold. Best hit for each contig was then selected based on alignment statistics and annotated against the eggnog hierarchical database v.4.5 (Jensen et al., 2008). The output was an abundance table of numbers of sequences assigned to groups of different functional genes (COGs) (Supplementary Datasheet 2).
2.6. Statistical analysis and data processing
Statistical validation for both taxonomy and functional abundance was done in R v.3.4.0 (R Core Team, 2015) using vegan (Oksanen et al., 2008). The rRNA abundance was converted into relative abundance and collapsed taxonomically into Archaea, Bacteria and Eukaryota. We further grouped Eukaryota into Fungi, Metazoa, and protists (with main focus on bacterivorous protozoa). We calculated Richness and Shannon diversity on the total number of rRNA contigs and abundance of sequence reads mapped to them. Non-metric multidimensional scaling (NMDS) was carried out using Bray-Curtis dissimilarities of community composition between samples. Soil physicochemical parameters were fitted to the resulting NMDS using the function envfit. Variables explaining overall differences in community composition were evaluated using the function Adonis, which performs permutational analysis of variance (PERMANOVA; 10,000 permutations) using Bray-Curtis dissimilarities as response variable. A forward selection strategy was carried out to only include explanatory variables with significant p-values in Adonis models.
Significant effects of wood ash amendment and incubation time on taxonomic groups were determined using non-parametric Kruskal-Wallis tests (due to the non-normal distribution of taxon abundances). To separate the pronounced changes in community responses observed at the 90 t ha−1 amendment in the forest soil from the less pronounced changes observed at 0-12 t ha−1, we performed Kruskal-Wallis tests with wood ash concentration as independent variable for both the range of 0-12 t ha−1 and 0-90 t ha−1. We also used Kruskal-Wallis to test the effect of time on differential abundances within the wood ash concentrations separately. P-values were adjusted for false discovery rate (FDR) using the Benjamini–Hochberg method in all tests. NMDS on Bray Curtis dissimilarities of gene compositions and Adonis testing were carried out as described above. Gene counts between samples were normalized using the DESeq2 algorithm (Love et al., 2014). Significantly differentially expressed genes were analysed using the DESeq2 module of SARTools (Varet et al., 2016). These analyses were conducted by pairwise comparisons of gene transcription levels between samples of increasing wood ash concentration to control samples (0t ha−1) at different incubation times. For the forest samples at time 100 days, only one replicate remained for the 0 t ha−1 treatment. Therefore we compared instead the 12 and 90 t ha−1 to the 3 t ha−1.
We used linear Pearson regression to test for significant correlations between wood ash concentration and time against measured physicochemical parameters. Additionally, we performed two-way ANOVAs with Tukey’s post-hoc tests using wood ash concentration and time as explanatory variables, with all physicochemical parameters as dependent variables. Variance homogeneity was tested using Levenes’s test and normal distribution of data was tested using the Shapiro-Wilk test in combination with QQ-plots prior to ANOVA tests.
We used a significance level of 0.05, unless otherwise explicitly mentioned, and the results section provide descriptions at this significance level.
3. Results
3.1. Physicochemical parameters
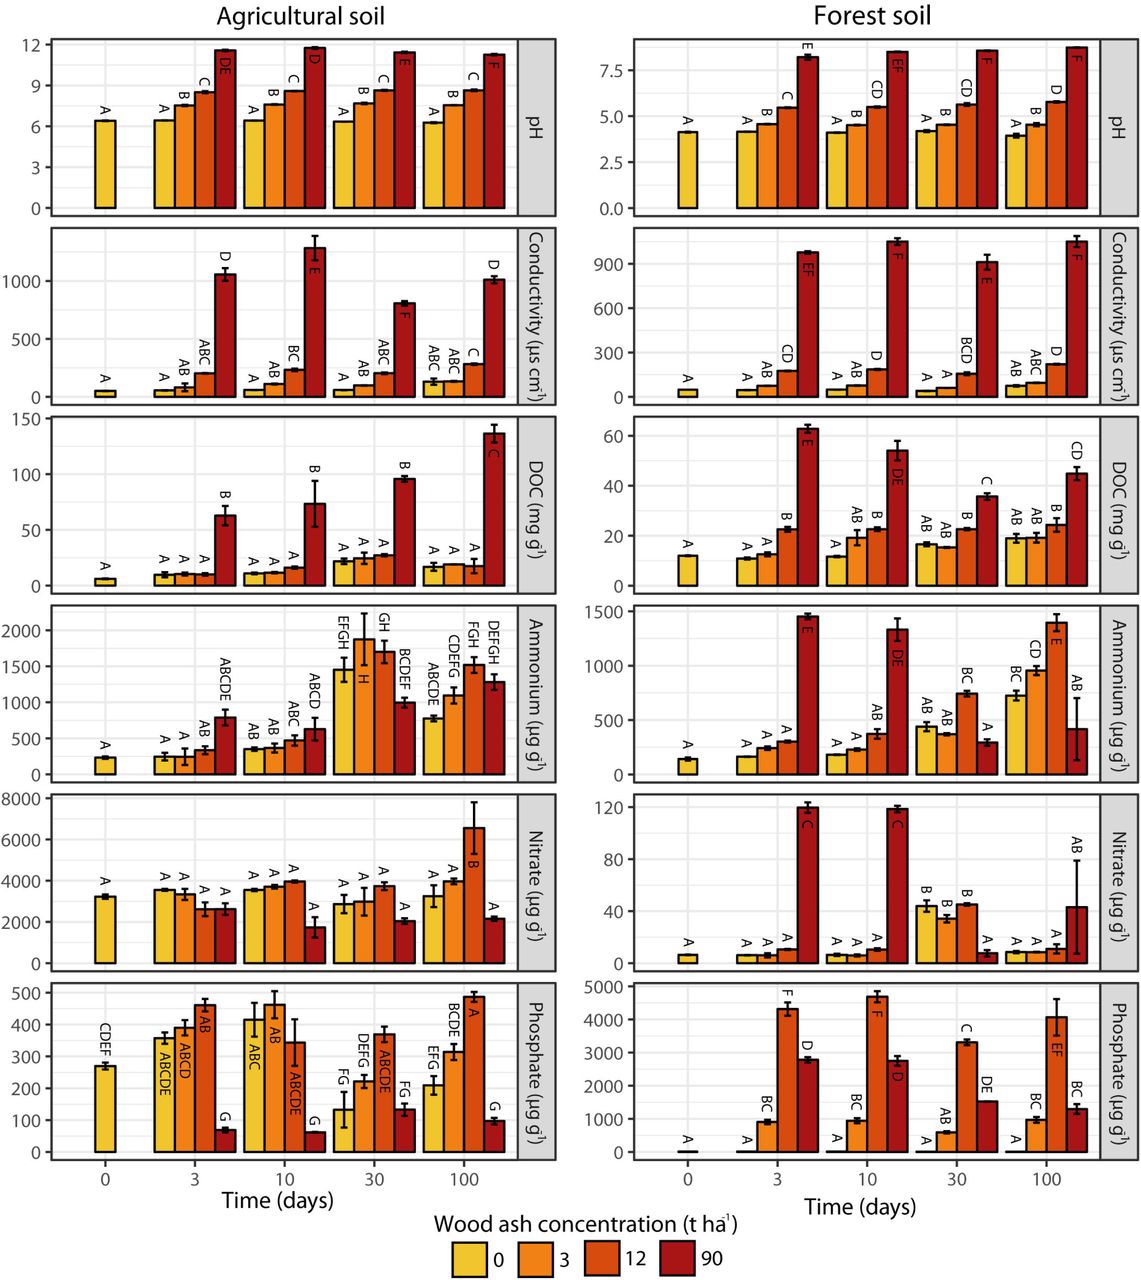
Soil pH, electrical conductivity and DOC correlated positively with wood ash concentration for both soils (Table 1). For the 90 t ha−1 ash amendment, soil pH increased from 6.4 to 11.5 in the agricultural and from 4.1 to 8.5 in the forest soil (Supplementary Figure 1). Similarly, the 90 t ha−1 resulted in 15 and 19-fold increases in electrical conductivity for the agricultural and forest soil, respectively. In the agricultural soil, ammonium increased with time in samples both with and without ash amendment, while nitrate showed no significant changes. In the forest soil, ammonium and nitrate increased after 3 days in the 90 t ha−1 amendment, followed by a decrease after 30 days. In the other treatments, increased concentrations were observed during the entire incubation period. In both soils, concentrations of dissolved phosphate increased up to 12 t ash ha−1 followed by a decrease at 90 t ha−1.

Pearson correlation values (r) and associated significance levels between ash dose (field equivalents 0, 3, 12 and 90 t ha-1) and incubation time, and soil physicochemical parameters.
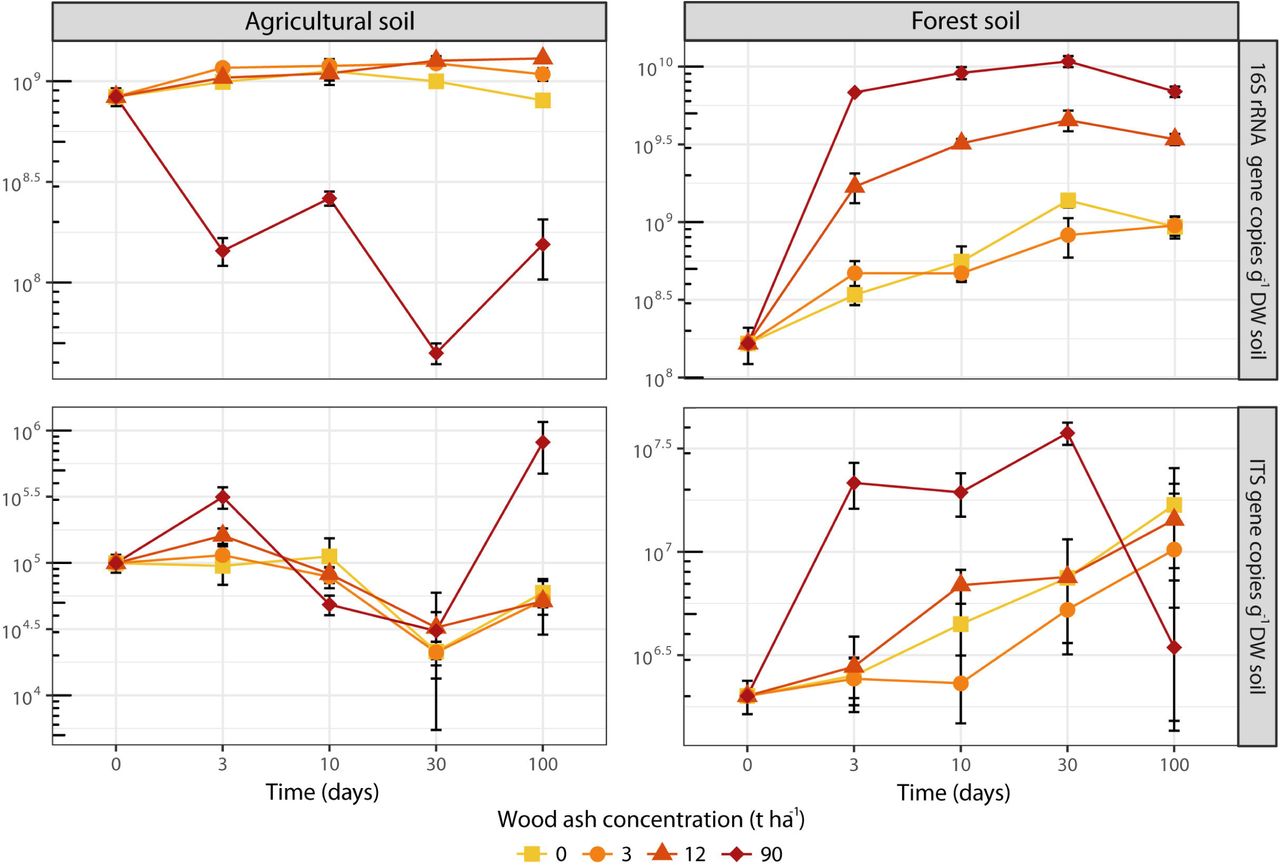
3.2. Quantitative PCR
Prokaryotic abundance (number of 16S rRNA gene copies) increased in the agricultural soil after the wood ash application of 12 t ha−1, but decreased after application of 90 t ha−1 (Figure 1). Fungal abundance (number of ITS copies) remained fairly unchanged over time regardless of ash application with the exception of an increase after 100 days at 90 t ha−1. In the forest soil prokaryotic abundance increased over time for all treatments (Figure 1); however, addition of 12 and 90 t ha−1 resulted in a stronger increase. The fungal abundance in the forest soil showed higher abundance for most of the period with wood ash concentrations of 90 t ha−1.
3.3. rRNA - Community composition
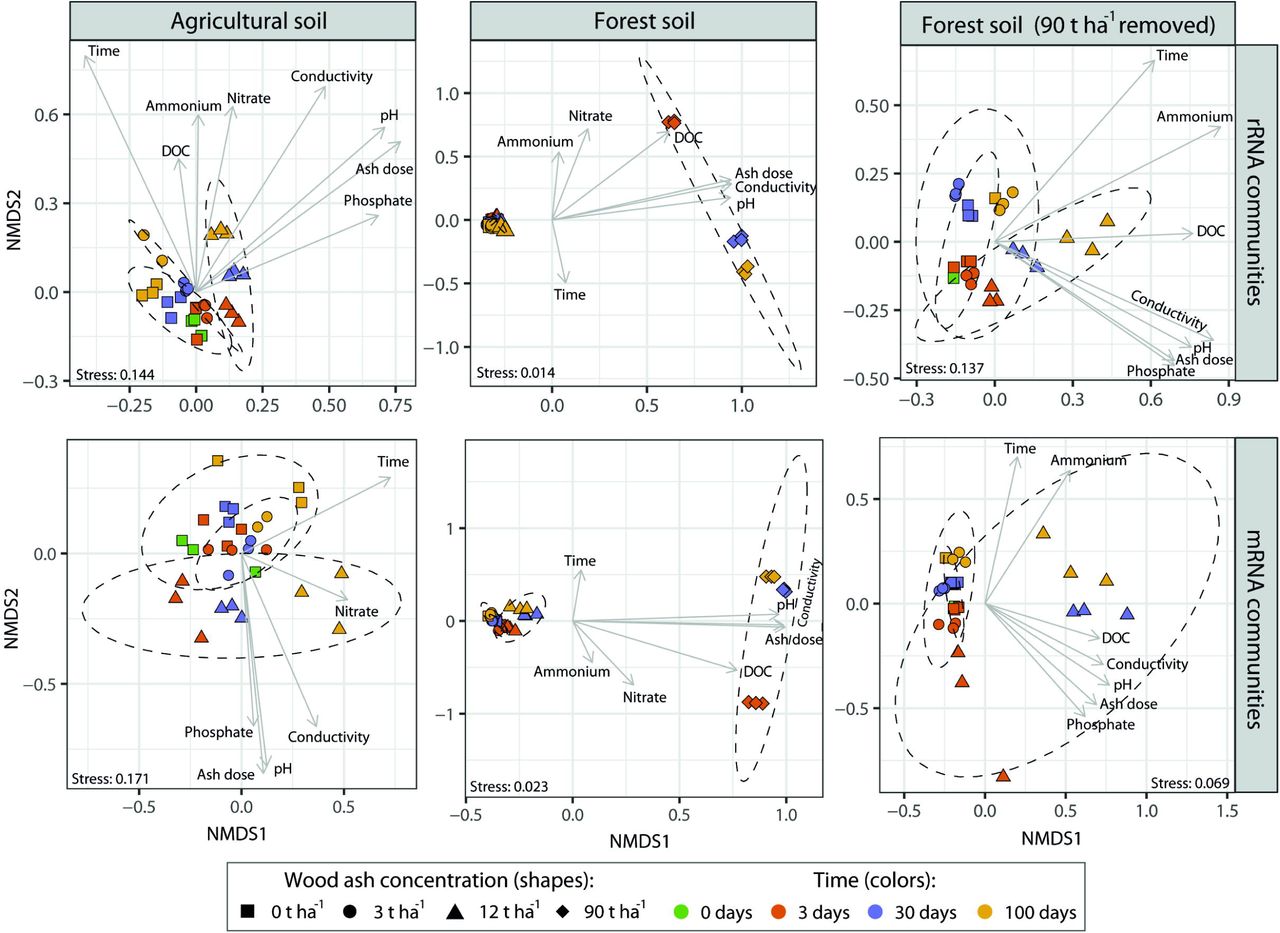
The number of unique rRNA contigs ranged from 1,216 – 5,931 per sample and originated from all domains of life. Community composition differed significantly (p < 0.001; R2 = 0.86; Adonis) between the two soil types. For forest soil, amendment with 90 t ha−1 resulted in highly altered community composition (Figure 2) compared to 0-12 t ha−1. Though less pronounced, changes from 0-3-12 t ha−1 were also clearly visible for both soil types (Figure 2). Moreover, microcosms for particular soil type/ash dose combinations were clearly separated by sampling times (Figure 2).

In both soils, wood ash dose, incubation time, pH and electrical conductivity correlated to the transformed NMDS community space (Figure 2). Optimized Adonis models (Table 2) supported that wood ash concentration, time, pH, and electrical conductivity together significantly explained the variation in microbial communities after ash application in both soils. Additionally, dissolved phosphate significantly explained the variation in microbial communities in both soils up to 12 t ha−1 ash amendments and DOC, ammonium and nitrate in the forest soil.
Explanatory strength of physiochemical variables on rRNA and mRNA dissimilarity profiles of the two soils after ash amendment tested using Permutational Multivariate Analysis Of Variance (Adonis)
3.4. rRNA – Taxonomic distribution and diversity
A majority (85%) of sequence reads, mapped to contigs, could be annotated to order rank (99% to phylum and 97% to class rank) (Figure 3A). Fewer sequences could be assigned lower taxonomic ranks (60% and 27% to family and genus level, respectively). Therefore, we evaluated possible significant differences in abundance of taxa at order level (see Supplementary Datasheet 3 and 4 for p-values and averages of relative abundances, respectively). Richness and Shannon diversity decreased in the unamended agricultural soil over time, while ash amendments of 3 and 12 t ha−1 counteracted this decrease (Figure 3B). In the forest soil these measures generally remained unchanged up to 12 t ha− 1 amendments (with a single exception of increased richness at 3 t ha−1 after 100 days of incubation), while the 90 t ha−1 amendment caused reduction of Shannon diversity.

3.4.1. Prokaryotic community
In both soil types, the relative abundance of Chitinophagaceae (Bacteroidetes) increased with wood ash application (Figure 3A). In the agricultural soil, ash-amendment also caused increases in Alphaproteobacteria and Betaproteobacteria. In the forest soil, the 3 and 12 t ha−1 ash-amendments increased Myxococcales (Deltaproteobacteria), while Acidimicrobiia (Actinobacteria) decreased.
In the forest soil, the 90 t ha−1 ash-amendment resulted in major prokaryotic community changes. Actinobacteria, Acidobacteria, Armatimonadetes, and Verrucomicrobia decreased, while Firmicutes, Bacteroidetes and Proteobacteria increased. Firmicutes dominated after 3 days, with Paenibacillus as most abundant with relative abundance of 21.3%, followed by a gradual decrease towards 1.1% after 100 days. Similarly, Gammaproteobacteria decreased during incubation after an initial increase. Chitinophagaceae and Rhizobiales (Alphaproteobacteria) showed the opposite temporal trend and were most abundant after100 days.
3.4.2. Fungal community
The 3 and 12 t ha−1 ash amendments did not affect fungal community composition in the agricultural soil (Figure 3A). In the forest soil no major changes were found at low amendments, while application of 90 t ha−1 resulted in increase in Mortierella, Hypocreales (Sordariomycetes) and Peziza (Pezizomycetes).
3.4.3. Micro-eukaryotic community
In the agricultural soil, the relative abundances of Tubulinea (Amoebozoa), Thaumatomonadida (Cercozoa) and Silicofilosea (Cercozoa) increased over time in all treatments (Figure 3A). In the forest soil, Colpoda (Ciliophora) increased with time in all treatments, though more pronounced at higher wood ash amendments. Further, Tubulinea (Amoebozoa), Heteromitidae (Cercozoa) and Silicofilosea (Cercozoa) increased in the 12 and 90 t ha−1 amendments.
3.5. mRNA - Functional genes
A total of 0.9 million sequences were mapped to 463 mRNA contigs (Supplementary Figure 2 and Supplementary Datasheet 2). The two soils possessed distinct pools of expressed genes (p < 0.001; R2 = 0.82; Adonis). Overall, Bray-Curtis dissimilarities, based on mRNA profiles, and fitting of physicochemical parameters to these, revealed similar trends as for rRNA taxonomic communities (Figure 2 and Table 2).

In the agricultural soil, we observed only minor functional gene responses to time and ash-amendment, while more genes were differentially expressed in the forest soil, especially at the 90 t ha−1 amendment (Figure 4; full list of differential expressed genes in Supplementary Datasheet 5). Of the well characterized genes, four functional categories contained most of the differentially expressed genes; i.e. “Post-translation modification, protein turnover, and chaperones”, “Transcription”, “Replication, recombination and repair” and “Carbohydrate transport and metabolism”. Furthermore, genes related to stress responses increased mainly in the forest soil at 90 t ha−1 ash amendments (Supplementary Figure 3).


4. Discussion
Here, we present the first detailed analysis of changes in soil microbial prokaryotic and eukaryotic communities after amendment with ash using the Total RNA-sequencing procedure.
4.1. Bacterial responses to wood ash application
The general copiotrophic groups of bacteria, i.e. Bacteroidetes, Alphaproteobacteria and Betaproteobacteria were stimulated by wood ash application. Members of Bacteroidetes benefit from wood ash application (Noyce et al., 2016; Bang-Andreasen et al., 2017); they are initial metabolizers of labile carbon and respond positively to increased soil pH and electrical conductivity (Fierer et al., 2007; Lauber et al., 2009; Kim et al., 2016). Alpha- and Betaproteobacteria are also generally copiotrophic (Fierer et al., 2007; Cleveland et al., 2007); Betaproteobacteria thrive in soils with higher pH (Kim et al., 2016), whereas Alphaproteobacteria are favoured at high N availability (Nemergut et al., 2010; Fierer et al., 2012).
Acidobacteria and Verrucomicrobia declined after the 90 t ha−1 amendment to the forest soil. These phyla are considered oligotrophic (Fierer et al., 2007; Bergmann et al., 2011; Ramirez et al., 2012; Cederlund et al., 2014; Kielak et al., 2016) and Acidobacteria are generally most abundant under acidic conditions (Rousk et al., 2010; Kielak et al., 2016). Thus, increases in pH, bioavailable DOC and nutrients induced by wood-ash allow copiotrophic groups to thrive on the expense of oligotrophic groups. The shift towards a more copiotrophic dominated community after ash amendment was further supported by the mRNA profile of the soil. Here, an increasing number of functional genes involved in metabolism and cell growth (“Translation”, “Transcription” and “Replication”) showed significant higher transcription levels.
Of the Bacteroidetes, Chitinonophagaceae showed the strongest positive response to wood ash application. Members of this family can degrade a broad spectrum of carbon compounds (Kämpfer et al., 2006; Hanada et al., 2014). Thus, they are well suited for the ash-induced increased DOC availability. Rhizobiales dominated the increasing Alphaproteobacterial fraction of the forest soil after ash amendment. They are copiotrophs (Starke et al., 2016; Lladó & Baldrian, 2017) and can degrade organic pollutants and cope with heavy metals (Teng et al., 2015). Probably advantageous properties, as the wood ash induces increase of heavy metals and nutrients in the soils. Deltaproteobacterial Myxococcales responded positively to wood ash amendment in the forest soil. Noteworthy, the increase in Myxococcales occurred late in the incubation where especially Chitinophagaceae and Alphaproteobacteria decreased. Myxococcales are ‘micropredators’ and attack and lyse other bacteria which might explain the increased dominance of this group on the expense of other bacterial groups (Reichenbach, 1999).
The increase in 16S rRNA gene copy numbers after ash amendment (up to 12 t ha−1 and 90 t ha−1 for the agricultural and forest soil, respectively) is consistent with other reports of increasing bacterial numbers after wood ash application (Bååth & Arnebrant, 1994; Fritze et al., 2000; Perkiömäki & Fritze, 2002; Bang-Andreasen et al., 2017; Vestergård et al., 2018). The large increase in the forest soil is further consistent with the increased pH as most bacteria thrive better at pH around 7 (Rousk et al., 2009). Prokaryotic growth as well as a change towards a more copiotrophic community with higher average 16S rRNA gene number per genome is likely causing the 16S rRNA gene copy increase (Klappenbach et al., 2000; Roller et al., 2016).
The 90 t ha−1 ash amendment to the forest soil caused immediate dominance of Firmicutes and Gammaproteobacteria. Both groups are copiotrophs that thrives upon addition of easily degradable carbon and nitrogen to soil which probably partly explain their success upon ash application (Fierer et al., 2007; Cleveland et al., 2007; Nemergut et al., 2010; Ramirez et al., 2012; Fierer et al., 2012). However, bacteria from these phyla are also known to be tolerant to heavy metals (Jacquiod et al., 2017). Moreover, within Firmicutes the endospore-forming genus Paenibacillus dominated (de Hoon et al., 2010), and we found increased transcription of genes involved in sporulation in these samples. Combined, these capabilities probably enable members of these groups to withstand the initial wood ash induced changes to the soil, including increased heavy metal concentrations, thereby allowing them to be initial utilizers of newly available labile resources. Reduced diversity at this ash dose further indicates that less organisms can cope with the ash induced changes to the soil system
4.2. Fungal responses to wood ash application
In both soil types, fungal response to ash amendment was slight compared to the prokaryotic response. Likewise, Cruz-Paredes et al. (2017), Högberg et al. (2007) and Rousk et al., (2009, 2011) found bacteria to be more stimulated by nutrient addition and increases in pH than fungi. Similarly effects of ash amendment have been reported by Noyce et al. (2016) and Mahmood et al. (2003). The 90 t ha−1 amendment in the forest soil caused increased ITS gene copy numbers and a fungal community shift with increased dominance of Mortierella, Peziza and Hypocreales. These fungi are opportunistic saprotrophs with high growth rates and can exploit readily availible nutrients before other fungi arrive (Carlile et al., 2001; Tedersoo et al., 2006; Druzhinina et al., 2012). Further, some Peziza spp. are early post-fire colonizers adapted to ash conditions (Egger, 1986; Rincón et al., 2014). The increase in these groups further supports that copiotrophic-like lifestyles are favoured by wood ash application.
4.3. Micro-eukaryote responses to wood ash application
The micro-eukaryotes also responded to wood ash application in the forest soil, probably because the stimulation of copiotrophic bacteria and fungi provided more food for nematodes and protozoa (Rønn et al., 2012). Ciliates (Colpoda), amoebae (Tubulinea) and small heterotrophic flagellates (Heteromitidae and Silicofilosea) increased with more pronounced responses at the later incubation times. Protozoa generally have longer generation times than prokaryotes, and thus need longer time to increase in population size. Further, they cannot start growth before a reasonable bacterial population has been formed (Fenchel, 1987; Ekelund et al., 2002). The protozoan increase may explain the small decrease in prokaryotic 16S rRNA gene copies at day 100, where we observed the largest fraction of protozoa. The positively responding protozoa were likely primarily bacterivorous (Ekelund & Rønn, 1994; Ekelund, 1998), consistent with the decreasing relative fraction of bacterial rRNA sequences and the increasing relative fraction of fungal and protozoan rRNA sequences in the later incubation times after the application of 12 and 90 t ha−1 ash. Thus, preferential protozoan grazing on bacteria can explain the relative larger rRNA-fraction of fungi and protozoa at day 100. We found no significant effect of ash-amendment on micro-eukaryotes in the agricultural soil, which is consistent with the relative minor effects on prokaryotes and fungi in this soil.
4.5. Stress responses at high wood ash amendments
We recorded increased transcription of stress-response genes at the 90 t ha−1 amendments, which supports that this high dose exerts harmful effects on many members of the micro-biome. For example, chaperones ensure correct folding of proteins and are involved in cellular coping with stress-induced denaturation of proteins (Feder & Hofmann, 1999) and the increase in transcription level of these probably is a stress response. Also, transmembrane transporter proteins balance osmotic pressure of cells, regulate cytosolic pH and can export toxins such as metals from the cell (Alberts et al., 2002; Ma et al., 2009; Wilkens, 2015). Increased activity of transmembrane transporters is probably a response to wood ash induced osmotic changes to the soil system, increased pH, metal concentration and other toxic compounds.
4.6. The changes in the microbial communities are linked to physicochemical soil parameters
We found that ash-amendment strongly increased soil pH, which is a strong driver of microbial community composition and functioning (Fierer & Jackson, 2006; Rousk et al., 2010) also after wood ash application (Frostegård et al., 1993; Zimmermann & Frey, 2002; Högberg et al., 2007; Peltoniemi et al., 2016; Bang-Andreasen et al., 2017). DOC and phosphate concomitantly increased. Several factors may contribute to this: (I) pH dependent changes in solubility (Evans et al., 2012; Maresca et al., 2017), (II) release from dead organisms incapable of coping with the wood ash or wood ash induced changes to the soil system, (III) increased mineralization rates after wood ash application (Bååth & Arnebrant, 1994; Vestergård et al., 2018) and (IV) the phosphorous in the bio-ash (Pitman, 2006; Maresca et al., 2017).
Since pH, conductivity, DOC and phosphate all correlated positively to wood ash concentrations it is difficult to disentangle the direct effect of these components as they might all be covariates of the wood ash amendments. pH-changes induce a cascade of effects in soil parameters and therefore affect mineral nutrient availability, salinity, metal solubility and organic C (Lauber et al., 2009). Many of the wood ash induced changes were likely caused directly or indirectly by the pH increase, which is probably the major reason that pH is an essential driver of taxonomic and functional soil characteristics (Lauber et al., 2009; Rousk et al., 2010; Fierer, 2017; Vestergård et al., 2018).
Wood ash contains virtually no nitrogen, hence measurable effects on soil nitrate and ammonium are probably caused by pH effects on microbial N mineralization (Vestergård et al., 2018) and ion solubility (Pitman, 2006). Changes in nitrate and ammonium were significant as explanatory variables on the observed rRNA and mRNA dissimilarity profiles of the forest soil but not in the agricultural soil. Forest soil is generally more N limited than agricultural soil, where N is kept at a high level through fertilization.
4.7. Conclusions
We used detailed total RNA-Sequencing to demonstrate drastic taxonomic and functional changes in the active prokaryotic and eukaryotic micro-biomes of agricultural and forest soil after wood ash amendment. Our analyses suggested that increase in pH, electrical conductivity, dissolved organic carbon and phosphate were the main drivers of the observed changes. Wood ash amendment of 3 and 12 t ha−1 resulted in increased prokaryotic abundance and dominance of copiotrophic groups and elevated expression of genes involved in metabolism and cell growth. Amendment of 90 t ha−1 caused collapse of the micro-biome in the agricultural soil, while in the forest the copiotrophic micro-biome, also including fast-growing saprotrophic fungi, was further stimulated. However, diversity was reduced, and expression of stress response genes increased. Bacterivorous protozoan groups increased as a response to enhanced bacterial growth, which supports that the protozoa have a pivotal role in controlling bacterial abundance in soil following wood ash application. Overall, prokaryotic community and quantity responded more pronounced to wood ash amendment than fungi in both forest and agricultural soil.
Conflict of Interest
The authors declare no conflict of interest.
Funding
This work was supported by the “Center for Bioenergy Recycling (ASHBACK)” project, funded by the Danish Council for Strategic Research (grant no 0603-00587B) and Danish Geocenter (grant no 5298507). AL was supported by a Juan de la Cierva scholarship from the Spanish Government. MZA was supported by the European Union’s Horizon 2020 research and innovation programme under the Marie Sklodowska-Curie project MicroArctic (grant no 675546). FE was supported by the Danish Council for Independent Research (DFF-4002-00274).
Acknowledgment
We thank Pia Bach Jakobsen for laboratory assistance.
References


