

Abstract
Serotonin (5-HT, 5-hydroxytryptamine) and other neuromodulators tune circuit activity to impart behavioral flexibility and adaptation. We demonstrate that Drosophila optic lobe neurons involved in the initial steps of visual processing are subject to serotonergic neuromodulation. The visual processing neurons L2 and T1 express 5-HT2B and 5-HT1-type receptors, respectively. Serotonin increases calcium in L2, but not T1 neurons, and serotonin potentiates the L2 neuron response to luminance increases. While we did not detect serotonin receptor expression in L1 neurons, they also undergo serotonin-induced calcium changes, likely through electrical coupling between L1 and L2 neurons. We also found that L2 and T1 form reciprocal synapses onto serotonergic projections in the medulla, forming a potential feedback loop. Together, these results describe a serotonergic microcircuit for regulating the first steps of visual processing in Drosophila.
Introduction
Behavioral flexibility requires dynamic changes in neural circuit function, which is often achieved by aminergic or peptidergic neuromodulatory signaling (Katz, 1999; Kupfermann, 1979; Marder, 2012; Marder et al., 2014; Nadim et al., 2014). Neuromodulators alter the biophysical and synaptic properties of individual neurons and circuits to shape behavior and to meet the animal’s changing needs (Katz, 1999; Kupfermann, 1979; Marder, 2012; Marder et al., 2014; Nadim et al., 2014). Serotonin acts a neuromodulator in a variety of circuits including the sensory systems required for olfaction, hearing, and vision (Andres et al., 2016; Arechiga et al., 1990; Brunert et al., 2016; Dacks et al., 2008; Fotowat et al., 2016; Kloppenburg et al., 1999; Lottem et al., 2016; Moreau et al., 2010; Papesh et al., 2016; Petzold et al., 2009; Seillier et al., 2017; Watakabe et al., 2009). In the mammalian visual cortex, serotonin regulates the balance of excitation and inhibition (Moreau et al., 2010), cellular plasticity (Gagolewicz et al., 2016; Gu et al., 1995; Lombaert et al., 2018; Wang et al., 1997), and response gain (Seillier et al., 2017; Shimegi et al., 2016). In the mammalian retina, serotonin signaling reduces GABAergic amacrine cell input to retinal ganglion cells (RGCs) via 5-HT1A (Zhou et al., 2018) and can modulate the response of RGCs to visual stimuli (Trakhtenberg et al., 2017). Multiple serotonin receptor subtypes are expressed in visual and other sensory systems; however, the manner in which serotonin receptor activation is integrated into sensory circuits to regulate information processing remains poorly understood.
The visual system of Drosophila melanogaster provides a powerful genetic model to study the mechanisms underlying visual circuit activity and regulation (Borst et al., 2015). In Drosophila, visual processing begins in the lamina where intrinsic monopolar neurons L1, L2, and L3 receive direct input from photoreceptors (Meinertzhagen et al., 1991). L1 and L2 neurons are first-order neurons that feed into pathways discriminating light “ON” (i.e., increase in luminance) and light “OFF” (i.e., decrease in luminance) stimuli respectively (Joesch et al., 2010; Strother et al., 2014). L1 and L2 neurons respond in a physiologically identical manner to changes in luminance (Clark et al., 2011; Yang et al., 2016; Zheng et al., 2006), while downstream neurons in the medulla transform this information to discriminate ON versus OFF stimuli (Strother et al., 2014). Further processing occurs in the lobula and lobula plate to mediate higher-order computations for both motion and contrast detection (Bahl et al., 2015; Behnia et al., 2015; Strother et al., 2014).
Serotonergic neurons broadly innervate the optic ganglia of Drosophila and other insects, including the lamina, medulla, lobula, and lobula plate (Hamanaka et al., 2012; Leitinger et al., 1999; Nässel et al., 1985; Nässel et al., 1987; Schafer et al., 1986; Valles et al., 1988). Significant progress has been made in mapping the synaptic connectivity of the optic lobe, including neurons required for motion detection (Meinertzhagen et al., 1991; Rivera-Alba et al., 2011; Shinomiya et al., 2019; Takemura et al., 2013; Takemura et al., 2008; Takemura et al., 2017; Takemura et al., 2015). By contrast, the connectivity of serotoninergic projections in the optic lobe and the mechanisms by which serotonergic signaling may regulate visual processing in flies or other insects remains unclear.
Here, we leverage Drosophila molecular-genetic tools to identify the expression patterns of serotonin receptors present in a subset of critical visual processing lamina neurons and the connectivity of these cells. We demonstrate that serotonin signaling increases intracellular calcium and enhances stimulus-response in L2 neurons, establishing a potential mechanism for serotonergic regulation of the initial events required for visual processing.
Results
Serotoninergic circuitry in the optic lobe
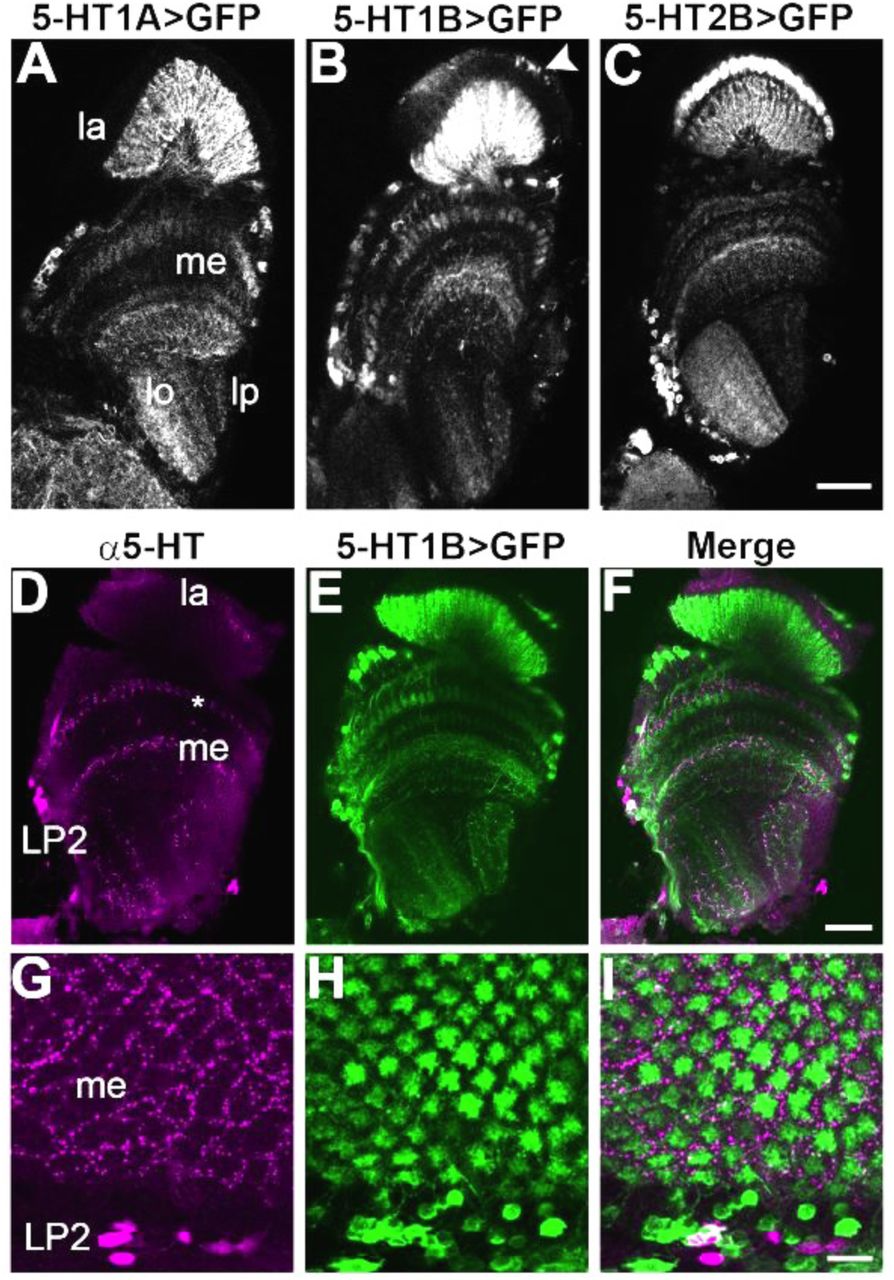
Five genes encoding serotonin receptors have been identified in the Drosophila genome: 5-HT1A, 5-HT1B, 5-HT2A, 5-HT2B and 5-HT7 (Colas et al., 1995; Gasque et al., 2013; Saudou et al., 1992; Witz et al., 1990). To identify specific neurons in the optic lobes expressing each receptor, we expressed the marker mCD8::GFP in flies under the control of a recently characterized panel of GAL4 insertions in Minos-mediated Integration Cassettes (MiMICs) (Diao et al., 2015; Gnerer et al., 2015). MiMICS are contained within receptor-encoding genes and “mimic” their endogenous expression patterns (Venken et al., 2011). We observed distinct expression patterns for each receptor throughout the optic lobes (Figure 1), however we focused on expression in the lamina, the first optic ganglion and a region crucial for early visual processing. In particular, 5-HT1A, 5-HT1B and 5-HT2B receptor subtypes showed prominent expression in the lamina (Figure 1A-C) and we therefore concentrate on these receptor subtypes. Both 5-HT1A and 5-HT1B GFP-positive neurons innervated the lamina neuropil. We did not detect expression of either receptor in cell bodies of the lamina cortex, but rather observed GFP-labeled somata at the edge of the medulla (Figure 1A, B). 5-HT2B driven expression was prominent in lamina cortex cell bodies as well as in the lamina and medulla neuropil (Figure 1C). For 5-HT1B, additional pleomorphic labeling was observed in the lamina cortex (arrowhead in Figure 1B) in a pattern that appeared similar to that of optic lobe glia (Edwards et al., 2010). We focus here on serotonin receptor expression in lamina neurons rather than glia.

(A-I) Serotonin receptor MiMIC-GAL4 lines were crossed to UAS-mCD8::GFP to identify patterns of expression in the optic lobe. (A-C) GFP-labeled cells representing the 5-HT1A (A), 5-HT1B (B), and 5-HT2B (C) MiMIC-GAL4 lines are visible in the neuropils of the lamina (la), medulla (me), lobula (lo) and lobula plate (lp). The arrowhead in (B) marks pleomorphic 5-HT1B>GFP labeling in the lamina cortex, possibly representing glial expression. (D-F) Anti-serotonin labeled boutons were observed throughout the optic lobe, including medulla layer M2 (asterisk) and the indicated LP2 cluster of cells. (G-I) In a frontal view, serotonin boutons (G, I) surround each column containing 5-HT1B>GFP projections in the medulla (H, I). n = 6-13 brains per condition. Scale bars: 20μm (A-C), 25μm (D-F), and 10μm (G-I).
Serotonin immunolabeling was observed in processes within all optic ganglia as well as a cluster of 8-10 cell bodies in the accessory medulla (Figure 1D, G). The cell bodies correspond to cluster LP2 (or Cb1), previously shown to project into the medulla (Nässel, 1988; Valles et al., 1988; Xu et al., 2016). Many of the neuronal processes expressing serotonin receptor MiMIC-GAL4 driven GFP showed close apposition to serotonergic boutons (Figure 1D-I). For example, 5-HT1B-expressing terminals in the distal medulla were surrounded by a honeycomb pattern of serotonergic labeling (Figure 1G-I),
Distinct lamina neurons express different serotonin receptors
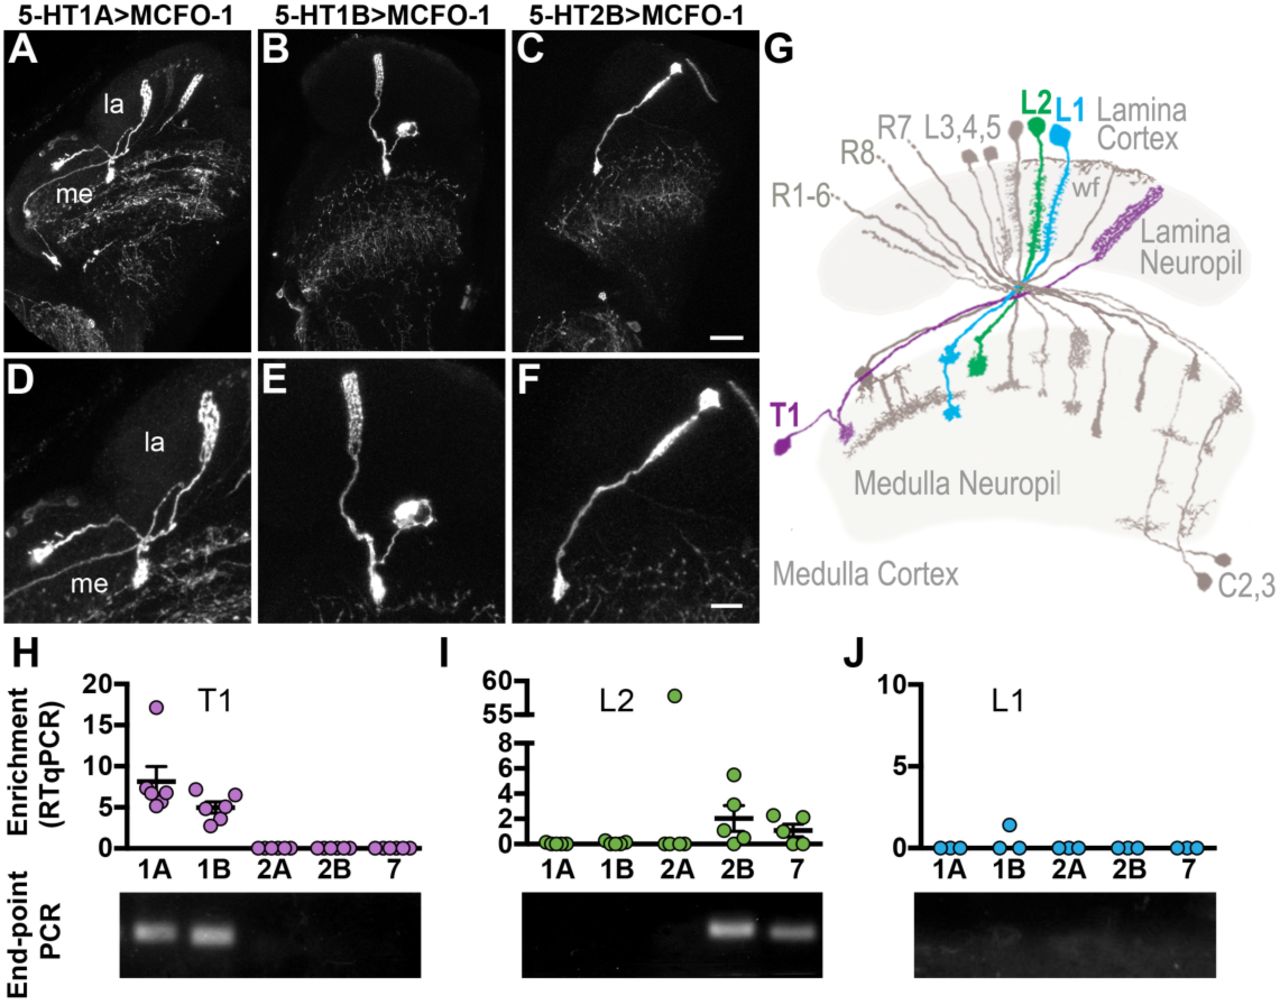
To identify individual neurons expressing serotonin receptors in the lamina, we used the receptor MiMIC-GAL4 lines in combination with the sparse labeling technique MultiColor FlpOut (MCFO-1) (Nern et al., 2015). In 5-HT1A and 5-HT1B sparse-labeling experiments we consistently observed cells with a soma in the medulla cortex, a long basket-like projection in the lamina, and a smaller projection in the medulla. This morphology is consistent with that of T1 cells (Figure 2A-B, D-E, G) (Fischbach et al., 1989). Using the 5-HT2B driver, MCFO-1 labeled cells with a soma in the lamina cortex, dense projections extending into the lamina neuropil, and a single bushy terminal in the medulla (Figure 2C, F), a morphology identical to the lamina monopolar neuron L2 (Figure 2G) (Fischbach et al., 1989).

(A-G) Serotonin receptor MiMIC-GAL4 lines were crossed to UAS-MCFO-1 to sparsely label individual cells in the lamina. Most of the optic lobe is shown in (A-C) and individual cells are shown at higher magnification to illustrate their morphology in (D-F). Both 5-HT1A (A, D) and 5-HT1B (B, E) MCFO-1 crosses revealed cells with morphologies identical to T1 neurons. (C, F) 5-HT2B driving MCFO-1 labeled cells morphologically identical to L2 neurons. (G) A diagram showing lamina neurons adapted from (Fischbach et al., 1989) highlights L1 (blue), L2 (green) and T1 (magenta) cells. (H-J) RT-qPCR performed on cDNA from isolated T1, L2 or L1 neurons expressing GFP showed enrichment for serotonin receptors relative to other GFP-negative cells from the optic lobe (H-J, top panels). End-point PCR from a representative RT-qPCR reaction is shown below each bar graph (H-J, bottom panels). Scale bars are 20μm (A-C) and 10μm (D-F); for (A-F) n = 10-35 brains. For (H-J), n = 3-6 biological replicates; bars in (H-J) represent mean ± SEM.
To independently confirm expression of 5-HT1A and 5-HT1B in T1 neurons, and 5-HT2B in L2 neurons, we used split-GAL4 drivers specific for each cell type to express GFP (Tuthill et al., 2013). GFP-labeled cells were isolated via Fluorescence Activated Cell Sorting (FACS) and RT-qPCR was performed on isolates from either T1 or L2 cells to probe for serotonin receptor expression. Consistent with our MCFO-1 data, RT-qPCR from GFP-labeled T1 isolates showed enrichment of both 5-HT1A and 5-HT1B transcripts, but not other serotonin receptors (Figure 2H and Supplemental Table 1).
In contrast to T1, L2 isolates showed consistent enrichment for 5-HT2B, but not 5-HT1A or 5-HT1B transcripts (Figure 2I and Supplemental Table 1). Additional receptors were occasionally detected in the L2 samples: 5-HT7 was amplified in 3 out of 5 samples and 5-HT2A in a single sample (Figure 2I and Supplemental Table 1). It is possible that these transcripts were derived from neurons incompletely dissociated from L2 prior to FACS. Alternatively, expression of some serotonin receptors may occur in L2 in a mosaic pattern too sparse to be easily detected using single cell labeling methods such as MCFO-1.
We did not observe evidence of any serotonin receptor expression in L1 neurons using the serotonin receptor MiMIC-GAL4 lines to drive either mCD8::GFP or MCFO-1 (see Figure 1). In agreement with this observation, RT-qPCR from isolated L1 cells showed virtually no receptor expression, apart from one sample weakly enriched for 5-HT1B (Figure 2J and Supplemental Table 1). In sum, MCFO-1 sparse labeling in combination with RT-qPCR show that T1 neurons express 5-HT1A and 5-HT1B, L2 neurons express 5-HT2B, and L1 neurons do not detectably express any serotonin receptor subtypes. These data are consistent with a recent computational genomics study, which reported a high probability of expression for 5-HT2B in L2, 5-HT1A and 5-HT1B in T1, and a low likelihood of any serotonin receptor expression in L1 neurons (Davis et al., 2018).
Serotonin increases calcium levels in L2 and L1 neurons
To determine the potential effects of serotonin on lamina neurons expressing serotonin receptors, we bath applied serotonin and used GCaMP6f to monitor cytosolic calcium levels. 5-HT2B receptors couple with Gq/11 and increase intracellular calcium in vitro (Blenau et al., 2017; Hoyer et al., 2002). To test whether serotonin could have similar effects in 5-HT2B-expressing L2 neurons, we used the L2 split-GAL4 driver to express GCaMP6f (Figure 3A). After recording a baseline in saline, the perfusion solution was switched to either saline containing 100 μM serotonin or saline alone. Tetrodotoxin (TTX) was included in all perfusion solutions to inhibit synaptic input from other cells. We consistently observed a large increase in L2>GCaMP6f fluorescence following serotonin application (Figure 3B and Supplemental Figure S1A). This increase continued throughout the time course of recording, peaking at 1.73 ΔF/F ± 0.77 SEM (compared to saline control −0.03 ΔF/F ± 0.05 SEM at the same timepoint; p=0.0095). Thus, serotonin leads to an accumulation of cytosolic calcium in L2 cells, consistent with the predicted outcome of activating Gq/11 coupled 5-HT2B receptors (Blenau et al., 2017; Hoyer et al., 2002).

(A-C) GCaMP6f was paired with L2, L1 and T1 split GAL4 drivers to monitor responses to 100 μM serotonin (colored traces) or saline controls (gray traces). (A) The experimental setup is shown in the top panel, along with a sample image of L2 terminals (bottom panel) as imaged in the medulla (gray), and with the overlaid ROI used for analysis (green). For bath application experiments (B, C, E, F), the first 60s of baseline is not shown; traces represent data recorded following a switch at time 0 to saline with serotonin or saline alone. The length of time for the switch to complete was roughly 1min 45s. In L2 terminals (B), serotonin application led to a significant increase in GCaMP6f signal indicating increased calcium levels as compared to saline controls (p = 00095). L1 terminals (C) showed a similar increase in calcium following a switch to serotonin (p = 0.02). (D) RT-qPCR from cell isolates revealed enrichment of the gap junction protein ShakB in L2 and L1, but not T1 neurons. (E) T1 cells expressing GCaMP6f showed no significant change in calcium following serotonin application (p>0.05). (F) T1 cells expressing the voltage sensor ArcLight similarly displayed no significant change following serotonin application (p>0.05). For (B, C, E, F) n = 4-8 individual flies; the dark trace is an average of all traces and the shaded region is 1 SD. For (D), n = 3 individual isolates for each cell type. Bars in (D) represent the mean ± SEM.
We did not detect serotonin receptors in L1 neurons and therefore we did not expect serotonin to measurably change cytosolic calcium in these neurons. However, when GCaMP6f was expressed in L1 cells, we regularly observed a robust increase in baseline fluorescence following serotonin exposure with a similar latency to L2 (Figure 3C and S1B). Although the increase in GCaMP6f signal did not reach the same response amplitude as observed in L2 neurons, the effect in L1 neurons similarly persisted throughout the time of recording and peaked at 0.98 ΔF/F ± 0.34 SEM (compared to saline control at 0.07 ΔF/F ± 0.09 SEM; p=0.02). As the experiments were performed in the presence of TTX, the serotonin response in L1 is unlikely to be a result of synaptic input; a direct action of serotonin on L1 is also unlikely due to the absence of endogenous serotonin receptors. We therefore hypothesized that electrical coupling between L1 and L2 could account for the observed effect of serotonin in L1 (Joesch et al., 2010). In support of this possibility, we found that transcripts for the gap junction protein Shaking-B (ShakB) were enriched in L1 and L2 neurons, but not T1 neurons (Figure 3D).
We next examined whether serotonin could affect the activity of T1 cells. Both 5-HT1A and 5-HT1B receptors, expressed in T1 neurons, are expected to couple with Gi proteins and negatively regulate adenylyl cyclase (Hoyer et al., 2002; Saudou et al., 1992). Due to the generally inhibitory function of these receptors, we hypothesized that serotonin would dampen activity in T1 neurons, possibly manifested as a decrease in cytosolic calcium. Using the T1 split-GAL4 driver to express GCaMP6f, however, we did not observe a significant change in fluorescence comparable to that seen in L2 or L1 neurons (Figure 3E). Importantly, the absence of a GCaMP6f response in T1 neurons indicates that the response observed in L1 and L2 is not a generalized phenomenon common to all cells in the lamina.
As 5-HT1A receptor activation can lead to hyperpolarization in neurons through regulation of potassium channels (Polter et al., 2010), we also examined whether a voltage sensor could identify baseline changes in T1 cells following serotonin application. However, we did not observe any significant serotonin-evoked change in fluorescence using the voltage sensor ArcLight (Cao et al., 2013) expressed in T1 cells (Figure 3F and S1D; p>0.1) and further experiments will be needed to determine the effects of serotonin on T1.
T1 and L2 provide synaptic feedback onto serotonergic neurons in the optic lobes
Serotonergic circuits often receive synaptic feedback from their target networks, as is the case for long-range projections from the mammalian cortex and the retina back to the raphe (Huang et al., 2017; Ogawa et al., 2014; Pollak Dorocic et al., 2014; Weissbourd et al., 2014; T. Zhang et al., 2016). A number of processes in the fly optic lobe have been shown to be axo-dendritic and contain both pre-and post-synaptic specializations (Meinertzhagen et al., 1991; Takemura et al., 2013; Takemura et al., 2015). We speculated that serotonergic neurons in the optic lobe might not only provide modulatory input, but also receive input from optic lobe neurons. To explore this possibility, we used a SerT-GAL4 driver to express the dendritic marker DenMark (Nicolai et al., 2010) in serotonin neurons that project to the optic lobe. We found that the postsynaptic marker and serotonergic-immunolabeled puncta (representing pre-synaptic release sites) were adjacent or overlapping at multiple sites in both the lamina (data not shown) and medulla (Figure 4A).

(A) SerT-GAL4 was used to express the postsynaptic marker DenMark. Punctate DenMark labeling (A, A”) was detected in the medulla (me) along with release sites labeled with anti-serotonin (A’, A”). (B-D) For SybGRASP, L2 or T1 split GAL4 drivers were used to express the presynaptic half of GFP and the postsynaptic half of GFP was expressed in serotonergic neurons using a TRH-LexA driver. (B, C) With L2 neurons presynaptic to TRH cells, sybGRASP signal was observed in cell bodies in the lamina (arrowhead, see Supplemental Figure for higher magnification) and in the medulla neuropil (boxed area in B shown at higher magnification in C). The sybGRASP signal was adjacent to VAChT, a marker for cholinergic neurons including L2 (B’, C’). (D) With T1 neurons pre-synaptic to TRH, sybGRASP signal was detected in the medulla neuropil and adjacent to post-synaptic anti-serotonin immunolabeling. n = 6-13 brains per condition. Scale bars: (A) 25 μm, (B) 15μm, (C, D) 5μm.
To more directly test whether L1, L2 or T1 neurons synapse onto serotonergic projections in the optic lobe we used an activity-dependent synaptic version of GFP Reconstitution Across Synaptic Partners (sybGRASP) (Macpherson et al., 2015). In this variant of GRASP, the presynaptic cell expresses split-GFP fused to the synaptic vesicle protein n-synaptobrevin to direct one of the GFP fragments to vesicular release sites. The postsynaptic cell expresses a fusion of the second fragment of GFP and the membrane protein CD4 (Macpherson et al., 2015). When L2 was presynaptic to serotonergic processes, reconstituted GFP was observed in the lamina cortex and the medulla neuropil (Figure 4B,C and S2). In the medulla neuropil, robust punctate GFP labeling was observed in layer M2 (Figure 4C) where serotonin varicosities and L2 terminals converge. L2 neurons are cholinergic (Takemura et al., 2015), and we observed reconstituted GFP either co-localized or closely apposed Drosophila Vesicular Acetylcholine Transporter (VAChT) immunoreactive processes in and around M2 (Figure 4B’, C’) (Boppana et al., 2017).
We similarly examined whether T1 neurons synapse onto serotonergic processes. As with L2 neurons, punctate GFP labeling was present throughout the M2 layer of the medulla representing contacts from T1 onto serotonergic neurons (Figure 4D). To allow co-labeling with a marker for T1, we attempted to determine its neurochemical identity using a panel of molecular markers for acetylcholine, glutamate and GABA, but failed to establish that T1 expresses ChAT, VGlut or GAD1 (Figure S3). We therefore relied on serotonin-immunolabeling to mark the serotonergic component of the presumptive synapses. We found that reconstituted GFP signal was adjacent to serotonin labeling in the medulla (Figure 4D”) and did detect sybGRASP labeling in the lamina (data not shown). Together, these data suggest that T1 neurons synapse onto serotonergic processes in M2.
In contrast to L2 and T1, sybGRASP experiments in which L1 was presynaptic to serotonergic cells, did not show reconstituted GFP in M2 or elsewhere in the neuropil of either the lamina or medulla (Figure S4). However, we occasionally observed a sybGRASP signal in L1 cell bodies within the lamina cortex (Figure S4), and we also observed labeling in cell bodies in L2 sybGRASP experiments (Figure 4B and S2). We have not pursued this observation since all known synaptic communication in Drosophila occurs in the neuropil rather than the cortex and neurotransmitter release from lamina cell bodies has not been reported.
Serotonergic neurons likely signal through volume transmission in the optic lobe
Although some mammalian serotonergic neurons make synaptic connections (Gaspar et al., 2012; Herve et al., 1987; Moukhles et al., 1997) most serotonergic signaling in the mammalian brain occurs through extra-synaptic volume transmission (Bunin et al., 1999; Fuxe et al., 2010; Trueta et al., 2012; Vizi et al., 2010). Little is known about serotonergic connectivity in the Drosophila optic ganglia, and EM studies in other insects have revealed sites likely to represent both synaptic and non-synaptic release (Nässel et al., 1984; Nässel et al., 1985). To determine whether serotonergic neurons directly synapse upon L1, L2 or T1 cells, we again used sybGRASP with serotonergic cells expressing the presynaptic component of GFP (Macpherson et al., 2015). With SerT presynaptic to L2, T1 or L1 neurons we did not detect any reconstituted GFP in the medulla (Figure S5) and only occasional GFP puncta in the lamina cortex (3 out of 7 L2 brains, see Figure S5). Although it remains possible that serotonergic synapses onto L1, L2 or T1 neurons were present but undetectable, this seems unlikely since we observed a robust signal in parallel experiments in which the post-synaptic component of GFP was expressed in serotonergic cells (see Figure 4). Together, these data suggest that most signaling from serotonergic neurons onto L1, L2 and T1 neurons is likely to occur through a non-synaptic mechanism, similar to the extensive use of volume transmission in the mammalian brain (Fuxe et al., 2010; Vizi et al., 2010).
L2 and T1 neurons form reciprocal synaptic connections
L2 and T1 terminals converge with serotonergic processes in medulla layer M2 and we reasoned that the two might have direct synaptic contact here. In examining previously published ultrastructural studies, we found that synapses have been identified from L2 onto T1 neurons in the medulla, as well as from T1 onto L2 neurons, albeit to a lesser extent (Takemura et al., 2013; Takemura et al., 2015). Using sybGRASP, we observed robust signals representing presynaptic L2 contacts onto postsynaptic T1 sites and vice versa in layer M2 (Figure S6).
To confirm the synaptic nature of L2 and T1 neurons in this region, we used syt.eGFP and DenMark markers to label pre and postsynaptic sites, respectively. In both neuron types, we detected strong labeling with both syt.eGFP and DenMark in the medulla, supporting a mixed axo-dendritic nature for both neuron types in the medulla (Figure S7). Our GRASP data and previously published ultrastructural data are thus consistent with a reciprocal connection between L2 and T1 neurons in the medulla, and more specifically, in layer M2.
Serotonin in visual processing
Having identified serotonin receptors in L2 and T1, and robust calcium accumulation in L1 and L2 neurons in response to serotonin, we predicted that serotonergic neuromodulation could impact visual processing. To test this hypothesis we used brief light or dark flashes to stimulate L2 neurons with methods previously described (Yang et al., 2016). We expressed GCaMP6f in L2 neurons and imaged terminals in the medulla of flies suspended over an LED arena to present visual stimuli (see Figure 3A). Light and dark flashes of the entire LED screen, each lasting 100 ms, were presented at 5 s intervals with intermediate-level brightness. One-minute epochs consisting of 12 flashes of randomly shuffled polarity were presented six times for each trial (Figure 5A). The first epoch was recorded in saline, followed by a switch to either saline with 100 μM serotonin or saline alone. Similar to previous observations, serotonin perfusion increased baseline calcium levels (Figure 3B, 5A). When flies were presented with a light flash under baseline perfusion with saline, L2 neurons responded with an initial stimulus-mediated decrease in GCaMP6f fluorescence, followed by a sustained increase (Figure 5D), consistent with previous results (Yang et al., 2016). Strikingly, when perfusion was switched to saline with serotonin, the amplitude of the L2 responses to light flashes was strongly enhanced and continued to increase over the course of the experiment (Figure 5E, G; p<0.01).

L2 split GAL4 was crossed to UAS-GCaMP6f to monitor calcium changes following brief light or dark flashes, either with or without serotonin in the perfusion solution. A sample experiment with serotonin is shown in (A). Light or dark stimuli (upper middle panel) were flashed at random every 5s. The preparation was initially perfused with saline alone, and the solution was switched to saline with serotonin after one minute (lower middle panel); the perfusion switch took ∼45s to complete. The time course of each experiment was divided into 60s epochs for analysis in (B, C, D, E). The highlighted areas (a, b) in the top panel are also shown as insets with an expanded time scale. (B, C, D, E) Mean traces representing each progressive 60s epoch are shown with responses to dark flashes (B, C) and light flashes (D, E). (B) In control experiments, L2 terminals show a strong increase in GCaMP6f fluorescence following a dark pulse before returning to baseline. (C) Similar waveform responses were observed following addition of serotonin to the bath. (F) Dark flash peaks for each 60s epoch show that serotonin did not significantly impact responses (p>0.05). (D) When a light flash was presented in control experiments, L2 cells responded with a decrease in GCaMP signal followed by a large sustained increase. (E) The same waveform response was seen for L2 light responses in serotonin. (G) The peak responses following a light pulse are summarized and show that serotonin significantly increased the amplitude relatively to saline alone (p<0.01). For (B-G) n = 7-11 individual flies.
Dark flashes also induced a large increase in calcium that returned to baseline within ∼1 second (Figure 5B), however, in contrast to light flashes, the effect on response amplitude to the dark flash did not differ from saline controls (Figure 5F; p>0.05). These data indicate that in addition to increasing absolute intracellular calcium levels, serotonin enhances L2 responses in a stimulus specific manner.
Discussion
To begin our study of serotonergic regulation of the Drosophila visual system, we mapped the expression of specific subtypes of serotonin receptors to visual processing neurons in the optic lobe. We observed expression of serotonin receptors throughout the optic lobe, with distinct expression patterns, suggesting a role for serotonin signaling in visual processing. Specifically, we found that L2 neurons express 5-HT2B and that T1 neurons express 5-HT1A and 5-HT1B, while L1 neurons do not consistently show expression of any serotonin receptors. Our data are consistent with a recent report of transcriptional profiles for L1, L2, T1 as well as other optic lobe neurons (Davis et al., 2018).
Recent work has reported serotonin receptor expression by photoreceptors (Davis et al., 2018), and an earlier study described serotonergic modulation of potassium channels in photoreceptors (Hevers et al., 1995). However, we did not detect expression of any serotonin receptors in photoreceptors using MiMIC-GAL4 lines. It is possible that incomplete dissociation of glia, which we suggest express 5-HT1B, could have contaminated isolates of photoreceptors used in the prior genomic analysis of receptor expression (Davis et al., 2018). Likewise, incomplete dissociation could have resulted in the presence of L2 processes on photoreceptor cell preparations used for physiological preparations (Hevers et al., 1995). Since L2 provides feedback onto photoreceptors R1-6 (Meinertzhagen et al., 1991), our demonstration that serotonin modulates L2 neurons suggests a potential mechanism for the previous physiological observations (Hevers et al., 1995). The use of MiMIC-GAL4 lines bypasses issues of cell dissociation that were a caveat in previous strategies to map receptor expression. However, the lower limits detection using this strategy are unclear. Therefore, we cannot at present rule out the possibility that some photoreceptors express serotonin receptors that were not detected using the MiMIC-GAL4 lines.
Serotonin signaling occurs via G-protein coupled receptors, which can induce immediate or long-term changes in cell physiology. We examined acute responses to serotonin receptor activation by bath applying serotonin onto optic lobe tissue. Consistent with the predicted coupling of 5-HT2B to Gq, we found that L2 neurons respond with a robust increase in calcium measured by GCaMP6f fluorescence (Figure 3B and S1A); however, we cannot rule out a potential contribution from either 5-HT2A or 5-HT7, as both showed expression in our RT-qPCR data set (Figure 2I). In contrast to the robust increase in calcium in L2 neurons in response to serotonin, we did not observe a significant change in baseline calcium or voltage with T1 neurons (Figure 3E-F and S1C-D). It is possible that serotonin regulates dynamic patterns of neuronal activity in T1 rather than static properties such as cytosolic calcium concentration or resting membrane potential. Alternatively, other probes (e.g., for cAMP) may be necessary to detect the acute response of T1 to serotonin. Either possibility could explain our inability to detect an acute response to bath applied serotonin in T1 using either GCaMP or ArcLight. However, it is also possible that activation of 5HT1 receptors do not induce significant acute physiological responses, and that chronic changes in 5HT1 receptor activation are necessary to induce measurable changes in T1.
In L1 neurons, which do not express serotonin receptors, we unexpectedly observed a large calcium response to serotonin similar to that of L2 (Figures 3C and S1B). As these experiments were performed in the presence of the voltage-gated Na+ channel inhibitor TTX, which inhibits action potentials, we expect that the effect was non-synaptic. Notably, we did not observe a comparable calcium change in T1 neurons, which do receive synaptic input from L2 neurons (Figure S6) (Takemura et al., 2015). A compelling explanation for the calcium effect in L1 is that gap junction coupling with L2 neurons mediates the response indirectly (Joesch et al., 2010). Joesch et al. (2010) found that electrical coupling was able to activate both L1 and L2 even when photoreceptor input to one of the two cells was blocked (Joesch et al., 2010). L1 and L2 show immunolabeling with Shaking B (Joesch et al., 2010), a gap junction protein, and we found here that both L2 and L1, but not T1 neurons, are enriched in Shaking B transcript (Figure 3D). Alternatively, L1 may be electrically coupled with other as yet unidentified cells that are modulated by serotonin. Other mechanisms are also possible such as chemically mediated synaptic inputs to L1 that do not depend on action potentials. Regardless of the underlying mechanism, our data underscore the potential importance of an indirect pathway for serotonergic neuromodulation here and in other circuits.
In both mammals and insects, serotonin can be released extra-synaptically through volume transmission (Bunin et al., 1999; Descarries et al., 2000) or through synaptic sites (Coates et al., 2017; Gaspar et al., 2012; Herve et al., 1987; Moukhles et al., 1997; Nässel et al., 1985). The ultrastructure of serotonergic processes in the optic lobe of Drosophila is not known; however, serotonergic release sites are exclusively non-synaptic in the lamina of the blowfly Calliphora (Nässel et al., 1984). Our data obtained using sybGRASP (Figure S5) imply that serotonin is released extra-synaptically in the neuropil of the medulla. Future experiments in the fly visual system may be used to explore the poorly understood relationship between volume transmission and specific sub-types of serotonin receptors.
Previous work in other systems indicates that feedback onto serotonergic neurons regulates circuit function (Celada et al., 2001; Ogawa et al., 2014; Pollak Dorocic et al., 2014; Weissbourd et al., 2014). This includes the mammalian visual system, in which ON and OFF RGCs modulate serotonergic neurons in the raphe (Huang et al., 2017; T. Zhang et al., 2016). Evidence for sensory system input to serotonergic neurons in insects includes an observed decrease in tonic firing in response to light in the butterfly (Ichikawa, 1994) and input to serotonergic clusters from olfactory neurons in Drosophila (Coates et al., 2017; X. Zhang et al., 2016). Similarly, our sybGRASP data suggest that both L2 and T1 neurons make synaptic contacts onto serotonergic processes in M2 (Figure 4). This, in addition to the reciprocal synaptic contacts between L2 and T1 in layer M2 of the medulla (Figure S6 and (Takemura et al., 2013; Takemura et al., 2015)) suggest that M2 may act as an important hub for neuromodulatory activity. The proposed microcircuit formed by these connections is summarized in Figure 6.

Small clusters of serotonergic neurons (represented as a single orange circle) extend projections across multiple columns (gray rectangles) in the medulla. We propose that serotonin release, acting extra-synaptically (dashed lines), signals to L2 (green circles) and T1 (purple circles) neurons through receptors 5-HT2B, 5-HT1A, and 5-HT1B, respectively. Serotonin may act indirectly on L1 neurons (blue circles), which are electrically coupled to L2 (indicated as a teal bar). L2 and T1 neurons form reciprocal synaptic connections (solid arrows) with each other and with serotonin projections within layer M2 of the medulla, possibly allowing local, serotonergic neuromodulation within individual columns.
Since all of these interactions appear to occur within the same region, we speculate that M2 represents a local hub to integrate neuromodulatory information for visual processing. To further test this hypothesis, we are now developing molecular tags for 5-HT2B, 5-HT1A and 5-HT1B to determine if they localize within layer M2. Although mammalian studies have primarily focused on more long-range feedback loops, it is possible that individual serotonergic boutons in mammals could also undergo local feedback, a potential mechanism to regulate specific components of broadly projecting serotonergic neurons.
Serotonin modulates circadian behaviors in Drosophila (Nichols, 2007; Yuan et al., 2005) and previous studies in other insects have found that serotonin levels vary throughout the day (Kloppenburg et al., 1999; Saifullah et al., 2002), possibly correlating with changes in photosensory input. It is possible that these effects are in part mediated by serotonergic activation of L2 or other neurons involved in the initial steps of visual processing. Cell-specific knock down of 5-HT2B or other serotonin receptors could be used to address this possibility. Here, we focus on the effects of serotonin on visual processing.
In Drosophila, L1 and L2 neurons detect changes in luminance and together are necessary for the full complement of motion vision. Both neurons receive synaptic input from photoreceptors, and respond to luminance changes with graded potentials, depolarizing in dark conditions and hyperpolarizing in light (Clark et al., 2011; Yang et al., 2016; Zheng et al., 2006). These two neurons feed into parallel pathways to enable further visual processing such as motion and contrast detection (Bahl et al., 2015; Maisak et al., 2013; Strother et al., 2014). The enhancement of visually induced calcium transients in L2 following serotonin application (Figure 5G) suggests a role for serotonin in potentiating the response of L2-dependent visual processing pathways (Yang et al., 2016). It is possible that serotonin could regulate the response to synaptic input from photoreceptors. Alternatively increased calcium levels in L2 terminals following serotonin application could increase neurotransmitter release onto the neurons postsynaptic to L2. In either case, the effects of serotonin on L2-dependent pathways will only become evident in experiments testing the responses of downstream neurons such as Tm1, Tm2 and Tm4 (Shinomiya et al., 2014; Takemura et al., 2013; Takemura et al., 2011).
In general, both L1 and L2 respond to both light and dark flashes and it is unclear why the response of L2 to dark pulses was not significantly enhanced by serotonin (Figure 5F). Unlike the experiments shown in Figure 3, TTX was absent from the perfusion for the visual response experiments shown in Figure 5, so it is possible that the observed effects of serotonin on L2 include input from additional sites, and that non cell-autonomous serotonergic effects dampened the response of L2 to dark flashes. Previous experiments in Calliphora underscore this possibility and the complexity of serotonin’s effects on the visual system (Chen et al., 1999). In these previous studies, extracellular electroretinograms were used to record the combined output of L1 and L2 neurons in the lamina (Chen et al., 1999). While injection of serotonin into the haemolymph increased both the light ON and the light OFF transients, serotonin injected directly into the retina led to a net reduction in both the ON and OFF responses (Chen et al., 1999). These complex effects suggest that multiple serotonergic pathways can influence the activity of L1 and L2 neurons, possibly including non-cell autonomous activation of serotonin receptors on neurons that innervate L1 and/or L2 neurons.
To understand these effects and to identify the mechanisms by which serotonin regulates visual processing it will be necessary to examine multiple cellular components in the ON/OFF pathways beyond L2. Studies in mammals have already begun to dissect the contributions of serotonergic tuning in multiple cells within individual circuits including the visual system (Gagolewicz et al., 2016; Halberstadt, 2015; Li et al., 2018; Moreau et al., 2010; Zhou et al., 2018). However, the way in which this information is integrated remains poorly understood. We speculate that interactions between receptors expressed on L2, T1 and other neurons in the fly visual system may provide a framework to dissect the mechanism by which multiplexed serotonergic inputs combine to regulate circuit function.
In other dipteran species, T1 neurons respond to increased luminance with a hyperpolarization and decreased luminance with a depolarization, similar to L2 and L1 (Douglass et al., 1995; Järvilehto et al., 1973). In Drosophila, depolarizing T1 neurons leads to disruptions in steering and other visually directed behavior (Tuthill et al., 2013), however its precise role in visual processing remains enigmatic. Interestingly, the same behavioral deficits that were seen following inactivation of L1 or L2 were seen when T1 was activated (Tuthill et al., 2013). It is possible that T1 acts to provide feedback or buffering to L2 output. Since T1, L2 and serotonergic terminals all converge in the M2 region of the medulla, we speculate that interactions in this region may be critical to visual processing as well as neuromodulatory effects. If so, testing the effects of serotonin on T1 may help us to determine its function in visual processing.
Conclusion
We find that L1 and L2, two neurons at the head of most visual processing pathways in Drosophila, respond to serotonin signaling with an increase in calcium. In L2 neurons, this was sufficient to enhance the response to bright flashes. We also identified a potential regulatory microcircuit that includes processes from serotonergic, L2, L1 and T1 neurons, all converging within medulla layer M2. Our data suggest that L2 and T1 neurons synapse directly onto serotonergic projections in M2, establishing a potential mechanism for neuromodulatory feedback or a route for communicating visual input to the central brain. We demonstrate that serotonin has a multifaceted effect on visual processing by 1) selectively targeting individual cell classes via differential receptor expression, 2) leveraging indirect mechanisms to broaden sensory modulation and 3) enforcing stimulus specific response modulation by targeting distinct L2 response features. In future work, we will continue to explore the mechanisms underlying these effects and the possibility of reciprocal signaling between serotonin projections and other visual processing neurons in the optic lobe.
Methods
Fly Husbandry and Genetic Lines
Flies were maintained on a standard cornmeal and molasses-based agar media with a 12:12 hour light/dark cycle at room temperature (22-25°C). Serotonin receptor MiMIC-T2A-GAL4 lines described in (Gnerer et al., 2015) were a gift from Herman Dierick (Baylor College of Medicine), and include 5-HT1A-T2A-GAL4MI01468, 5-HT1A-T2A-GAL4MI01140, 5-HT1A-T2A-GAL4MI04464, 5-HT1B-T2A-GAL4MI05213, 5-HT2B-T2A-GAL4MI06500, 5-HT2B-T2A-GAL4MI5208, and 5-HT2B-GAL4MI7403. Split-GAL4 lines for L1, L2 and T1 neurons and LexA lines for L1 and T1 (Tuthill et al., 2013) were provided by Aljoscha Nern (HHMI/Janelia Research Campus). SerT-GAL4 (RRID:BDSC_38764), TRH-LexA (RRID:BDSC_52248), L2-LexA (RRID:BDSC_52510), GAD1 Trojan LexA (RRID:BDSC_60324), ChAT Trojan LexA (RRID:BDSC_60319), and VGlut Trojan LexA (RRID:BDSC_60314; provided by Quentin Gaudry (UMD)) were obtained from Bloomington Drosophila Stock Center at Indiana University (Bloomington, IN, USA). Reporter lines include: UAS-mCD8::GFP (RRID:BDSC_5137), UAS-MCFO-1 (RRID:BDSC_64085), UAS-GCaMP6f (RRID:BDSC_42747), UAS-ArcLight (RRID:BDSC_51056), UAS-DenMark, UAS-Syt.eGFP (RRID:BDSC_33064 and RRID:BDSC_33065), UAS-mCD8::RFP, LexAop-mCD8::GFP (RRID:BDSC_32229), and UAS-nSyb::GFP1-10, LexAop-CD4:GFP11 (RRID:BDSC_64314; provided by Larry Zipursky (UCLA)).
Immunohistochemistry and Imaging
Flies were dissected 5-10 days after eclosion, and equal numbers of males and females were used for all experiments unless otherwise noted. Brains were dissected in ice-cold PBS (Alfa Aesar, Cat#J62036, Tewksbury, MA), then fixed in 4% paraformaldehyde (FisherScientific, Cat#50-980-493, Waltham, MA) in PBS with 0.3% Triton X-100 (Millipore Sigma, Cat#X100, Burlington, MA) (PBST) for one hour at room temperature. Brains were washed three times with PBST for 10 minutes, then blocked for 30 minutes in PBST containing 0.5% normal goat serum (NGS) (Cayman Chemical, Cat#10006577, Ann Arbor, MA) PBST. Antibodies were diluted in 0.5% NGS/PBST. Primary antibodies were incubated with the tissue overnight at 4°C. The next day, the brains were washed three times with PBST for 10 minutes, then incubated with secondary antibodies for 2 hours in the dark at room temperature. Brains were washed three times with PBST for 10 minutes, followed by 60% and 80% glycerol (Millipore Sigma, Cat#G5516) before mounting with Fluoromount-G (SouthernBiotech, Cat#0100-01, Birmingham, AL).
Serotonin immunolabeling was performed with 1:25 rat anti-serotonin (Millipore Sigma, Cat#MAB352, RRID:AB_11213564), 1:1000 rabbit anti-serotonin (ImmunoStar, Cat#20080, Hudson, WI, RRID:AB_572263) or 1:1000 goat anti-serotonin (ImmunoStar, Cat#20079, RRID:AB_572262). Where noted, GFP was labeled with 1:250 mouse anti-GFP (Sigma-Aldrich, Cat#G6539, RRID:AB_259941; or, ThermoFisher, Waltham, MA, Cat#A-11120, RRID:AB_221568). Secondary antibodies were used at 1:400 and include: Alexa Fluor 488, 594 or 647 (Jackson ImmunoResearch Laboratories, Westgrove, PA, Cat#715-545-151, # 711-585-152, # 712-605-153) or Alexa Fluor 555 (Life Technologies, ThermoFisher, Cat#A-21428).
When serotonin receptor MiMIC-GAL4 lines were combined with VGlut, ChAT and GAD1 MiMIC-LexA (Supplemental Figure S2), brains were processed and imaged as described in Sizemore and Dacks 2016 (Sizemore et al., 2016).
MultiColor FlpOut (MCFO-1) sparse labeling was induced by heat activation at 37°C for 10-15 minutes at least 2 days prior to dissection as described (Nern et al., 2015). Primary antibodies included 1:300 rabbit anti-HA (Cell Signaling Technology, Cat#3724, Danvers, MA, RRID:AB_1549585), 1:150 rat anti-FLAG (Novus, Littleton, CA, Cat#NBP1-06712, RRID:AB_1625982), and 1:400 anti-V5::Dylight-550 (Bio-Rad, Hercules, CA, Cat#MCA1360D550GA, RRID:AB_2687576). N-Synaptobrevin GFP Reconstitution Across Synaptic Partners (sybGRASP) flies (Macpherson et al., 2015) were dissected, fixed and immunolabeled as described above, without KCl induction. The tissue was labeled with mouse antiserum specific to reconstituted GFP (1:250; Sigma-Aldrich, Cat#G6539, RRID:AB_259941) (Gordon et al., 2009) and either anti-serotonin (antibodies listed above) or rabbit anti-VAChT (1:500; provided by Hakeem Lawal) (Boppana et al., 2017).
Imaging was performed with a Zeiss LSM 880 Confocal with Airyscan (Zeiss, Oberkochen, Germany) using a 40x water or 63x oil immersion objective. Images shown represent a single optical slice except where indicated. Post-hoc processing of images was done with Fiji (Schindelin et al., 2012) or Adobe Photoshop (Adobe, San Jose, CA).
FACs and RT-qPCR
L2, T1 and L1 neurons were labeled using split-GAL4 drivers (Tuthill et al., 2013) combined with UAS-mCD8::GFP (RRID:BDSC_5137). Brains were dissected on the day of eclosion and optic lobes were dissociated according to previously published methods (Tan et al., 2015) The dissociated optic lobe cells were separated by fluorescence-activated cell sorting (FACS) into GFP-positive and GFP-negative isolates using a BD FACS Aria II high-speed cell sorter in collaboration with the UCLA Jonsson Comprehensive Cancer Center (JCCC) and Center for AIDS Research Flow Cytometry Core Facility (http://cyto.mednet.ucla.edu/home.html). For FACS, each experiment was performed with 18-40 brains, and yielded between 1,700-7,800 GFP+ cells. RNA was extracted from isolated cells with ARCTURUS® PicoPure® RNA Isolation Kit (ThermoFisher, KIT0204) followed by reverse transcription with SuperScript III (Invitrogen, ThermoFisher, Cat#18080093).
RT-qPCR was performed for receptor mRNA using validated primers (Supplemental Table 2) and SYBR Green Power PCR Mix (Applied Biosystems, ThermoFisher) on an iQ5 real-time qPCR detection system (Bio-Rad). Primers were designed using Primer-Blast (https://www.ncbi.nlm.nih.gov/tools/primer-blast/) or were from the DGRC FlyPrimerBank (Hu et al., 2013); oligonucleotides were obtained from Integrated DNA Technologies (Coralville, Iowa). Primer pairs were validated to amplify a single product, verified by a single melting temperature and single band on an electrophoresis gel. The efficiency for each primer pair was between 85-115%. Comparisons between GFP+ and GFP− samples were calculated as enrichment (i.e., fold change) using the comparative CT method (Schmittgen et al., 2008). A zero value was imputed for samples with no amplification (i.e., no CT value). Raw CT values are shown in Supplemental Table 1.
Live Cell Imaging
Calcium imaging was performed as previously described (Keles et al., 2017). Briefly, flies were anesthetized at 4°C and placed into a chemically etched metal shim within a larger custom-built fly holder. The fly holder was based on a previously described design (Weir and Dickinson, 2015). The head capsule and the thorax were glued to the metal shim using UV-curable glue (www.esslinger.com). The legs, proboscis and antennae were immobilized using beeswax applied with a heated metal probe (Waxelectric-1, Renfert). The head capsule was immersed in insect saline (103 mM NaCl, 3 mM KCl, 1.5mM CaCl2, 4 mM MgCl2, 26 mM NaHCO3, 1 mM NaH2PO4, 10 mM trehalose, 10 mM glucose, 5 mM TES, 2 mM sucrose) (Wilson et al., 2004). A small window on the right rear head capsule was opened using sharp forceps (Dumont, #5SF). Muscles and fat covering the optic lobe were cleared before placing the fly under the 2-photon microscope (VIVO, 3i: Intelligent Imaging Innovations, Denver, CO). Neurons expressing GCaMP6f were imaged at 920-nm using a Ti:Sapphire Laser (Chameleon Vision, Coherent). Images were acquired at 10-20 frames/s. Only female flies were used for live imaging experiments.
A custom-built gravity perfusion system was used for bath application of either serotonin or saline control to the fly’s exposed optic lobe. The tissue was first perfused with insect saline containing 1μm tetrodotoxin citrate (TTX) (Alomone Labs, Jerusalem, Israel, Cat#T-550) for at least 5 minutes at 2 mL/min, prior to each recording. TTX remained present throughout the experiment. To examine the effects of serotonin on calcium levels, baseline GCaMP6f fluorescence was recorded for one minute before switching to the second input containing either 100μM serotonin hydrochloride (Sigma Aldrich, Cat# H9523) or saline alone for an additional five minutes of recording. Due to perfusion tubing length and dead volume, the perfusion switch took approximately 1 min 45 s to reach the tissue.
Visual Stimulus Experiments
Visual stimuli were shown using an arena composed of 48 eight by eight-pixel LED panels, at 470 nm (Adafruit, NY, NY). The panels were assembled into a curved display that extends 216° along the azimuth and ±35° in elevation. Each pixel subtended an angle of 2.2° on the retina at the equatorial axis. To prevent spurious excitation of the imaging photomultiplier tubes, three layers of blue filter (Rosco no. 59 Indigo) were placed over the LED display.
Each stimulus consisted of a brief increment (light flash) or decrement (dark flash) of the entire display for 100ms, before returning to a mid-intensity brightness for 4.9s. Images were acquired at 25-30 frames/s. Stimuli were presented in sets of six bright and six dark flashes randomly shuffled for each minute of the experiment. Responses were then pooled for each minute. During the first minute, and prior to imaging, the tissue was perfused with saline for a baseline recording. At the end of the first minute, a valve controller (VC-6, Warner Instruments, Hamden, CT) activated by a TTL signal switched the perfusion to either saline with 100μM serotonin or saline alone; imaging then continued for an additional five minutes, for a total of one baseline set and five post-switch sets of stimuli. The perfusion switch took approximately 50s to reach the tissue.
Analysis
Calcium imaging data were analyzed with Matlab R2017a (Mathworks, Natick, MA). Post hoc, recordings were corrected for movement of the brain within the imaging plane using a custom algorithm (Akin et al., 2016). Regions of interest (ROIs) were found semi-automatically for each experiment: first, the median intensity of all pixels across all image frames was found; this value was used as a threshold and all pixels with mean intensity below the threshold, typically within the image background, were discarded. The 1-D time-series of intensity for each remaining pixel was then extracted. K-means clustering was used to identify pixels with similar activity over the course of the experiment; three clusters were identified, and the cluster that included the highest number of pixels was used as an ROI. This reliably identified the pixels within active neurons in the imaging data and aided in identifying preparations with out-of-plane movement, which were discarded. The mean intensity within the ROI was found for each image frame to produce a single time-series for the entire experiment. Approximately half of the bath application recordings showed oscillations in activity due to slow, periodic movement of the brain at around 0.04 Hz; we applied a notch filter at this frequency with a bandwidth of 0.005 Hz to remove these oscillations. For the bath application experiments (Figure 3), we plotted ΔF/F, defined as (Ft−F0)/F0, where Ft is the mean fluorescence in the ROI at the indicated time and F0 is the mean value of Ft during 60 seconds of baseline activity at the beginning of the experiment and prior to the change in perfusion. For the visual stimulus experiments (Figure 6), we again plotted ΔF/F, defined as (Ft−F0)/F0, where Ft is the mean fluorescence in the ROI at the indicated time and F0 is the mean of 30 seconds of non-consecutive baseline activity between trials in epoch 0 at the beginning of the experiment and prior to the change in perfusion (Figure 6A-E). For further analysis, we calculated Fpeak for each epoch, defined as the maximum ΔF/F value that occurred for each light or dark stimulus presentation within 1.75 s after cessation of the 0.1 s flash; for each fly, we found the mean of the maximum values for the six light flashes or the six dark flashes that occurred within each epoch of 60 seconds. We then normalized the Fpeak values for each fly by calculating Fpeak/Fpeak(0), where Fpeak(0) is the fly’s Fpeak value for epoch 0 at the beginning of the experiment and prior to the change in perfusion. The median of the Fpeak/Fpeak(0) values was then found for the saline and serotonin groups (Figure 6F, G). We used a two-tailed Wilcoxon rank sum test to compare the Fpeak/Fpeak(0) values for the saline versus serotonin groups.
Funding
This work was funded by R01 MH107390 (DEK), R01 MH114017 (DEK) R01 EY026031 (MAF), IOS-1455869 (MAF), R03 DC013997 (AMD), R01 DC016293 (AMD) and a seed grant from the UCLA Depression Grand Challenge (DEK, MAF). MMS was supported by a National Science Foundation GRFP and UCLA Cota-Robles fellowship. TRS was supported by a Grant-In-Aid of Research (G20141015669888) from Sigma Xi, The Scientific Research Society.
Competing interests
The authors deny any relevant paid employment or consultancy, stock ownership, patent applications, personal relationships with relevant individuals, or membership of an advisory board.
Acknowledgements
We thank members of Larry Zipursky’s lab (UCLA) including Eilzabeth Zuniga Sanchez and Liming Tan for advice on FACS, RNA extraction and RT-qPCR. We thank members of the Frye and Krantz labs for helpful discussions, Aljoscha Nern (HHMI/Janelia Research Campus) and Herman Dierick (Baylor) for generously supplying fly lines, and Hakeem Lawal for the DVAChT antiserum.


