

Abstract
Microbes are embedded in complex microbiomes where they engage in a wide array of inter- and intra-specific interactions1–4. However, whether these interactions are a significant driver of natural biodiversity is not well understood. Two contrasting hypotheses have been put forward to explain how species interactions could influence diversification. ‘Ecological Controls’ (EC) predicts a negative diversity-diversification relationship, where the evolution of novel types becomes constrained as available niches become filled5. In contrast, ‘Diversity Begets Diversity’ (DBD) predicts a positive relationship, with diversity promoting diversification via niche construction and other species interactions6. Using the Earth Microbiome Project, the largest standardized survey of global biodiversity to date7, we provide support for DBD as the dominant driver of microbiome diversity. Only in the most diverse microbiomes does DBD reach a plateau, consistent with increasingly saturated niche space. Genera that are strongly associated with a particular biome show a stronger DBD relationship than non-residents, consistent with prolonged evolutionary interactions driving diversification. Genera with larger genomes also experience a stronger DBD response, which could be due to a higher potential for metabolic interactions and niche construction offered by more diverse gene repertoires. Our results demonstrate that the rate at which microbiomes accumulate diversity is crucially dependent on resident diversity. This fits a scenario in which species interactions are important drivers of microbiome diversity. Further (population genomic or metagenomic) data are needed to elucidate the nature of these biotic interactions in order to more fully inform predictive models of biodiversity and ecosystem stability4,5.
Main text
The majority of the genetic diversity on Earth is encoded by microbes8–10 and the functioning of all Earth’s ecosystems is reliant on diverse microbial communities 11. High-throughput 16S rRNA gene amplicon sequencing studies continue to yield unprecedented insight into the taxonomic richness of microbiomes (e.g. 12,13), and abiotic drivers of community composition (e.g. pH14,15) are increasingly characterised. Although it is known that biotic (microbe-microbe) interactions can also be important in determining community composition16, comparatively little is known about how such interactions (e.g. cross-feeding1 or toxin-mediated interference competition2,3) shape microbiome diversity.
The dearth of studies exploring how microbial interactions could influence diversification and diversity stands in marked contrast to a long research tradition on biotic controls of plant and animal diversity17,18. In an early study of 49 animal (vertebrate and invertebrate) community samples, Elton plotted the number of species versus the number of genera and observed a ~1:1 ratio in each individual sample, but a ~4:1 ratio when all samples were pooled18. He took this observation as evidence for competitive exclusion preventing related species, more likely to overlap in niche space, to co-exist. This concept, more recently referred to as niche filling or Ecological Controls (EC)5 predicts speciation (or, more generally, diversification) rates to decrease with increasing standing species diversity because of diminished available niche space19. In contrast, the Diversity Begets Diversity (DBD) model predicts that when species interactions create novel niches, standing biodiversity favors further diversification6,20. For example, niche construction (i.e. the physical, chemical or biological alteration of the environment) could influence the evolution of the species constructing the niche, and/or that of co-occurring species21,22.
Empirical evidence for the action of EC vs. DBD in natural plant and animal communities has been mixed20,23–26. Laboratory evolution experiments have sought general principles by tracking the diversification of a focal bacterial lineage in communities of varying complexity – but the results have also been varied27,28. For example, diversification of a focal Pseudomonas clone was favoured by increasing community diversity in the range of 0-20 species within the same genus20,29 but diversification was inhibited by very diverse communities (e.g. hundreds or thousands of species in natural soil30). These experimental results show how interspecific competition can initially drive diversification31, and eventually inhibit diversification as niches are filled. However, these experiments were restricted to very short evolutionary time scales (i.e. a few dozen mutations at most) in a small number of lineages, and it is unclear if they can be generalized to natural communities evolving over longer periods, spanning multiple speciation events and large-scale genomic changes.
To test whether natural microbial communities conform to EC or DBD models of diversification, we used 2,000 microbiome samples from the Earth Microbiome Project (EMP), the largest available repository of biodiversity based on standardized sampling and sequencing protocols7. All samples were rarefied to 5,000 observations (counts of 16S rRNA gene sequences), as diversity estimates are highly sensitive to sampling effort32. Instead of a phylogenetic approach requiring complex assumptions33,34, we use the equivalent of the Species:Genus (S:G) ratios that Elton used three quarters of a century ago18 to infer bacterial diversification rates. Rather than species, we considered 16S rRNA gene Amplicon Sequence Variants (ASVs) as our finest taxonomic unit. We then used a range of taxonomic ratios (ASV:Genus, Genus:Family, Family:Order, Order:Class, and Class:Phylum) as proxies for diversification of a focal lineage, from shallow to deep evolutionary time, and plot these as a function of the number of non-focal lineages (Genera, Families, Orders, Classes, and Phyla, respectively) with which the focal lineage could interact. A negative relationship is consistent with the EC hypothesis, whereas a positive relationship is consistent with the DBD hypothesis (Fig. 1). We used generalized linear mixed models (GLMMs) to determine how the diversification of a focal lineage (e.g. its ASV:Genus ratio) is affected by the diversity of other lineages (e.g. non-focal genera) in the community. The effects of environment (as defined by the EMP Ontology ‘level 3 biomes;’ Methods) and the identity of the focal lineage were included by fitting these as random effects on the slope and intercept. We also controlled for the submitting laboratory (identified by the principal investigator) and the EMP unique sample identifier (i.e. if two taxa were part of the same sample). Finally, we repeated these analyses using a taxonomy-free method based on nucleotide sequence identity cutoffs (Methods).

We consider the diversification of a focal lineage as a function of initial diversity present at the time of diversification.
(A) For example, sample 1 contains one non-focal genus, and two ASVs diversify within the focal genus (point at x=1, y=2 in the plot). Sample 2 contains three non-focal genera, and four ASVs diversify within the focal genus (point at x=3, y=4). Tracing a line through these points yields a positive slope, supporting the Diversity Begets Diversification (DBD) model (red).
(B) Alternatively, a negative slope would support the Ecological Controls (EC) model (blue line).
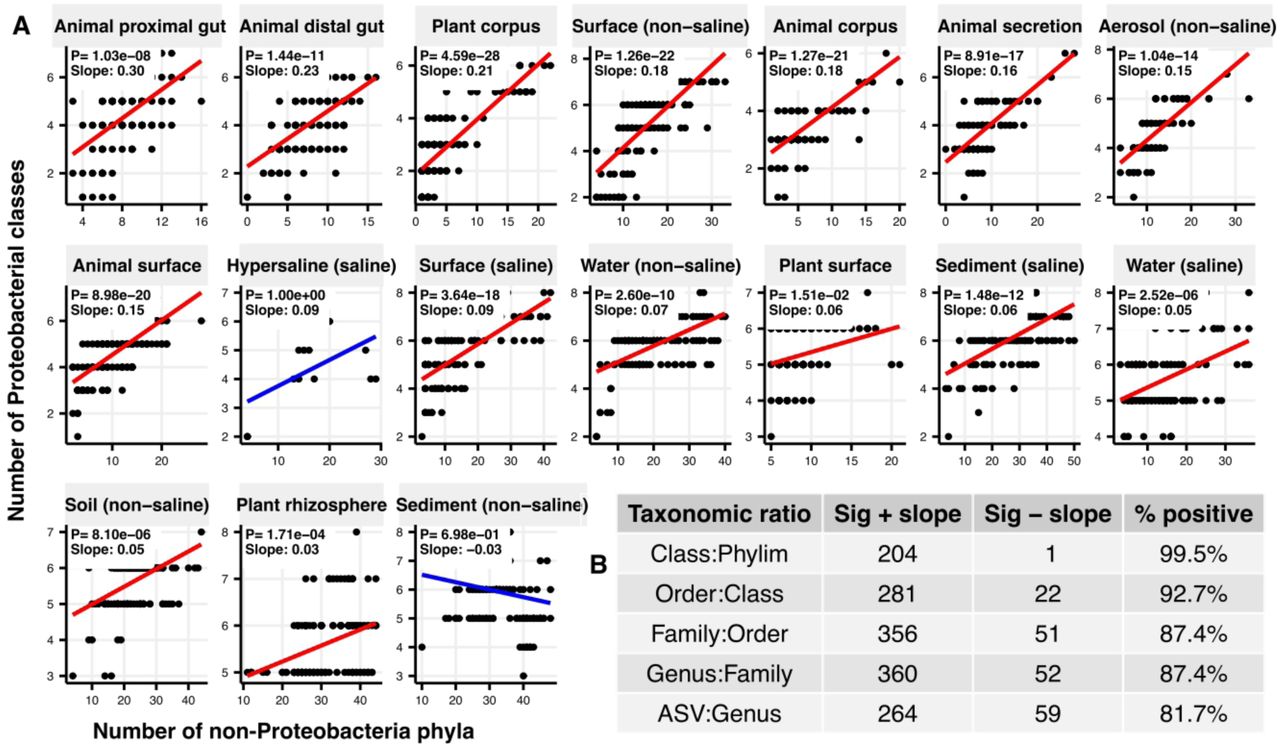
The DBD model was supported across taxonomic ratios, which all had significantly positive slopes fitting the diversity-diversification relationship (Table S1, Supplementary Data file 1 Section 1), and the vast majority of slope estimates across different lineages and environments were positive (Fig. S1). For example, the most prevalent phylum across all samples, Proteobacteria, had significantly positive slopes when fitted with linear models in all environments, except hypersaline and non-saline sediments (Fig. 2a). For each taxonomic ratio, the three most prevalent taxa followed positive slopes in most environments (Fig. S2–S6), with only a few instances of significantly negative slopes (Fig. 2b). The predominance of positive slopes is robust and remains after controlling for data structure and taxonomic assignment (Fig. S7, S8; Supplementary Text), nor are they explained by widely measured abiotic drivers (e.g. pH) that could simultaneously increase both diversity and diversification (Table S2; Supplementary Data file 1 Section 2; Supplementary Text). Thus, the EMP data are broadly consistent with the predictions of a DBD model.

(A) Linear models for diversification (the number of classes within Proteobacteria, y-axis) as a function of diversity (the number of non-proteobacterial phyla, x-axis) in each of the 17 environments (EMPO3 biomes). P-values are Bonferroni corrected for 17 tests. Significant (P <0.05) models are shown with red trend lines; non-significant (P > 0.05) trends are shown in blue.
(B) Summary of linear model slopes across taxonomic ratios. The number of significant positive (+) or negative (–) slope estimates are shown for each taxonomic ratio, summed across biomes. Significant slopes are those with P < 0.05 (Bonferroni corrected). Non-significant slope estimated are excluded.
The DBD hypothesis rests on the premise that species interactions drive diversification5,20. We therefore expect that lineages that are more tightly associated with a specific biome (i.e. long-term residents) are more likely to have had a long history of interaction with community members and thus are more likely to experience DBD than lineages that are not tightly associated with that biome (i.e. poorly adapted migrants or broadly adapted generalists). To test this prediction, we clustered environmental samples by their genus-level community composition using fuzzy k-means clustering (Fig. 3a), which identified three clusters: ‘animal-associated’, ‘saline’, and ‘non-saline’. The clustering included some outliers (e.g. plant corpus grouping with animals), but were generally intuitive and consistent with known distinctions between host-associated vs. free-living7, and saline vs. non-saline communities35. Resident genera were defined as those with a strong preference for a particular environment cluster, using indicator species analysis (permutation test, P<0.05; Fig. 3a; Fig. S9; Supplementary Data file 2), and genera without a strong preference were considered generalists. For each environment cluster, we ran a GLMM with resident genus-level diversity (number of non-focal genera) as a predictor of diversification (ASV:Genus ratio) for residents, generalists, or migrants (residents of one cluster found in a different cluster) (Supplementary Data file 1 Section 3). Resident diversity had no significant effect on the diversification of generalists (z=0.646, P=0.518; z=0.279, P=0.780; z=0.347, P=0.729, respectively for animal-associated, saline and non-saline clusters), but did significantly increase resident diversification (z=7.1, P= 1.25e-12; z=3.316, P=0.0009; z=7.109, P=1.17e-12, respectively). Resident diversity significantly decreased migrant diversification in saline (z=-3.194, P=0.0014) and non-saline environment clusters (z=− 2.840, P=0.0045), but had no significant effect in the animal-associated cluster (z=-0.566, P=0.571) (Fig. 3b). These results suggest that diversity begets diversification among lineages sharing the same environment over a long evolutionary time period, but that this is not the case for lineages that do not consistently occur in the same microbiome and presumably interact less frequently. The diversification of migrants in a new environment might even be impeded, presumably because most niches are already occupied by residents.

(A) PCA showing genera clustering into their preferred environment clusters. Circles indicate genera and triangles indicate environments (EMPO 3 biomes). The three environment clusters identified by fuzzy k-means clustering are: Non-saline (NS, blue), saline (S, green) and animal-associated (purple). Resident genera were identified by indicator species analysis.
(B) DBD in resident versus non resident genera across environment clusters. Results of GLMMs modeling diversification as a function of diversity in resident, migrant, or generalist groups. The x-axis shows the standardized number of non-focal resident genera (diversity); the y-axis shows the number of ASVs per focal genus (diversification). Resident focal genera are shown in orange, migrant focal genera in red, and generalist focal genera in black.
The positive effect of diversity on diversification should eventually reach a plateau as niches, including those constructed by biotic interactions, become saturated27,30. In the animal distal gut, a relatively low-diversity biome, we observed a strong linear DBD relationship at most sequence identity ratios; in contrast, the more diverse soil biome clearly attained a plateau (Fig. S10). To further test the hypothesis that increasingly diverse microbiomes experience weaker DBD due to saturated niche space, we used a GLMM including the interaction between diversity and environment type as a fixed effect. We considered this model only for taxonomic ratios with evidence for significant DBD slope variation by environment (Table S1): Family:Order, Order:Class and Class:Phylum. Consistent with our hypothesis, DBD slopes were significantly more positive in less diverse (often host-associated) biomes (Fig. 4a, Figure S11, Supplementary Data file 1 Section 4).
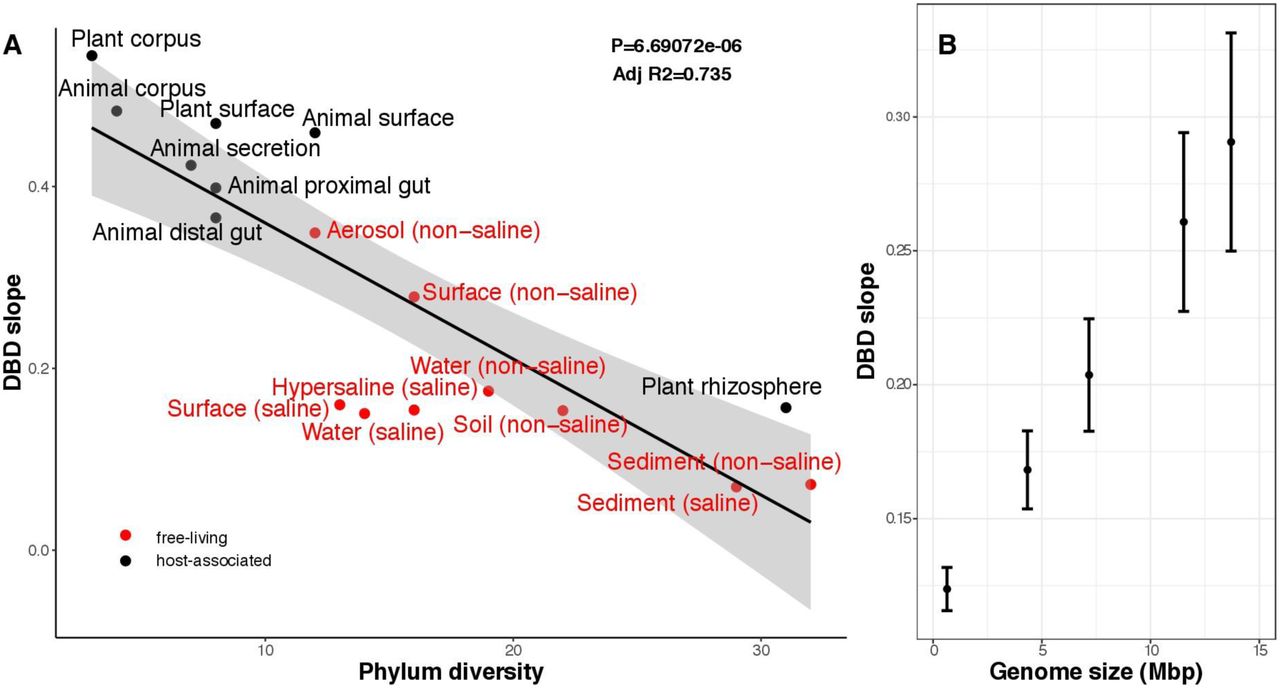
(A) DBD slope is higher in low-diversity (often host-associated) microbiomes. The x-axis shows the mean number of phyla in each biome. On the y-axis, DBD slope was estimated by the GLMM predicting diversification as a function of the interaction between diversity and environment type at the Class:Phylum ratio (Supplementary Data file 1 Section 4.3). The line represents a regression line; the shaded area depicts 95% confidence limits of the fitted values.
(B) Positive correlation between genome size and DBD slope. Results are shown from a GLMM predicting diversification as a function of the interaction between diversity and genome size at the ASV:Genus ratio (Supplementary Data file 1 Section 5). The x-axis is genus-level genome size in Mbp (min=0.97, max=14.78); the y-axis is DBD slope (the effect of diversity on diversification). Vertical bars indicate 95% confidence limits of the fitted values.
The Black Queen hypothesis posits that microbes embedded in complex communities can exploit the production of extracellular public goods produced by other species, resulting in selection for loss of genes encoding these goods – as long as the essential trait is not lost from the community as a whole36. Lineages that interact more frequently with other lineages through such public good exploitation would be expected to experience greater loss of function and thus greater genome reduction. These reduced genome would also be expected to experience stronger DBD, because their survival and diversification is dependent on other community members. To test this expectation, we assigned genome sizes to 576 genera for which at least one whole-genome sequence was available and added an interaction term between genome size and diversity as a fixed effect to the GLMM (Methods). Contrary to expectation, we observed a slight but significant positive effect of genome size on the slope (z=2.5, P=0.01; Fig. 4b, Supplementary Data file 1 Section 5). The positive relationship may even be stronger than estimated, because genus-level genome size estimates are likely quite noisy. This result supports a model in which biotic interactions (and resulting diversification) drive genome expansion (e.g. through the accumulation of toxin- and resistance-gene diversity during antagonistic coevolution2). Alternatively (or additionally), species with larger biosynthetic gene repertoires and greater opportunity to engage in niche construction21 could be more prone to interact with other species, driving DBD.
Using 10 million individual marker sequences, we demonstrated a pervasive positive relationship between prokaryotic diversity and diversification, which holds across a broad range of environments and taxa. The strength of the DBD relationship dissipates with increasing microbiome diversity which might be due to niche saturation, or potentially due to the fact that highly diverse communities prevent species from reliably interacting with each other. DBD appears to be particularly strong among deeply diverged lineages (e.g. phyla), suggesting the importance of DBD in the ancient diversification of bacterial lineages and supporting the view that high taxonomic ranks are ecologically coherent37,38. We note that the very early stages of diversification are inaccessible at the resolution of 16S ASVs, but this could be addressed in the future using (meta-)genomic approaches. At the limited resolution of 16S sequences, we do not expect measurable diversification within an individual microbiome sample; however community diversity could still select for (as in DBD) or against (as in EC) standing diversity in a focal lineages, even if this lineage diversified before the sampled community assembled. Due to the correlational nature of our data, it is not possible to test whether the positive relationship between diversification and diversity is primarily due to the creation of novel niches via biotic interactions and niche construction22, or potentially due to increased competition leading to specialisation on underexploited resources3,29. Despite their importance in shaping microbiome diversity and community structure, abiotic factors such as pH and temperature do not appear to be driving the DB relationship; this could be further tested in studies with more extensive abiotic metadata. Regardless of the underlying mechanisms, our results demonstrate the importance of biotic interactions in shaping microbiome diversity, which has important implications for modelling and predicting their function and stability4,39. The answer to the question ‘why are microbiomes so diverse?’ might in a large part be because microbiomes are so diverse25.
Funding
This project was made possible by an NSERC Discovery Grant and Canada Research Chair to BJS.
Author contributions
Conceptualization: BJS, MV. Data curation: NM. Formal analysis: NM, MV, BJS. Funding acquisition: BJS. Investigation: NM, MV, PL, BJS. Methodology: NM, MV, PL, BJS. Resources: BJS, PL. Supervision: PL, BJS. Software: NM. Visualization: NM. Writing original draft: NM, MV, BJS. Writing - review & editing: NM, MV, PL, BJS.
Competing interests
none to declare.
Data and materials availability
All data is available from the Earth Microbiome Project (ftp.microbio.me), as detailed in the Methods. All computer code used for analysis are available at https://github.com/Naima16/dbd.git.
Methods
16S rRNA marker data acquisition and preprocessing
16S rRNA-V4 region reads (90 bp, GreenGenes 13.8 taxonomy) along with environmental data and EMPO3 designations (http://press.igsb.anl.gov/earthmicrobiome/protocols-and-standards/empo/) were downloaded from the EMP FTP server (ftp.microbio.me), on February 9, 2018. Sequence summaries were downloaded from : ftp://ftp.microbio.me/emp/release1/otu_distributions/otu_summary.emp_deblur_90bp.subset_2k.rare_5000.tsv, environmental data from : ftp://ftp.microbio.me/emp/release1/mapping_files/emp_qiime_mapping_release1.tsv, and EMPO3 designations from : ftp://ftp.microbio.me/emp/release1/mapping_files/emp_qiime_mapping_subset_2k.tsv. The list of the associated 97 studies and 61 corresponding principal investigator identities were downloaded from https://www.nature.com/articles/nature24621#s1.
We used the EMP ‘2000 subset’ rarefied to 5000 sequences per sample. This subset contains 155 002 ASVs from 2000 samples with an even distribution across 17 natural environments (EMP Ontology level 3) (Thompson et al,. 2017). Based on the ASVs annotations across samples, we estimated diversification for every taxonomic ratio (ASV:Genus, Genus:Family, Family:Order, Order:Class and Class:Phylum), along with the number of non-focal lineages (Python script, Python Version 2.7).
Generalized Linear Mixed Models (GLMMs)
All models were fitted in Rstudio (Version 1.1.442, R Version 3.5.2) using the glmer function of the lme4 package 44. Data standardization (transformation to a mean of zero and a standard deviation of one) was applied to all predictors to get comparable estimates. In models with only one predictor, applying standardization resolved convergence warnings and considerably sped up the optimization. Standardization has previously been reported to improve model performance and solve convergence problems45.
We used likelihood-ratio tests (anova R function from stats package) as follows: 1) on nested models to assess the significance of random effects (in the nested models, each effect was dropped one at a time); 2) on the full model and the null model comprising only random effects, to assess the significance of fixed effects46; 3) on the full model and the model without the interaction term, to assess the significance of interactions. All models reported here were found to be significant (P<0.05).
Diagnostic plots (plot and qqnorm R functions in base and stats packages) were checked for each model to ensure that residual homoscedasticity (homogeneity of variance) was fulfilled: no increase of the variance with fitted values and residuals were symmetrically distributed tending to cluster around the 0 of the ordinate, but with an expected pattern due to count data. Normality plots were imperfect, but they generally showed that the residuals were close to being normally distributed. The assumption of normality is often difficult to fulfill with high numbers of observations, as is the case in our models (https://www.statisticshowto.datasciencecentral.com/shapiro-wilk-test/), and non-normality is less of concern than heteroscedastic for the validity of GLMMs (https://bbolker.github.io/mixedmodels-misc/ecostats_chap.html#diagnostics).
We tested for overdispersion using the overdisp_fun R function available at https://bbolker.github.io/mixedmodels-misc/glmmFAQ.html, and found that the models were not overdispersed, but rather were underdispersed. The ratio of the sum of squared Pearson residuals to residual degrees of freedom was < 1 and non-significant when tested with a chi-squared test. Given that underdispersion leads to more conservative results, we retained the GLMMs with Poisson error distribution, despite the underdispersion. (GLMM FAQ; Ben Bolker and others; 25 September 2018; https://bbolker.github.io/mixedmodels-misc/glmmFAQ.html#underdispersion).
Taxonomy-based generalized linear mixed models
The effect of diversity on diversification was tested for different environment types and lineages using generalized linear mixed models (GLMMs) fitted on the EMP dataset, for all taxonomic ratios. As the dependent variable (diversification, defined as taxonomic ratios, ASV:Genus, Genus:Family, Family:Order, Order:Class, and Class:Phylum) was a count response, we used a Poisson error distribution with a log link function. Diversity (number of non-focal lineages: non-focal Genera, Families, Orders, Classes, and Phyla), standardized to a mean of zero and a standard deviation of one, was specified as the predictor (fixed effect). We included the following random effects on the slope and intercept: lineage (Lin), environment (Env), environment nested within lineage (a lineage may be present in different environments) and lab (the principal investigator who conducted the EMP study) nested within environment (different labs sampled and sequenced a given environment) (as suggested in http://bbolker.github.io/mixedmodels-misc/glmmFAQ.html). Defining random effects on the slope enabled us to test slope variation across groups of each categorical variable. We included the EMP unique sample ID as a random effect to control for dependencies between observations (if two taxa were part of the same sample).
To test for the relative effect of biotic and abiotic environmental variables on diversification across different taxonomic ratios, we used a separate GLMM, with Poisson error distribution with a log link function, for every ratio. We fitted the GLMM on a subset (~10%) of the whole dataset, 192 samples (from water: saline (19) and non-saline (44), surface: saline (42) and non-saline (19), sediment: saline (22) and non-saline (31), soil (8) and plant rhizosphere (7)), for which measurements of four key abiotic variables (temperature, pH, latitude and elevation) were available. We defined diversity and the abiotic variables as well as the interactions between diversity and every abiotic variable as predictors (fixed effects) of diversification. All predictors were standardized to a mean of zero and a standard deviation of one to obtain comparable estimates. The GLMM had the same random effects as in the previous analysis, but only on the intercept for simplicity.
Nucleotide sequence identity-based analysis
We defined a threshold of percent nucleotide identity between ASVs, corresponding to different taxonomic ranks (from 100% identical ASVs down to 75% identity) 42. Fasta files for all samples were produced by a python script (Python Version 2.7) from the sequences summary file (otu_summary.emp_deblur_90bp.subset_2k.rare_5000 from EMP ftp server). We clustered sequences from each sample using USEARCH V9.2. We estimated diversity as the total number of clusters at a given level (e.g. 97% identity) and diversification as the mean number of descendent clusters (e.g. number of 100% clusters per 97% cluster). To describe the relationship between diversity and diversification, we tested three models: linear, quadratic and cubic (lm function in R). Model comparisons were based on the adjusted R2.
We note that diversity at level i (di) and diversification at level i+1 (di+1/di) are not independent in this analysis because di+1 must be greater than or equal to di. To assess the effects of this non-independence on the results, we conducted permutation tests by randomizing the associations between di and di+1. Using 999 permutations, P-values were calculated based on how many times we observed a correlation greater than that seen in the real data (cor.test R function with kendall method). In each permutation, we recalculated the significance test (Wald z) for the correlation in the randomized data, and then computed the P-value based on how many times we observed a z value greater than that of the original data (one tailed test because we wanted to demonstrate that the relationship was positive). At all six levels of nucleotide identity, the real data always showed a significantly stronger positive correlation when compared to permuted data (P = 0.001), indicating that the DBD patterns was not an artefact of the dependence structure in the data.
The effect of diversity on diversification was also tested across different environments analysed separately. We modelled this relationship with linear, quadratic and cubic fits, and compared those models based on the adjusted R2.
DBD among residents of the same environment
We clustered the environmental samples based on their genus-level community composition using fuzzy k-means clustering. Fuzzy clustering is a version of non-hierarchical clustering, where each cluster is a fuzzy set of all biomes and greater membership values indicates higher confidence in the allocation pattern to the cluster. The clustering (cmeans function, package e1071 in R) was done on the ‘hellinger’ transformed data (decostand function, package vegan in R). To identify resident genera to each cluster, we used indicator species analysis 47 as implemented in the indval function (labdsv R package). Indicators are genera found mostly in a certain environment group and present in the majority of environments of that group. The indicator value (indval index) of a genus is (maximum=1) if the genus is observed in only one environmental cluster and in all samples belonging to that cluster. We defined residents as genera with indval indices between 0.4 and 0.9, with permutation test P < 0.05. Genera not been associated with any cluster were considered generalists. We used principal component analysis (PCA) to visualize clustering and indicator genera (rda function, vegan R package). We then ran a separate GLMM for each environmental cluster, with resident genus-level diversity (number of non-focal genera) as a predictor of diversification (ASV:Genus ratio) for resident, migrant (residents of one cluster found in a different cluster) and generalist genera. The fixed effect was specified as the interaction between diversity and a factor defining the genus-cluster association (with three levels: resident, migrant and generalist). Random effects on intercept and slope were kept as in the previous GLMMs.
DBD variation across biomes
We tested the variation of DBD slope across different environments by defining environment (EMPO 3 biome type) as fixed effect. We fitted a GLMM with the interaction between diversity and environment type as a predictor of diversification. The main effects of diversity and environment individually were not included for model simplicity and we sought to look at the effect of the interaction alone (diversity*environment). All other random effects on intercept and slope were kept as in the previous GLMMs. DBD variation across environments was tested for Family:Order, Order:Class and Class:Phylum taxonomic ratios, as DBD slope variation by environment was statistically significant (likelihood-ratio test) for these ratios (Table S1).
Genome size analysis
We chose a subset of genera represented by one or more sequenced genomes in the NCBI microbial genomes database (https://www.ncbi.nlm.nih.gov/genome/browse#!/prokaryotes/). For these genera, a representative genome size was assigned by selecting the genome with the lowest number of scaffolds (if no closed genomes were available). If multiple genomes were available, sequenced to the same level of completion, the largest genome size was used. We fitted a GLMM on the subset of data with known genome size (576 genera) with the interaction between diversity and genome size as a predictor of diversification (ASV:Genus). All the other random effects on intercept and slope were kept as in the previous GLMMs.
Code availability
All computer code used for analysis are archived on the github repository https://github.com/Naima16/dbd.git.
Acknowledgements
We thank Luke Thompson for assistance obtaining EMP data and Zofia Ecaterina Taranu, Vincent Fugère and Guillaume Larocque for advice on Generalized Linear Mixed Models. We are also grateful to Steven Kembel and Tom Battin for critical comments that improved the manuscript.


