

ABSTRACT
Diffraction-unlimited single-molecule switching (SMS) nanoscopy techniques like STORM /(F)PALM enable three-dimensional (3D) fluorescence imaging at 20-80 nm resolution and are invaluable to investigate sub-cellular organization. They suffer, however, from low throughput, limiting the output of a days worth of imaging to typically a few tens of mammalian cells. Here we develop an SMS imaging platform that combines high-speed 3D single-molecule data acquisition with an automated, fully integrated, high-volume data processing pipeline. We demonstrate 2-color 3D super-resolution imaging of over 10,000 mammalian cell nuclei in about 26 hours, connecting the traditionally low-throughput super-resolution community to the world of omics approaches.
INTRODUCTION
Single-Molecule-Switching (SMS) nanoscopy (also referred to as Single-Molecule Localization Microscopy; SMLM) offers an about 10-fold improvement in resolution compared to conventional, diffraction-limited fluorescence microscopy and yields spatial information on the 20-80 nm scale[1] – a length scale critical for understanding many vital cellular processes such as organisation of DNA. The slow recording and analysis speed typical of SMS imaging (usually tens of minutes), however, limits the number of cells which can be imaged and hence the statistical power. For this reason, SMS has been largely restricted to targets which have very little variability between cells such that low sample numbers suffice. Complex biological investigations involving more subtle phenomena, large numbers of imaging targets, or many experimental conditions have required extensive data collection efforts spanning months to years [2]. Early automation efforts [3–5] have helped relieve the tedium of acquiring large numbers of SMS images, but have not increased the speed of either data acquisition or analysis and as a consequence have been most successful in applications imaging small structures in bacteria or yeast where large numbers of cells and structures of interest can be imaged within one field of view (FOV).
The use of sCMOS cameras [6] and high-power lasers have enabled SMS data acquisition at speeds an order of magnitude faster than with EMCCD cameras without degradation in image quality [7]. Imaging at this speed produces a huge amount of data, about 800 MB/s or up to 70 TB/day, and limitations in fast storage capacity and analysis algorithm speed have limited the overall throughput to approximately that of EMCCD based systems. Due to the added complexity of the sCMOS noise model [6], analysis has remained a significant bottleneck even when using GPU-accelerated code. To date, fast (>400 camera frames per second; FPS) SMS imaging has been largely restricted to 2D and has entailed a number of manual steps, both in image acquisition and analysis [6–8]. To deliver a truly high-throughput SMS platform operating at sCMOS speeds represents a significant technological challenge requiring advances across microscope hardware, data handling, and analysis routines.
Here we present a microscope and analysis platform which transforms SMS imaging from a qualitative or small-scale quantitative technique into a high-throughput, quantitative imaging tool. Our fully integrated, multicolor 3D super-resolution imaging system is capable of imaging 10,000 mammalian cells a day. We leverage our developments in data compression, distributed storage, and distributed analysis to automatically perform real-time localization analysis, and additionally present present a flexible architecture for distributed post-localization analysis. These software developments are included in the open source PYthon-Microscopy Environment (PYME) [9].
RESULTS
High-Speed Nanoscope Optics
We built an optical instrument optimized for automated high-speed SMS imaging including a motorized sample stage and focus stabilization (Supplementary Note I.A, Supplementary Fig. 1). Our design expands on our previous development of high-speed SMS imaging [6, 7], moving from 2D single-color imaging to 3D multicolor imaging. We have previously shown Alexa Fluor 647 (AF647) to be suitable for high-speed SMS imaging [7]. Additionally, we found CF568 to be capable of fast switching, enabling high-speed multicolor SMS. While astigmatism allows for 3D SMS imaging over an axial depth of about 600 nm [10, 11], we increased the axial localization range of the instrument by combining astigmatism with biplane imaging [12, 13] splitting the fluorescence into two astigmatic foci centered on two axial planes offset by about 750 nm (Fig. 1a, Supplementary Fig. 1). This extends the axial localization range to about 1.2 μm and accelerates volumetric imaging by reducing the number of axial steps which need to be taken.

(a) Schematic of automated multicolor 3D biplanar-astigmatism SMS microscope for high-throughput SMS imaging. Mot. S.: motorized sample stage; OBJ: objective; DM1-3: dichroic mirrors; BPF: band-pass filter; TL: tube lens; CL: cylindrical lens; L1-2: relay lenses; BM: biplane module; BS: beamsplitter cube; Man. S.: manual translation stage; EF1-2: emission filters. The four images on the right, recorded simultaneously by the Biplane Module, show blinking molecules in frame #5,599 of the SMS series shown in Fig. 2a. (b) Diagram of automated imaging and real-time localization data pipeline.
Data Compression, Streaming, and Distributed Storage
Previous high-speed SMS efforts [6] have saved data to a local solid-state drive (SSD) capable of sustaining the 800 MB/s data rate from an sCMOS camera. This imposes serious limitations when imaging for extended periods of time: firstly, readily available SSDs top out at around 8 TB capacity (or around 2.5 h of continuous recording) after which acquisition must be stopped and the data analyzed (which would take several days prior to the advances detailed in this paper). Secondly, the cost of large SSDs capable of sustaining the full camera data rate is sufficiently high that storing significant amounts of raw data on them is prohibitive.
We have solved the storage bottleneck through the combination of a lossy compression algorithm we developed to take advantage of the known noise characteristics of the system and the use of a distributed storage system whereby compressed image data is sharded across the nodes of a small cluster. Our compression algorithm allows a 5-8 fold reduction in data volume without impacting our ability to localize with high precision (see Supplementary Note II, Supplementary Figs. 4 – 6) and the cluster, with a current storage capacity of 120 TB, provides extensible low-cost storage of high volumes of image data (see Supplementary Note III and Supplementary Figs. 7, 8). This combination enables us to stream continuously at the full camera frame rate and also lays the foundations for analyzing the data in parallel.
Distributed Real-Time sCMOS Localization Analysis
Although some simplified methods (such as centroiding) have been shown to yield high localization speed, these entail serious compromises in precision and accuracy [14]. Obtaining optimal localization precision with sCMOS cameras requires fitting using an sCMOS-specific noise model [6] and an algorithm such as Maximum Likelihood Estimation (MLE) [15] or Weighted Least Square (WLS) [16]. To allow this to be performed in real time at sCMOS data rates, we have optimized our previous GPU-based MLE code [6] to achieve a >10 fold improvement in speed on a single computer and additionally implemented parallel analysis across the same computer cluster used for distributed storage (see Supplementary Note III.C, IV, and Supplementary Fig. 8). This workflow is illustrated in Fig. 1b. By ensuring that analysis runs on the same node on which the data is saved (data-local analysis), we also minimize any IO and network overhead within the cluster. Using these optimized, distributed, algorithms on our 10-node cluster (each node has a single Intel Core i7-5820K CPU, 32 GB of DDR4 SDRAM, and a NVIDIA Quadro M4000 GPU), we can continuously localize at 39,000 localizations/second (about 49 localizations per frame at 800 FPS).
3D MULTI-COLOR SUPER-RESOLUTION IMAGING IN 10 SECONDS
We have tested the ability of our platform to rapidly image a variety of 2-color samples. These were labeled with either immunofluorescence or fluorescence in-situ hybridization (FISH) protocols and span a wide range of biological targets. A selection of these samples are displayed in Fig. 2, and illustrate that we can rapidly and robustly acquire 3D super-resolved images that are comparable to those that one would obtain using a much slower conventional SMS microscope (see also Supplementary Fig. 2).
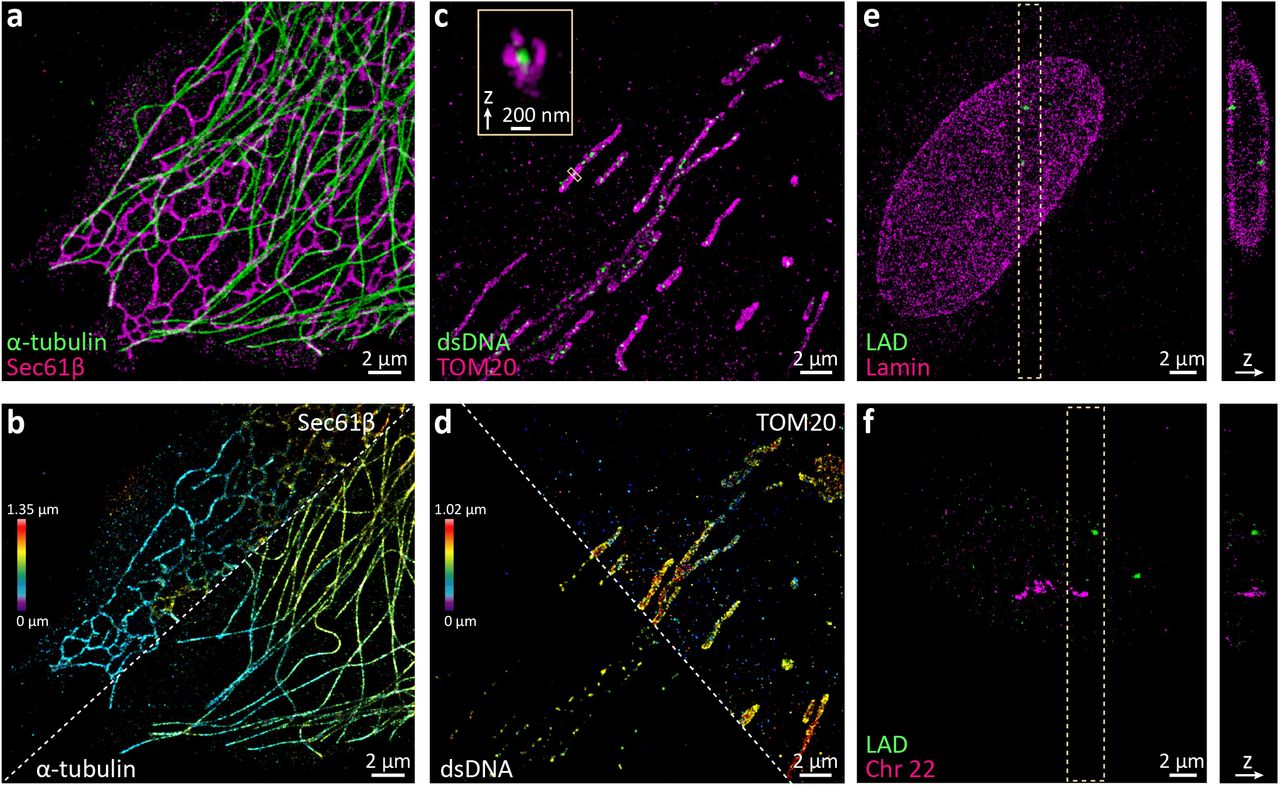
(a, b) Rapid 2-color 3D SMS imaging of biological structures. Microtubules (alpha-tubulin immunolabeled with CF568) and endoplasmic reticulum (Sec61-GFP immunolabeled with AF647) in a COS-7 cell. (c, d) Mitochondria (TOM20 immunolabeled with AF647) and nucleoids (double-stranded DNA immunolabeled with CF568ST) in a U2-OS cell. (e) Lamin a/c (immunolabeled with CF568) and a lamin-associated chromatin domain (LAD, Chr13: 24405079-24709084, labeled with AF647 via FISH) in an IMR-90 cell. (f) All 27 topologically associating chromatin domains (TADs) along chromosome 22 (FISH-labeled with CF568) and a LAD (Chr5:115508197-115813276, FISH-labeled with AF647) in an IMR-90 cell. All data sets were acquired at a frame rate of 800 Hz for 8,000 frames (a-d) or 24,000 frames (e, f). Images are colored by label (a, c, e, f) or axial position (b, d).
HIGH-THROUGHPUT IMAGING AND QUANTIFICATION
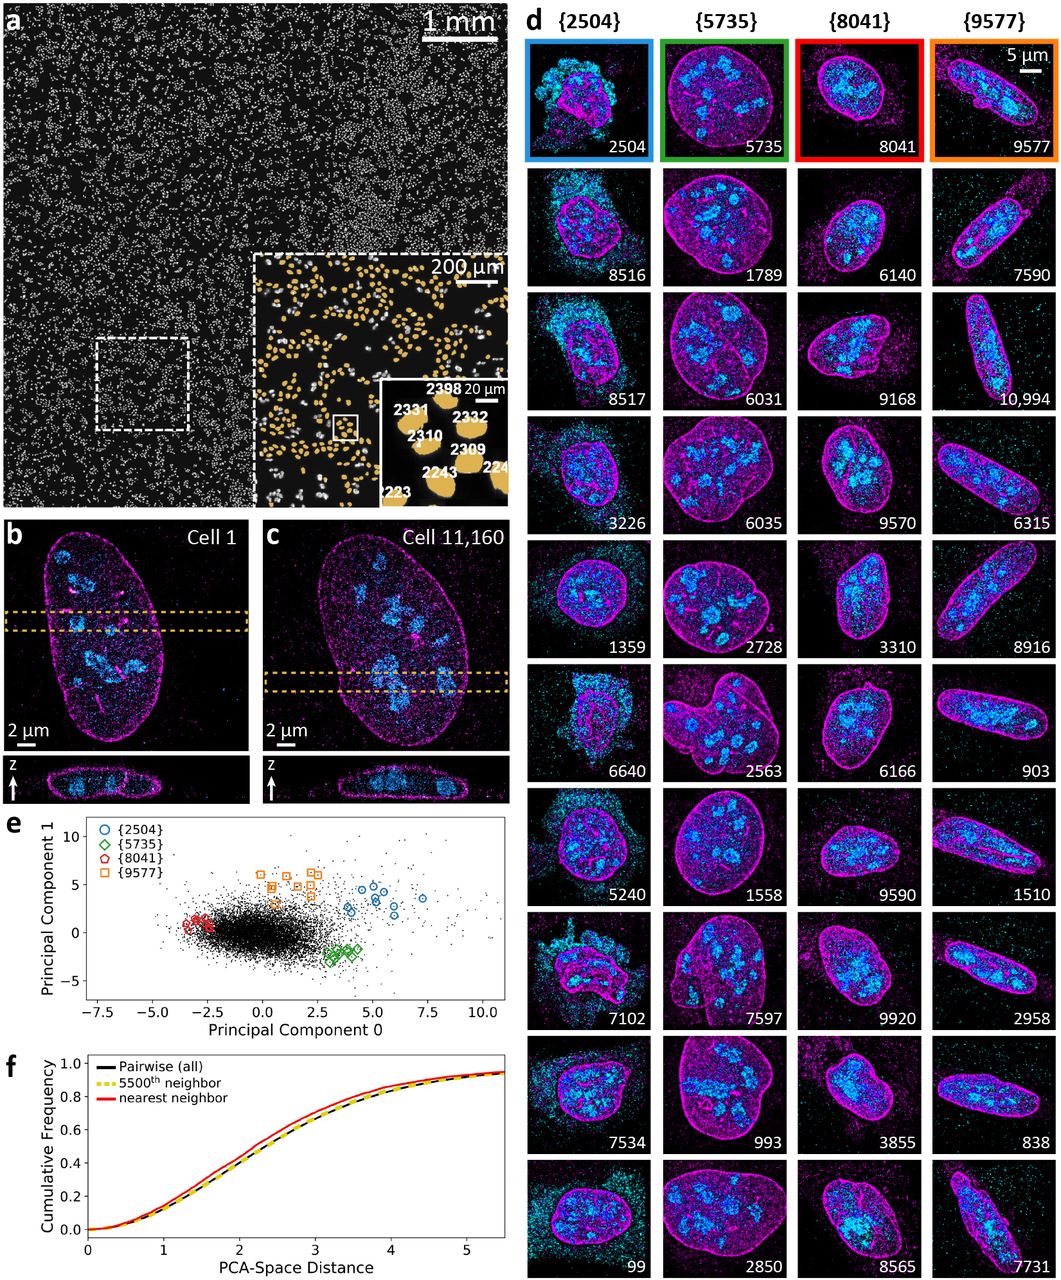
The combination of our microscope and analysis advances enables us to image not only individual FOVs at high speed as in Fig. 2, but 10,000 FOVs in a single day. To test this imaging mode, we plated U-2 OS cells on a coverslip and immuno-labeled their nuclear lamina (anti-lamin b1, AF647) and nucleoli (anti-NPM1, CF568). Automated imaging is performed by first scanning the coverslip in widefield mode and stitching together the images to create a mosaic image which can then be segmented and processed to generate a list of suitable FOVs for SMS imaging. The overview mosaic shown in Fig. 3A was acquired in 52 minutes, after which automated super-resolution imaging of the 11,160 detected nuclei commenced. Each detected nucleus was imaged in 9.44 seconds, with the objective piezo actuator stepped over an axial range of 4.4 m for an axial localization range of approximately 5 μm. The total imaging time for all 11,160 cells targeted was 1.2 days. 99.8% of target FOVs were successfully acquired (see Methods, Supplementary Video 1), resulting in a total of 3,589,123,170 fitted emitters from 75,431,069 raw frames (504,879,862 high precision localizations after combining molecules present in more than one of the biplane views and filtering).

3D Multicolor SMS imaging of 10,000 cells a day. (a) Overview mosaic image of U-2 OS cells on a coverslip, from which 11,160 fields of view were automatically detected for imaging. A magnified view of the dashed box in the overview image is shown in the large inset, with a further magnification shown inside the solid box. Nuclei that were queued and imaged are highlighted in yellow and their queue number displayed in the smaller inset. Each detected nucleus was automatically imaged, averaging 9.44 seconds per FOV, or 10,000 cells per 26.2 hours. The first and last nucleus imaged are shown in (b) and (c), respectively. (d) Thumbnail images of example nuclei. The top nucleus in each column was manually selected, and the remaining nuclei are the 9 closest to it in a 13-dimensional feature space describing the distribution of localizations in each FOV. Principle component analysis was performed on the same feature vectors used in (d) with the first 2 principle components plotted in (e). Each point represents a single nucleus, with points outlined by colored shapes corresponding to each of the nuclei shown in (d). (f) Relationship between shape and spatial proximity. The cumulative distribution of PCA-space distances between individual nuclei are shown, with the solid black curve representing all pairwise distances while the red and yellow curves represent PCA-space distances between the nearest, and 5500th-nearest spatial neighbors, respectively.
It is impractical to individually examine every image in a dataset comprising more than 11,000 images. To probe the structure of our data and relationships within it we employed automated feature analysis. We have constructed a flexible recipe architecture in PYME which allows us to assemble image and point-data analysis pipelines and thereby perform batch processing in parallel across an entire computer cluster. These recipes can facilitate complex analyses and hypothesis testing. After first running a recipe to render each SMS data set into a low-resolution image, we noticed a large variety of nuclear morphologies. In order to capture these differences, we ran another PYME recipe to calculate 13 morphological features directly from the point-data for each FOV (see Methods and Supplementary Fig. 10). Underneath each of four test nuclei (#2504, #5735, #8041, and #9577) in Fig. 3d, we display the nine nearest neighbors as measured in 13-dimensional feature space (see Methods). These neighbors are visually similar to our query nuclei, confirming that our choice of features can cluster similar nuclei. Plotting the first two principal components of our feature space against each other (Fig. 3e), we see a separation of the visually different cellular morphologies but no easily separable distinct classes. Identifying the cellular mechanisms behind this diverse spectrum of cell states is beyond the scope of this paper, but we note that high-throughput analysis is uniquely positioned to deliver insight on the rarer cell states (e.g. the highly elongated cells similar to cell 9577 or those with extra-nuclear nucleophosmin like cell 2504). Such cells are so infrequent that they would likely remain undetected in typical (N=10 to N=100) super-resolution sample sizes, and impractically laborious to investigate without automated imaging.
The imaged U-2 OS cells were seeded on the coverslip about 24 h before being fixed and stained. Whether due to the presence of “sibling” cells in which nuclear architecture might be correlated [17] or environmental similarities, we postulated that cells which are physically close to each other could also have similar morphologies. We found the physical nearest neighbor for each imaged cell on the coverslip [typical separation of 29±5 μm (median ± median absolute deviation)], calculated the distances in our PCA ‘shape-space’ between these neighboring cells, and compared this distribution with the pairwise PCA ‘shape distances’ between all cells. The resulting distributions of PCA distances between nearest-spatial-neighbors and all cells are shown as cumulative distribution functions in Fig. 3f, and histograms in the Supplementary Methods (see Supplementary Fig. 12). There is a small but statistically significant (Mann-Whitney U test, p = 3.1 × 10⁻²⁶) shift towards smaller PCA distances for nearest spatial neighbors when compared to the entire population of pairwise PCA distances, indicating that neighbors are indeed more likely to be similar. As a control, we performed the same test for widely separated neighbors, choosing to compare each cell with its 5,500th nearest spatial neighbor [typical separation of 3.2±0.5 mm (median ± median absolute deviation)]. In this case we were unable to detect a difference between the distribution of these PCA distances and all pairwise distances (Mann-Whitney U, p = 0.33). Although more experiments and analysis are needed to elucidate the biological origin of this observation, our experiment clearly demonstrates how a complete data analysis pipeline combined with automated, high-speed super-resolution imaging can detect subtle biological effects that require large sample sizes.
DISCUSSION
Super-resolution microscopy is becoming an increasingly popular tool for cell biology. It remains, however, a slow and complex multi-step operation – severely limiting its uptake and the problems to which it can be applied. In this paper we have demonstrated that multi-colour 3D SMS super-resolution can be performed both at high speed and with a high degree of automation. High-throughput SMS imaging generates a vast amount of data, and as a consequence poses some unique challenges. With our open-source platform for distributed storage and analysis we have addressed the fundamentally limiting problems of how to efficiently save the raw data, how to perform localization analysis in a timely fashion, keeping up with the high speed of data recording, and how to automatically post-process this data. This system of integrated optical hardware, computer hardware and software enabled us, as an example, to automatically image more than 10,000 mammalian cell nuclei, extract a range of morphological features from each nucleus and explore the variability and similarities within this cell population using statistical methods. We have, however, barely scratched the surface of mining the information-rich super-resolution data that can now be generated. New algorithms to analyze this data, taking the unique nature of localization-based super-resolution microscopy into account, is an area ripe for advancement.
The developments we present here open up a new and highly promising field of application for super-resolution imaging. Whole populations of mammalian cells can now be imaged and analyzed in a time frame (~1 day) that it previously took to image a handful of manually selected cells. Such population measurements have a number of major advantages: firstly, selection bias is substantially reduced by automatically choosing large numbers of cells rather than imaging a few hand-selected ones. Secondly, the large sample sizes obtained can reveal subtle differences in cellular characteristics that for smaller numbers often remain hidden in the noise of the natural cell-to-cell variability. Finally, rare phenotypes or events which can only be observed in a small fraction of cells can now be captured.
One such field of application is the study of chromatin architecture within the “4D Nucleome” [18]. Our high-throughput super-resolution microscopy approach fills a void between more traditional super-resolution microscopy which has been limited to tens of cells per day and biochemical approaches which often suffer from ensemble-averaging effects which make them blind to cell-to-cell variability. High-throughput SMS provides single-cell information for a whole population of cells. Unlike its diffraction-limited counterparts, it probes the same length scales as many of the biochemical reactions underlying the ‘omics’ approaches. As such, high-throughput SMS is uniquely positioned to bridge between imaging and biochemical approaches and support the integration of observations into consistent biological models. The same argument is true in other areas of biomedical research. Investigating the effects of libraries of small molecules or siRNAs, or identifying rare or subtle effects in larger cell populations at super-resolution is now a possibility.
METHODS
Cell Culture
U-2 OS (ATCC HTB-96) cells were grown in McCoys 5A Medium (30-2007, ATCC) supplemented with 10% fetal bovine serum (FBS; 1500-500, Seradigm) at 37°C with 5% CO2. IMR-90 (ATCC CCL-186) were grown in EMEM (30-2003, ATCC) supplemented with 10% FBS and PenStrep (15140-122, Gibco) at 37°C with 5% CO2. COS-7 (ATCC CRL-1651) cells were grown in DMEM (21063-029, Gibco) supplemented with 10% FBS (10438-026, Gibco), and sodium pyruvate (11360-070, Gibco) at 37°C with 5% CO2.
Microtubule and ER Immunofluorescence Sample Preparation
A transient transfection of mEmerald-Sec61beta was used to label ER membranes (mEmerald-Sec61-C-18; a gift from Michael Davidson, Addgene plasmid #54249; http://n2t.net/addgene:54249; RRID:Addgene_54249) COS-7 cells (ATCC batch #63624240) were electroporated with mEmerald-Sec61beta then seeded onto a 40 mm round coverslip and grown overnight. Prior to seeding with cells, the coverslip was sonicated for 15 minutes in KOH, rinsed 3 times with Milli-Q water, sterilized with 100% ethanol, treated with poly-L-lysine (P4707, Sigma-Aldrich) for 10 minutes, and then rinsed 3 times with PBS. The cells were fixed in 3% paraformaldehyde (PFA; 15710, Electron Microscopy Science) + 0.1% glutaraldehyde (GA; 16019, Electron Microscopy Science) diluted in phosphate buffered saline (PBS) for 15 minutes and then rinsed 3 times with PBS. The cells were permeabilized (PBS + 0.05% IGEPAL CA-630 + 0.05% Triton X-100 + 0.1% bovine serum albumin (BSA, 001-000-162, Jackson ImmunoResearch)) for 3 minutes and then rinsed 3 times with PBS. Following permeabilization, the cells were incubated in blocking buffer (PBS + 0.05% IGEPAL CA-630 + 0.05% Triton X-100 + 5% normal goat serum (005-000-121,Jackson ImmunoResearch)) for 1 hour. The primary antibodies mouse anti--tubulin (T5168, Sigma-Aldrich) and rabbit anti-GFP (A-11122, Invitrogen) were incubated on samples overnight at 4°C, at 1:1000 and 1:500, respectively. Cells were then washed 3 times for 5 minutes each with wash buffer (PBS + 0.05% IGEPAL CA-630 + 0.05% Triton X-100+ 0.2% BSA). Samples were incubated with secondary antibodies, anti-mouse labeled with CF568 (20109, Biotium) and anti-rabbit labeled with AF647 (A21245, Invitrogen), for 1 hour at room temperature at 1:1000 and then washed 3 times for 5 minutes each with wash buffer. Finally the samples were post-fixed with 3% PFA + 0.1% GA for 10 minutes and then rinsed 3 times with PBS.
Lamin and Nucleolus Immunofluorescence Sample Preparation
U-2 OS cells were seeded onto ozone-cleaned 40 mm round coverslips and grown overnight. For lamin and nucleolus labeling, U-2 OS cells were fixed with 4% PFA for 15 minutes, rinsed 3 times with PBS, permeabilized for 3 minutes, rinsed 3 more times, and then incubated with blocking buffer (as above) for 1 hour. The sample was sequentially labeled starting with mouse anti-nucleophosmin antibody (NB600-1030, Novus Biologicals) at 1:1000 overnight at 4 °C. The following day the cells were washed 3 times for 5 minutes each and then incubated with anti-mouse antibody labeled with AF647 (A21237, Invitrogen) for 1 hour at room temperature. Then the rabbit anti-lamin b1 antibody (ab16048, Abcam) was incubated with the samples overnight at 4°C. The cells were washed with wash buffer (as above) 3 times for 5 minutes each and then anti-rabbit antibody labeled with CF568 (20099, Biotium) incubated with the samples for 1 hour at room temperature. Finally, the cells were washed with wash buffer for 3 times 5 minutes each and then rinsed.
Mitochondria and Nucleoid Immunofluorescence Sample Preparation
For mitochondria and mitochondrial nucleoid labeling, U-2 OS cells grown and seeded as described above and were then fixed for 1 h with 4% PFA. Then the samples were sequentially labeled starting with a mouse anti-dsDNA antibody (ab27156, Abcam) incubated overnight at 4°C and goat anti-mouse CF568ST secondary antibody (20800, Biotium) for 1 h at room temperature followed by rabbit anti-TOM20 antibody (ab78547, Abcam) incubated overnight at 4°C with goat anti-rabbit AF647 secondary antibody (A21245, Invitrogen) for 1 h at room temperature. Both primaries and secondaries were used at a dilution of 1:1000. The sample was post-fixed with 3% paraformaldehyde (PFA; 15710, Electron Microscopy Science) + 0.1% glutaraldehyde (GA; 16019, Electron Microscopy Science) diluted in phosphate buffered saline (PBS) for 10 minutes and then rinsed 3 times with PBS.
LAD FISH and Lamin Immunofluorescence Sample Preparation
To fluorescently label lamina-associated domains (LADs) with FISH probes, we first downloaded LAD coordinates from three previous publications [19–21] and chose two common regions that were identified as LADs by all three studies. The chosen LAD regions are both between 300 and 310 kb in genomic lengths, and are both within single topologically associating domains (TADs) based on previously reported TAD coordinates [22]. The genomic coordinates of the chosen LADs are: Chr5:115508197-115813276 (LAD1), and Chr13: 24405079-24709084 (LAD2) (all coordinates are based on genome assembly hg18.) We then designed 3725 and 2564 oligonucleotide probes (see Supplementary Spreadsheet) that targeted the two LADs, respectively, and synthesized the probes. The probe design and synthesis procedures were similar to those in a previous report [23] with only minor modifications. Briefly, we designed the template probe sequences using a custom computation pipeline [23] and generated complex pools of probes using array-based oligo library synthesis [24–26] followed by a high-yield enzymatic amplification approach [2, 27]. We first designed template probe libraries for the synthesis of our probe sets. Each oligo in our template probe libraries contained: i) a 20-nucleotide (nt) forward priming region for library amplification, ii) a 30 nt targeting region for in situ hybridization to the target chromosomal DNA sequence, iii) a 10 nt linker region, and iv) a 20 nt reverse priming region for library amplification. The sequences of the 20 nt forward and reverse priming regions were chosen from random sequences [27] with constraints to ensure their PCR priming performance, and further blasted against the human genome with BLAST+ [28] to ensure their lack of significant homology to the genome. The 10 nt linker sequences were cropped from other 20 nt sequences generated the same way as above. The 30 nt targeting regions were generated with the software OligoArray2.1 [29] and BLAST+ [28] as described previously [23]. The designed template probe libraries were ordered from CustomArray, Inc as oligo pools. We then synthesized the FISH probe sets from the template libraries following a previously published protocol that involved limited-cycle PCR, in vitro transcription, reverse transcription, alkaline hydrolysis and purification [23, 27]. An Alexa Fluor 647 dye molecule was conjugated to each FISH probe through the reverse transcription primer [23].
IMR-90 cells (ATCC CCL-186) were grown in EMEM (30-2003, ATCC) supplemented with 10% FBS and PenStrep (15140-122, Gibco) at 37°C with 5% CO2. IMR-90 cells were plated on 40 mm diameter, #1.5 coverslips (Bioptechs, 0420-0323-2), and further cultured for 3 to 5 days to reach a confluency of ~75%. All following procedures were performed at room temperature unless stated otherwise. The cells were fixed in cytoskeletal fixation buffer (2.5% formaldehyde, 10 mM MES, 138 mM KCl, 3 mM MgCl2, 2 mM EGTA, 0.1 g/mL sucrose in DPBS) at room temperature for 25 min, washed twice with DPBS for 2 min each, permeabilized and blocked with blocking buffer (3% BSA, 0.2% v/v Triton X-100 in DPBS) for 30 min with gentle shaking, and incubated with lamin A/C primary antibody (Cell Signaling Technology, 4C11) in antibody dilution buffer (1% BSA, 0.2% v/v Triton X-100 in DPBS) at a concentration of 1:200 at 4°C overnight with gentle shaking. The cells were then washed with wash buffer (0.05% v/v Triton X-100 in DPBS) for three times at room temperature and incubated with biotin-labeled secondary antibody (Jackson ImmunoResearch Laboratories, 115-065-003) in antibody dilution buffer (1% BSA, 0.2% v/v Triton X-100 in DPBS) at a concentration of 1:1000 for 1 h with gentle shaking, washed with wash buffer (0.05% v/v Triton X-100 in DPBS) for three times, post-fixed with 4% formaldehyde for 10 min and washed with wash buffer (0.05% v/v Triton X-100 in DPBS) for three times. Next the cells were treated with 0.1 M HCl for 5 min, washed twice with DPBS, digested with 0.1 mg/mL RNAse A (AmericanBio, AB12023-00100) in DPBS for 45 min at 37°C, washed twice in 2xSSC, and incubated for 30 min in pre-hybridization buffer (2xSSC, 50% formamide, and 0.1% v/v Tween 20). For probe hybridization, 25 μL of hybridization buffer, containing 2xSSC, 50% formamide, 20% dextran sulfate, and a LAD probe set at 4 μM concentration were dropped on top of a glass slide. The coverslip with cells was flipped and placed on top of the slide. The assembly was placed on top of an 80°C heat block for 3 min, and then incubated for 15-18 h at 37°C in a humid chamber. The cells were then washed twice with 0.1% v/v Tween 20 in 2xSSC at 60°C for 15 min each, and once more for 15 min. We then switched the sample buffer to DPBS and incubated it with CF568-conjugated streptavidin (Biotium, 29035) in antibody dilution buffer (1% BSA, 0.2% v/v Triton X-100 in DPBS) at a concentration of 1:1000 for 1 h with gentle shaking. The sample was then washed with DPBS for 3 times, each for 5 min. The sample was additionally incubated with Hoechst 33342 at a concentration of 0.4 μg/mL in DPBS for 5 min and washed twice with DPBS. We then switched buffer to 2xSSC and prepared the sample for STORM imaging.
Combined TAD and LAD FISH Sample Preparation
The design and synthesis of the LAD probes are the same as described above. FISH probes targeting Chr22 were designed and synthesized as previously reported [23], except that the reverse transcription primers for Chr22 probes were conjugated with a 5’ biotin and as a result all Chr22 FISH probes were conjugated with biotin.
The two-color FISH samples were also prepared with a protocol similar to the one described previously [23]. IMR-90 cells (ATCC CCL-186) were grown in EMEM (30-2003, ATCC) supplemented with 10% FBS and PenStrep (15140-122, Gibco) at 37°C with 5% CO2. IMR-90 cells were plated on 40 mm diameter, #1.5 coverslips (Bioptechs, 0420-0323-2), and further cultured for 3 to 5 days to reach a confluency of ~75%. All following procedures were performed at room temperature unless stated otherwise. The cells were fixed for 10 min with 4% formaldehyde in Dulbeccos phosphate-buffered saline (DPBS), washed twice with DPBS, treated for 10 min with freshly made 1 mg/μL sodium borohydride (Sigma, 480886) solution, washed twice with DPBS, permeabilized for 10 min with 0.5% v/v Triton X-100 (Sigma, T8787) in DPBS, washed twice with DPBS, treated with 0.1 M HCl for 5 min, washed twice with DPBS, and digested with 0.1 mg/mL RNAse A (AmericanBio, AB12023-00100) in DPBS for 45 min at 37°C. The cells were then washed twice in 2x saline-sodium citrate buffer (SSC) (Ambion, AM9763) and incubated for 30 min in pre-hybridization buffer (2xSSC, 50% formamide (Ambion, AM9342) and 0.1% v/v Tween 20 (Fisher, BP337)). For probe hybridization, 25 μL of hybridization buffer, containing 2xSSC, 50% formamide, 20% dextran sulfate (Sigma, D8906-50G), and probe sets targeting both LAD1 and Chr22 at 4 μM for each set were dropped on top of a glass slide. The coverslip with cells was flipped and placed on top of the slide so that the cells were in contact with the hybridization buffer. The slide-coverslip assembly was placed on top of an 80°C heat block for 3 min, and then incubated for 15-18 h at 37°C in a humid chamber to allow hybridization of the FISH probes to their genomic targets. The cells were then washed twice with 0.1% v/v Tween 20 in 2xSSC at 60°C for 15 min each, and once more at room temperature for 15 min. We then switched the sample buffer to DPBS and incubated the cells with blocking buffer (3% BSA, 0.2% v/v Triton X-100 in DPBS) at room temperature for 30 min. The cells were then incubated with mouse anti-biotin primary antibody (Jackson ImmunoResearch Laboratories, 200-002-211) in antibody dilution buffer (1% BSA, 0.2% v/v Triton X-100 in DPBS) at a concentration of 1:1000 at 4 _C overnight with gentle shaking and washed with wash buffer (0.05% v/v Triton X-100 in DPBS) for three times at room temperature. We then incubated the sample with CF568-conjugated secondary antibody (Biotium, 20109) at a concentration of 1:1000 in antibody dilution buffer (1% BSA, 0.2% v/v Triton X-100 in DPBS) for 1 h with gentle shaking. The sample was then washed with wash buffer (0.05% v/v Triton X-100 in DPBS) 3 times. The sample was additionally incubated with Hoechst 33342 at a concentration of 0.4 μg/mL in DPBS for 5 min and washed with DPBS twice. We then switched buffer to 2xSSC and prepared the sample for STORM imaging.
High-Throughput SMS Microscope
The optical setup, shown in Fig. 1a is detailed in Supplementary Note I.A and Supplementary Fig. 1), and discussed here only briefly. The microscope hardware differs from conventional SMS microscopes in that an sCMOS camera and two high-power (2W) excitation lasers (560 nm and 642 nm) are used. A cylindrical lens to provide astigmatism is combined with a biplane module to extend the axial localization range. The laser lines are coupled into a multimode fiber, which is vibrated to average out speckle and achieve a uniform intensity profile at the fiber exit which is imaged into the sample. A fast objective piezo actuator enables axial scanning, and a motorized sample stage accommodates lateral sample movement on the order of 100 mm. The microscope additionally has a custom-built focus lock, where a near-infrared laser is reflected off the coverslip at an angle such that the reflected beam position can be monitored by an additional camera. This position indicates the distance between the objective and the coverslip, and can be servo-controlled.
Imaging
All samples were imaged in a STORM buffer, which consisted of 0.49 kU/mL glucose oxidase, 0.98 kU/mL glucose catalase, 0.14 M 2-mercaptoethanol, 2.5 mM Tris at pH 8, 2.5 mM NaCl, and 0.28 M Glucose in milli-q water. Samples were mounted and imaged in Bioptechs FCS2 flow chambers with the microaqueduct slide flipped upside down such that the flow input/output tubes were sealed. Before mounting the sample, the edges were scraped with a scalpel to remove cells which would interfere with ideal sealing. We used 0. 5 mm thick circular gaskets, overfilled the chamber with 500 μL of STORM buffer and rinsed the coverslip in 200 μL of STORM buffer before mounting. Once the coverslip was in place, it was flattened (and excess buffer was removed) by pressing a wipe against it using a flat plastic dish.
All SMS imaging shown in Figs. 1 to 3 was performed at a camera frame rate of 800 Hz. The 560 nm and 642 nm laser intensities delivered to the samples were approximately 71 kW/cm2 and 51 kW/cm2 for the lamin B1 and NPM1 sample, 41 kW/cm2 and 51 kW/cm2 for the lamin A/C and LAD pool 2 sample, 61 kW/cm2 and 51 kW/cm2 for the α-tubulin and Sec61β sample, 38 kW/cm2 and 51 kW/cm2 for the dsDNA and TOM20 sample, and 41 kW/cm2 and 61 kW/cm2 for the Chromosome 22 TADs and LAD pool 1, respectively. 405 nm activation light was not used during SMS data acquisition.
The 3D images of the α-tubulin and Sec61β sample, and the TOM20 and dsDNA sample, were acquired without z-stepping during recording. The remaining samples were imaged with 2 or 6 cycles of 7 interwoven up then down z-steps to obtain even axial localization distribution over the thicker volumes.
For automated imaging, the sample was allowed to settle for 15 min with the focus servo turned on before the preview scan was initialized. The preview scan is performed using the same objective as our SMS imaging, moving the stage in discrete steps of 20 um before acquiring an image with 4 × 4 pixel binning, resulting in 48 × 48 pixel images. These individual preview FOVs were acquired with 2 ms exposure times and either ~600W/cm2 of 560 nm light exciting the lamin stain for the lamin B1 and NPM1 sample, or ~90W/cm2 of 405 nm light exciting Hoechst 33342 for the lamin A/C and LAD pool 2 sample, and the Chr 22 TAD and LAD pool 1 sample. The preview FOVs were stitched together into a mosaic coverslip overview image. Automatic selection of FOVs for SMS imaging was then performed by generating a binary mask from the mosaic overview image using intensity thresholding, and then rejecting regions which did not meet empirical size limits. These limits were chosen to detect well-separated interphase nuclei. The preview scan took approximately 52 minutes for the 300 × 300 FOV (6 × 6 mm) scan used for the Lamin B1 and NPM1 imaging in Fig. 3.
SMS camera frames were compressed on the instrument computer and spooled to the cluster where localization analysis was automatically initiated for each FOV once its image series was fully received by the cluster.
Lamin and Nucleophosmin Feature Similarity and PCA
Of the 11,160 series imaged, 11,136 were spooled and localized during the same time, with analysis being run post-facto on an additional 9 series for a total of 11,145 SMS images. Spooling failed for 15 images. Of the 1145 successful images, 3 were rejected due to an insufficient number of localizations. Inspection of the rejected nuclei indicated that they were either very far out of focus or close to a bright object on the coverslip. For each of the remaining 11,142 lamin and nucleophosmin SMS point clouds, 13 metrics were calculated and used to create a feature vector. These metrics are calculated directly from the localizations and are described in the supplement (see Fig. 10). The feature vector was normalized by the interquartile range along each metric and the nearest 9 neighbors in feature-space were found for each point cloud. Several nuclei were manually selected (#2504, #5735, #8041, and #9577) and they are displayed alongside their nearest neighbors in the 13-dimensional normalized feature space in Fig. 3d.
This 11,142 × 13 array was then reduced to size 11,142 × 2 using principal component analysis (PCA) limited to two components and the features for each point cloud were projected onto this 2D basis and plotted. A zoomed out version of the PCA scatter plot shown in Fig. 3e is shown in the supplement.
Neighbor Similarity Testing
The lateral position of the stage was recorded in the metadata for each imaged field of view. Notably, 5 of the 11,142 fields of view which had failed their initial spooling and been spooled with partial metadata could not be used for this analysis (FOV #1437, #1653, #7767, #10042, and #10355). For the remaining 11,137 fields of view, we used these positions to find each cells spatial neighbors sorted by proximity from nearest neighbor to farthest neighbor.
We then calculated the PCA-space pairwise distances, or the distances between each of the 11,137 fields of view and every other field of view (N=62,010,816). We then generated two subsets of this distribution: the PCA-space distances between each field of view and its nearest spatial neighbor (N=11,137), and the PCA-space distances between each field of view and its 5500th nearest spatial neighbor (N=11,137).
CODE AVAILABILITY
The code for distributed data storage and analysis is released under the GNU General Public License v3 as part of the python-microscopy project (python-microscopy.org, bitbucket.org/david_baddeley/python-microscopy) with high-throughput specific installation instructions available at python-microscopy.org/doc/cluster/cluster_install.html. Code for GPU acceleration of single-molecule fitting is available under an academic use license from github.com/barentine/pyme-warp-drive. The LabVIEW acquisition software can be obtained from the authors upon reasonable request. Please contact the authors for alternative licensing arrangements.
DATA AVAILABILITY
The 3D localizations, calibration files, and raw blinking movies for all series in Fig. 2, and Cell #1, #2504, #5735, #8041, #9577, and #11,160 from Fig. 3 (and 3D localizations for the remaining cells) will be publicly available through the 4D Nucleome data portal. Any additional data from this work can be obtained through the authors upon reasonable request.
AUTHOR CONTRIBUTIONS
Y.L. and J.B. designed the optical hardware of the microscope. Y.L. built the optical instrument. M.R.G., A.E.S.B. and D.B. designed, set up and implemented the computer cluster. D.B. designed the distributed storage architecture and compression algorithm. D.B. and L.B. designed and implemented the cluster task distribution. A.E.S.B. and D.B. developed the GPU acceleration code. S.W. and M.L. designed the FISH probes. P.K., M.L. and S.W. optimized sample preparation protocols and prepared samples. A.E.S.B. and Y.L. performed imaging experiments. A.E.S.B., Y.L. and D.B. performed post-localization analysis. All authors contributed to writing the manuscript.
COMPETING INTERESTS
J. B. discloses a significant financial interest in Bruker Corp. and Hamamatsu Photonics.
ACKNOWLEDGEMENTS
We thank Lena Schroeder and Mark Lessard for helpful discussions and technical assistance. This work was primarily supported by a 4D Nucleome grant from the National Institutes of Health (U01 DA047734 to J.B. and D.B.). J.B. acknowledges support from NIH grant P30 DK045735 (to Robert Sherwin). A.E.S.B. acknowledges support by a NIH training grant (T32 GM008283) and training at the Computational Image Analysis in Cellular and Developmental Biology Course of the Marine Biology Laboratory (which was supported by NIH R25 GM103792).
Footnotes
Minor corrections


