

SUMMARY
Understanding the mechanisms controlling invasive spread of normal and transformed cells is central to understanding diverse processes including cancer progression. Here, we report that Yes-associated protein (YAP), a central transcriptional regulator implicated in controlling organ and body size, modulates a Rho-GTPase switch that drives cellular migration by directly transactivating the Rac1-GEF protein TRIO. Additionally, YAP and TRIO activate STAT3 to promote invasive behavior. While we find this YAP-dependent infiltrative program in many cell types, it is particularly enhanced in a patient specific way in the most common malignant brain tumor, glioblastoma (GBM), where hyperactivation of the YAP-mediated TRIO and STAT3 network also confers poor patient outcome and up-regulation of genes associated with the Mesenchymal subtype of GBM. Our analysis suggests that the YAP-TRIO-STAT3 signaling network identified in this study is a ubiquitous regulator of invasive cell spread in a variety of normal and pathological contexts.
INTRODUCTION
Cell migration is a tightly regulated process integrating multiple extracellular cues through intracellular signaling networks, which in turn define the extent of cell polarization and the persistence and speed of locomotion. Extensive studies over the past two decades identified the Rho family of small GTPases, including Rac1 and RhoA, as key regulators of these processes. Ongoing analysis of regulation of these GTPases and their interaction(Sahai and Marshall, 2002) suggest that they form a molecular circuit integrating the inputs from multiple other signaling networks. Insight into these mechanistic links can help identify important molecular components, whose activity can determine the outcome of cell migration dependent events in development and disease. Ultimately, unravelling these converging pathways will clarify the determinants of cell migration, and may offer new therapeutic paradigms against the aberrant invasion seen in many cancers. Targeting migration pathways may be particular effective against cancer where most deaths are caused by invasive and metastatic cells rather than the primary tumor mass.
Since many extracellular cues affecting cell migration also guide decisions such as cellular identity, it is likely that migratory behaviors are tightly integrated with transcriptional decision networks. Notably, Yes-associated protein (YAP) is known to integrate many inputs (Hippo signaling, E-Cadherin, mechanical cues etc) to orchestrate diverse cellular functions including growth, apoptosis, and migration, as well as cancer cell invasion and metastasis(Calvo et al., 2013; Chen et al., 2012; Dong et al., 2007; Dupont et al., 2011; Lamar et al., 2012; Overholtzer et al., 2006; Shah et al., 2017; Wei et al., 2018). From these studies, YAP has emerged as a proto-oncogene frequently overexpressed in a variety of cancers, including a particularly aggressive and infiltrative form of brain cancer, glioblastoma (GBM)(Orr et al., 2011; Overholtzer et al., 2006; Pan, 2010; Shah et al., 2017; Wei et al., 2018; Xu et al., 2010). However, it is not known how YAP expression and activity regulates the molecular networks controlling cell migration and invasion, and whether this role may enhance the progression of aggressive cancers. Here, we demonstrate that YAP binds an enhancer region to promote transcription of TRIO, a guanine nucleotide exchange factor (GEF) protein that can regulate Rho-family GTPases(Schmidt and Debant, 2014). YAP-mediated TRIO up-regulation activates Rac1 and inhibits RhoA to increase migration speed. In addition, an increase in YAP-mediated TRIO expression leads to activation of STAT3 to confer invasive potential. These findings reveal YAP-TRIO signaling as a central regulator of cell dispersion that promotes mobility through a Rho-GTPase switch and invasion through STAT3. In addition, our work provides new insights into the biology of aggressive cancers, including the potential prognostic relevance of YAP-TRIO-STAT3 signaling in glioblastoma.
RESULTS
YAP regulates migratory capacity
To analyze putative mechanisms of YAP-mediated control of migration and invasion, we used primary patient-derived cultures of human glioblastoma (GBM) cells due to a highly aggressive invasive spread of these cells in vivo that may be associated with YAP hyperactivity (Bell and Karnosh, 1949; Chaichana et al., 2012; Dandy, 1928; Matsukado et al., 1961; Orr et al., 2011). In addition, we explored whether these YAP-driven migratory and invasive mechanisms are conserved in non-pathological systems using cells from two different tissues of origin: adult human brain astrocytes (NHA) and adult human breast cells (MCF10A).
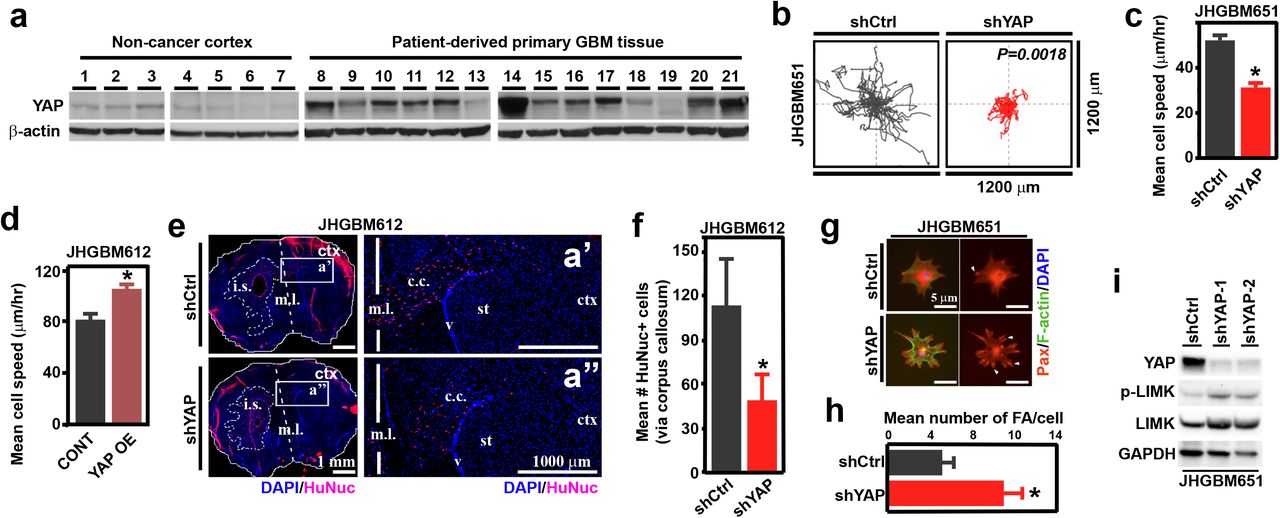
Using intraoperatively obtained primary GBM tissues from patients, we found that YAP protein expression was indeed elevated and transcriptionally active in a majority of GBMs examined (Fig. 1a, Table 1, Fig. S1a, b). From these primary GBM tissues, we derived primary cultures (JHGBM612, JHGBM640, JHGBM651, JHGBM1A) and confirmed that these cell lines had similar YAP protein levels as the primary GBM tissues from which they were derived (Fig. S1c). To test whether this elevated YAP expression contributes to changes in cell migration in these GBM cells, we used multiple shRNA constructs to specifically inhibit YAP expression (Fig. S1d, e). We then used this perturbation to investigate the migration of cells plated at low density on a laminin- (NHA and GBM cell lines) or collagen-coated (MCF10A) 2D surfaces. We followed the migratory response at 10 minute intervals for 8 hours. Following shRNA-mediated stable knockdown of YAP (shYAP) using two different targeting sequences (shYAP/shYAP-1, shYAP-2), we observed a significant decrease in cell displacement and migration speed when compared to control non-targeting vector (shCtrl) in all GBM cell lines and non-neoplastic NHA and MCF10A cells (Fig. 1b, c, Fig. S1f, g, Movie S1). Conversely, stable overexpression of a constitutively active YAP (YAP OE) versus control vector (CONT) in GBM (JHGBM612 and JHGBM1A) and NHA cells showed that YAP up-regulation was sufficient to increase migration speed (Fig. 1d, S1h, i). To determine whether YAP affects infiltrative cell migration and spread in vivo, we used a murine intracranial xenograft tumor model of human brain cancer(Lee et al., 2006; Pollard et al., 2009), which recapitulated the cellular infiltration along the corpus callosum seen in the donor patient tumor (Fig. S1j). To do this, we injected 150,000 shCtrl or shYAP JHGBM612 cells into the striatum of the right hemisphere (at pre-determined coordinates from the bregma; see Experimental Procedures) of immunocompromised mice, and quantified the number of human GBM cells infiltrating along the corpus callosum into the left hemisphere 5 weeks post-injection. We observed significantly fewer shYAP cells infiltrating the contralateral hemisphere than shCtrl JHGBM612 cells (Fig. 1e, f, Fig. S1k). These findings, coupled with the in vitro observations, suggest that YAP can enhance infiltrative cell migration in different micro-environmental contexts.

a, Immunoblots of YAP expression in human non-cancer cortex and primary glioblastoma patient tissues. b, Migration pattern and average distance traveled by shCtrl or shYAP JHGB651 cells in vitro on 2D surface. (n = 20) c, d, Mean migration speed of shCtrl versus shYAP JHGBM651 cells or CONT versus YAP OE JHGBM612 cells. e, Left: Human Nuclei/DAPI immunofluorescent images of mouse brain coronal sections after injections of shCtrl or shYAP JHGBM612 cells (i.s. = injection site). Dashed lines outline the bulk tumor margins on the ipsilateral hemisphere. White boxes outline the area magnified in the right panel. Right: magnified images of the corpus callosum in the right hemisphere (m.l. = midline, c.c. = corpus callosum, st = striatum, ctx = cortex). See also Supplemental Fig. 1j, k. f, Total number of shCtrl or shYAP cells invading past the midline into the contralateral hemisphere. (n = 3 mice per group), *=P<0.05, Student’s t-test. g, Representative Paxillin/F-actin/DAPI immunofluorescent images of shCtrl or shYAP JHGBM651 cells. h, Mean number of focal adhesion in shCtrl or shYAP JHGBM651 cells; normalized per cell. i, Representative immunoblot of YAP, p-LIMK, and LIMK expression in shCtrl, shYAP-1 or −2 JHGBM651 cells. All error bars are s.e.m. Black * = P<0.05, Wilcoxon Rank-Sum test.
We then sought to identify the mechanism by which YAP modulates migratory behavior in non-neoplastic and cancer cells. To do so, we examined the regulation of small Rho GTPases, which are implicated as central regulators of cell motility(Sahai and Marshall, 2002). Interestingly, we found that YAP knockdown increased the number and area of focal adhesions, strongly affecting the shape of the cells (Fig. 1g, h, Fig. S1l) in a pattern reminiscent of the focal adhesion assembly phenotype observed upon RhoA hyperactivation(Ridley and Hall, 1992). Consistent with pronounced focal adhesion assembly, shYAP JHGBM651, JHGBM612, JHGBM1A, NHA, and MCF10A cells all exhibited increased phosphorylation of LIM-kinase, a downstream target of RhoA-Kinase (ROCK), a major effector of RhoA(Sahai and Marshall, 2002), when compared with shCtrl cells (Fig. 1i, Fig. S2a). From these results, we conclude that YAP regulates cytoskeletal organization and dynamics to potentiate cellular motility in vitro and in vivo.
YAP regulates migration through a Rho-GTPase switch
To better understand the regulation of RhoA by YAP, we measured its GTP load through G-LISA assays. We observed a significant increase in RhoA-GTP levels after YAP knockdown in JHGBM651 and NHA cells (Fig. 2a, Fig. S2b). Based on this data, we sought to test the relevance of RhoA-ROCK activity on cell speed. We found that pharmacologic inhibition of ROCK I/II using either Y27632 or H1152 restored the migration speed of shYAP-1 and −2 cells in a dose-dependent manner while having no effect on shCtrl cells (Fig. 2a, Fig. S2c, Movie S2). Furthermore, treatment with Y12732 or H1152 decreased the phosphorylation of nonmuscle myosin II (NMII), confirming the inhibition of ROCK activity (Fig. S2d). These results demonstrate that YAP is able to modulate RhoA-ROCK activity, and that ROCK inhibition is sufficient to rescue migratory speed of YAP knockdown cells. These results suggest that YAP promotes migration at least in part by suppressing RhoA-ROCK activity.

a, G-LISA analysis of RhoA-GTP levels in shCtrl or shYAP JHGBM651 cells. b, Mean migration speed of shCtrl or shYAP JHGBM651 cells treated with increasing doses of the ROCK inhibitor Y27632. c, G-LISA analysis of Rac1-GTP levels in shCtrl or shYAP JHGBM651 cells. d, Mean migration speed of shCtrl or shYAP JHGBM651 cells treated with increasing doses of the Rac1-GEF inhibitor NSC23766. e, Mean speed of shCtrl and shYAP JHGBM651 cells treated with no drug, Y27632, or NSC23766 for 3 or 6 hours as indicated. Wilcoxon Rank-Sum test between 1-2 hrs and 4-5 hrs, * = P<0.05. f, G-LISA analysis of Rac1-GTP levels in shCtrl or shYAP JHGBM651 cells treated with vehicle or Y27632. g, G-LISA analysis of RhoA-GTP levels in shCtrl or shYAP JHGBM651 cells treated with vehicle or NSC23766. h, Representative immunoblot of YAP and RhoA expression in shCtrl or shYAP JHGBM651 cells transfected with siCtrl or siRhoA. i, Mean migration speed of shCtrl or shYAP JHGBM651 cells transfected with siCtrl or siRhoA. All error bars are s.e.m. Black * = P<0.05, Wilcoxon Rank-Sum test. Colored * = significant versus no drug, # = significant versus shCtrl cells; P<0.05, ANOVA, Tukey’s multiple comparison test (j, m, n-q).
YAP can modulate the activity of RhoA either directly or indirectly. For instance, prior studies suggested that another small Rho-GTPase, Rac1, can antagonistically regulate RhoA(Parri and Chiarugi, 2010; Wildenberg et al., 2006), raising the possibility that modulation of RhoA activity by YAP might involve Rac1. We indeed found that Rac1-GTP levels were reduced after YAP knockdown (Fig. 2c, Fig. S3a). Thus, we inquired whether changes in Rac1 activity accounted for the decreased migratory speed of shYAP cells. We found that a pharmacological inhibitor of Rac1-GEFs, NSC23766, significantly decreased the migration speed of shCtrl cells in a dose-dependent manner, but not that of shYAP-1 or −2 cells (Fig 2d, Fig. S3b, Movie S3). Collectively, these findings demonstrate that YAP regulates the small Rho-GTPase network controlling cellular polarity and migration, leading to activation of Rac1 and inhibition of RhoA in normal and cancer cells (Fig. S3c).
We next sought to clarify the precise regulatory mechanisms of YAP interaction with Rac1 and RhoA, given multiple scenarios of mutual regulation between the components. Our results suggest three possible hypotheses: 1) YAP activates Rac1 to inhibit RhoA, 2) YAP inhibits RhoA to activate Rac1, or 3) YAP independently modulates both Rac1 and RhoA. To test these hypotheses, we applied the logic of epistatic analysis by using pharmacological inhibitors of these small Rho-GTPases in lieu of dominant negative mutants. More specifically, we used ordered perturbation of the network components to deduce the regulatory hierarchy (further details and logic of the experiment are presented in Fig. S4a). First, we verified that the migration speeds of shCtrl and shYAP-1or −2 cells were stable over a 6-hour period with or without treatment using Y27632 or NSC23766 (Fig. 2e, Panels I-III, Fig. S4b). Next, we used one or both pharmacological inhibitors of Rac1 and ROCK to determine how these signaling intermediates regulate each other in these cells. Specifically, we treated shCtrl and shYAP-1 or −2 cells with either the Rac1-GEF inhibitor or the ROCK inhibitor for 3 hours, followed by addition of the other inhibitor for the next 3 hours (Fig. 2e, Panels IV-V, Fig. S4b). The order of inhibitor treatments was indispensable in this analysis to ascertain which one of the aforementioned hypotheses is valid (Fig. S4a). Remarkably, we found that in cells treated to inhibit ROCK, subsequent inhibition of Rac1-GEF did not further alter the migration speed in either shCtrl or shYAP cells (Fig. 2e, Panel IV, Fig. S4b). However, ROCK inhibition after the initial Rac1-GEF inhibition rescued the cell migration speed in both shCtrl and shYAP cells (Fig. 2e, Panel V, Fig. S4b). Altogether, these results strongly favored the model in which YAP activates Rac1 to inhibit ROCK signaling, resulting in enhancement of cell migration.
We then investigated the effect of the Rac1-GEF or ROCK inhibition on the activity of RhoA and Rac1 in shCtrl and shYAP cells. Our model predicts that Rac1 activity is not dependent on RhoA-ROCK signaling, and indeed we observed no change in Rac1-GTP or RhoA-GTP levels upon ROCK inhibition (Fig. 1f, Fig. S4c, Fig S4d). Again consistent with our model, we observed a significant increase in RhoA-GTP levels in both shCtrl and shYAP cells following Rac1 inhibition with NSC23766 (Fig. 1g). As expected, Rac1 inhibition also significantly reduced Rac1-GTP levels in both shCtrl and shYAP cells (Fig. S4e). Finally, we tested whether RhoA perturbation was sufficient to restore the migratory speed of shYAP cells. Treatment with two RhoA siRNAs rescued the migratory speed of shYAP cells, with no significant effect on migration speed of shCtrl cells (Fig. 1h, i). These findings demonstrate that YAP activates Rac1, resulting in inhibition of RhoA-ROCK signaling, which altogether enhances cellular migration (Fig. S4f). Thus, YAP simultaneously tunes Rac1 and RhoA activities to potentiate cell motility.
YAP directly transactivates the Rac1-GEF TRIO to modulate Rac1 activity
Next, we sought to determine how the transcriptional co-activator YAP regulates the activity of Rac1. Small GTPases can be regulated by GTPase activating proteins (GAPs) and guanine nucleotide exchange factors (GEFs)(Bos et al., 2007). Since NSC23766 disrupts the interaction of Rac1 with two Rac1-GEFs, TRIO and TIAM1(Gao et al., 2004), we sought to determine if YAP regulates one or both of these Rac1-GEFs. We observed a decrease in TRIO protein and gene expression after YAP knockdown in all cell lines tested using two independent YAP-targeting shRNA sequences (Fig. 3a, b, Fig. S5a, b). Moreover, TRIO expression increased following YAP overexpression both in GBM and MCF10A cells (Fig. 3c, Fig. S5c). However, we did not observe any changes in TIAM1 gene expression in shYAP cells compared to shCtrl cells (Fig. S5d). Given that YAP, a transcriptional co-activator, cooperates with TEAD family transcription factors to directly modulate gene expression(Lamar et al., 2012), we examined whether TRIO is transcriptionally regulated by YAP and whether YAP is found at known enhancer and promoter regions of TRIO. Using published chromatin immunoprecipitation (ChIP) sequencing data for YAP and TEAD4 in MDA-MB-231 cells(Zanconato et al., 2015), we found that both YAP and TEAD4 bind an intronic element of TRIO (Site 1: 14265617 to 14266192 base pairs on chromosome 5) that bears histone modification patterns indicative of active enhancers(Heintzman et al., 2007) (Fig. 3d). Specifically, this locus bears enhancer-associated H3K4 monomethylation (H3K4me1) and H3K27 acetylation (H3K27ac), with less promoter-associated H3K4 trimethylation (H3K4me3). Notably, this enhancer region was independently reported to physically interact with TRIO’s promoter(Jin et al., 2013). In addition, we found a weaker enrichment of YAP-TEAD4 binding at a second, intronic binding site (Site 2: 14268225 to 14268865 bp on chromosome 5) (Fig. 3d). By contrast, we found no evidence of YAP or TEAD4 binding at TIAM1 enhancer and promoter elements. We tested the MDA-MB-231 YAP binding sites by ChIP-PCR on both intronic TRIO enhancer sites in GBM cells. Indeed, significant YAP binding was observed at both enhancer sites of TRIO (Fig. 3e, Fig. S5e). To evaluate the functional consequence of this binding, we performed an enhancer luciferase assay using a 150 bp sequence (centered on the peak of YAP binding) paired with the promoter region of TRIO in HEK293 cells, with or without overexpression of YAP. We found that this sequence increased reporter activity compared to a negative control, and showed increased activity upon YAP overexpression (Fig. 3f), demonstrating that the TRIO promoter can be activated by YAP binding to this enhancer sequence.

a, Representative immunoblot of TRIO expression in shCtrl or shYAP JHGBM651/JHGBM612 cells. b, TRIO mRNA expression in shCtrl or shYAP JHGBM651/JHGBM612 cells. c, Representative immunoblot of TRIO expression in CONT or YAP OE JHGBM612 cells. d, YAP/TEAD4 binding to an intronic region of TRIO as observed in a publicly available ChIP-sequencing dataset using MDA-MD-231 cells(Zanconato et al., 2015). Substantial H3K4 monomethylation (H3K4me1) and H3K27 acetylation (H3K27ac), without H3K4 trimethylation (H3K4me3), indicates an active enhancer element in this locus. e, ChIP-PCR querying across two enhancer elements of TRIO using JHGBM612 cells. f, TRIO gene enhancer luciferase assay in using TRIO enhancer segment in cells with or without YAP OE. g, h, i, G-LISA analysis of Rac1-GTP levels in CONT or YAP OE JHGBM612 cells, CONT or TRIO OE JHGBM612 cells, and shCtrl or shTRIO JHGBM651 cells, respectively. j, Correlation plot of relative YAP and TRIO protein expression (normalized to β-actin) in patient derived primary GBM tissues based on densitometric quantification of immunoblots in Fig. 4i and Supplemental Fig. 5k. k, TRIO and TIAM1 expression in GB-YAP high, intermediate, or low patient groups in the REMBRANDT GBM dataset. i, Percentage of patients with elevated GB-YAP signature, TRIO transcript, or both in the REMBRANDT GBM dataset. P = Fisher’s exact test using the sizes of the shown patient groups. All error bars are s.e.m., Black * = P<0.05, Student’s t-test.
Next, we examined whether YAP-TRIO signaling was sufficient to regulate Rac1 activity. We found an increase in Rac1-GTP levels in YAP OE cells compared to CONT cells (Fig. 3g, Fig. S5f). Furthermore, stable overexpression of wildtype TRIO (TRIO OE) was sufficient to increase Rac1-GTP levels (Fig. 3h, Fig. S5g). Consistent with these findings, shRNA-mediated stable knockdown of TRIO (shTRIO) decreased Rac1-GTP levels (Fig. 3i, S5h). Given the antagonistic relationship between Rac1 and RhoA signaling, we assessed the activity of RhoA-GTP in these cells. We observed decreased RhoA-GTP levels in YAP OE and TRIO OE cells vs. control cells (Fig. S5i), and increased RhoA-GTP levels in shTRIO cells vs. shCtrl cells, paralleling our observations in shYAP cells (Fig. S5j). Collectively, these results demonstrate that YAP directly transactivates the Rac1-GEF TRIO and that TRIO is necessary and sufficient to activate Rac1 and inhibit RhoA.
To test whether our in vitro observations were consistent with data from clinical samples, we assessed TRIO expression in intraoperatively obtained primary GBM tissues from patients (Fig. S5k). Interestingly, we found that the full length TRIO protein was indeed overexpressed in a majority of the GBM tissues analyzed. More importantly, its expression positively correlated with YAP expression in these clinical samples (Fig. 3j). Next, we surveyed gene expression profiles from the Repository for Molecular Brain Neoplasia Data (REMBRANDT) and The Cancer Genome Atlas (TCGA). Specifically, we explored whether there was a correlation between YAP and either TRIO or TIAM1 expression in these two GBM datasets. To enable this analysis, we first derived a list of genes significantly down-regulated in shYAP compared to shCtrl mRNA samples from JHGBM651 and JHGBM612 cells (See Experimental Procedures) (Table S2). We refer to these YAP-regulated genes as the GB-YAP signature. Gene signatures allow more robust estimation of YAP activity from gene expression datasets than mRNA alone, since many transcriptional regulators, including YAP, undergo significant post-transcriptional regulation. We found that the GB-YAP signature of GBM cells correlated with YAP signatures derived from other cell types(Cordenonsi et al., 2011) (Fig. S5l). Furthermore, the REMBRANT data suggested that the patients with elevated GB-YAP signature genes also have significantly higher expression of TRIO, but not TIAM1 (Fig. 3k). Indeed, patients with TRIO overexpression were significantly over-represented among patients with high GB-YAP signature expression in this dataset (comparing all observed patient group sizes to random expectation using Fisher’s exact test; Fig. 3l). Taken together, these results derived from patient-derived tumor tissues support our in vitro observations that YAP modulates TRIO expression.
TRIO is necessary and sufficient for YAP-driven migration
Given our previous results, we sought to test whether TRIO was necessary and/or sufficient for YAP’s control of cell migration. Consistent with its putative functional role, we found that silencing the expression of TRIO decreased the migration speed of GBM, NHA, and MCF10A cells (Fig. 4a, Fig. S6a, b, Movie S5). As a preliminary test, we used a specific pharmacological inhibitor of TRIO, ITX3(Bouquier et al., 2009). We confirmed ITX3 specificity by treating shTRIO cells with this compound and observed no further change in migration speed or Rac1-GTP levels (Fig. S6c, d). We then found that ITX3 reduced migration speed of shCtrl cells in a dose-dependent manner without affecting shYAP-1 or −2 cells (Fig. S6d, S7a, Movie S4). Furthermore, higher doses of ITX3 also decreased migration speed of YAP OE GBM cells to the levels of CONT cells (Fig. S7b). Furthermore, ITX3 treatment significantly reduced Rac1-GTP level in shCtrl and shYAP cells (Fig. S7c). Conversely, upon treatment with ITX3, a significant increase in RhoA-GTP level was observed in shCtrl, but not in shYAP cells (Fig. S7g), demonstrating negative regulation of RhoA activity by the TRIO-Rac1 signaling downstream of YAP. These results suggest that the effects of YAP on RhoA-GTPases and cell migration can be entirely explained by TRIO expression.

a, Left: Representative immunoblot of TRIO expression in shCtrl, shTRIO-1, or −2 JHGBM651 cells. Right: Mean migration speed of shCtrl or shTRIO JHGBM651 cells. b, Left: Representative immunoblot of TRIO and YAP expression in CONT and TRIO OE JHGBM651 cells. Right: Mean migration speed of CONT and TRIO OE JHGBM651 cells. c, Mean migration speed of shCtrl, shYAP, and shYAP+TRIO OE JHGBM651 cells. d, Left: Representative immunoblot of GFP and TRIO expression in CONT, TRIO OE (wildtype), TRIO iGEF1 OE, or TRIO iGEF2 OE JHGBM612 cells. Right: Mean migration speed of CONT, TRIO OE (wildtype TRIO), TRIO iGEF1 OE, or TRIO iGEF2 OE JHGBM612 cells All error bars are s.e.m. Black * = P<0.05, Student’s t-test.
We further explored whether the YAP-mediated Rac1 activation was largely driven by TRIO. Given that we found that, in contrast to TRIO, the gene expression of TIAM1 was not reduced in shYAP cells, combined TIAM1/TRIO inhibition using NSC23766 did not significantly alter the migration speed or Rac1-GTP level of shTRIO-1 or −2 cells (Fig. S7e, f). Furthermore, we found no significant change in RhoA-GTP level in shTRIO cells treated with NSC23766, which was in contrast to the increase seen in shCtrl cells treated with the inhibitor compared to vehicle (Fig. S7g). These results confirmed the specific role of TRIO but not TIAM1 signaling in mediating YAP’s impact on cell migration.
We then explored the effect of perturbations of TRIO on RhoA-dependent signaling and its phenotypic consequences. We found that ITX3 treatment significantly increased the RhoA-GTP level of shCtrl, but not shTRIO cells (Fig. S8a), providing additional evidence of the inhibitory effect of TRIO-dependent signaling on RhoA. Furthermore, suppression of the downstream effector of RhoA with the ROCK inhibitors, Y27632 or H1152, rescued migration speed of shTRIO cells, similar to our observations with shYAP cells (Fig. S8b, Supplemental Movie 6). Consistent with our prior results, ROCK inhibitors did not significantly affect Rac1-GTP or RhoA-GTP levels (Fig. S8c), suggesting no feedback from ROCK on these Rho-GTPases. These results further indicate that TRIO inhibits RhoA activity to enhance cellular migration.
Next, we inquired whether TRIO was sufficient to rescue migration speed of shYAP cells. First, we confirmed that overexpression of TRIO increases migratory speed (Fig. 4b, Fig. S8d). Remarkably, overexpression of a knockdown-resistant TRIO in shYAP-1 or −2 cells (shYAP-1 or −2 + TRIO OE) completely rescued migration speed to levels of shCtrl cells (Fig. 4c, Fig. S8e). To further explore the molecular mechanisms of TRIO activity, we focused on its GEF function. TRIO has two distinct GEF domains, GEF1 and GEF2 that control Rac1 and RhoA activation, respectively. However, our findings indicate that TRIO activates Rac1 signaling while inhibiting RhoA to potentiate migration. Thus, we sought to determine whether one or both GEF domains are relevant for this TRIO-mediated migratory behavior in GBM cells. We monitored migration speed upon stable overexpression of wildtype TRIO (TRIO OE), TRIO with inactivating GEF1 (TRIO iGEF1 OE) or GEF2 (TRIO iGEF2 OE) mutations (Fig. 4d). Notably, we observed an increase in migration speed of TRIO iGEF2 cells, phenocopying the migratory behavior of TRIO OE cells (Fig. 4d). However, we observed no change in migratory speed of TRIO iGEF1 cells (Fig. 4d). These results demonstrate that the GEF1 domain of TRIO, responsible for activation of Rac1, is indispensable for TRIO’s pro-migratory effect. Moreover, TRIO’s RhoA-activating GEF2 domain appears dormant and is dispensable for YAP-TRIO-driven migration in GBM cells. Our results demonstrate that TRIO is necessary and sufficient to account for Rac1 activation by YAP, resulting in RhoA inhibition and increased cell migration.
YAP promotes invasion by activating STAT3
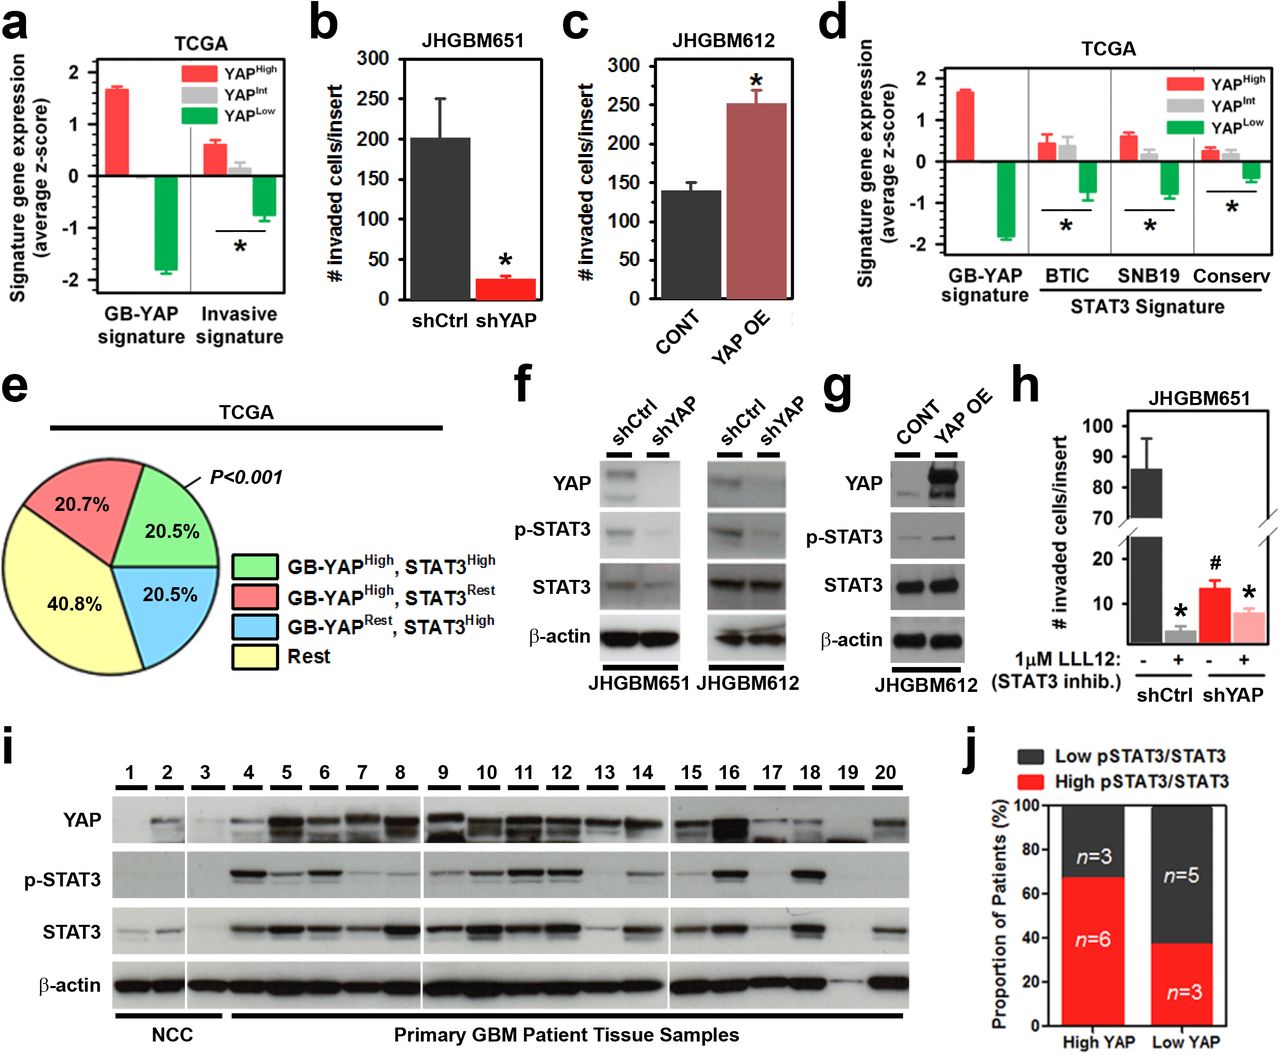
In addition to modulation of migration speed, infiltration of the surrounding stroma tissue requires enhanced invasive capacity, enabling cell navigation in structurally complex tissue environments. Interestingly, in both the TCGA and REMBRANDT tumor gene expression datasets, the GB-YAP signature is associated with higher expression of an invasive gene signature (IGS)(Liu et al., 2007) (Fig. 5a, Fig. S9a). In a reciprocal fashion, patients with elevated expression of the IGS were significantly over-represented among patients with high GB-YAP signature expression (Fig. S9b). Consistent with these observations, we observed that fewer shYAP and more YAP OE cells invaded through Matrigel-coated Boyden chambers than their respective control cells in vitro (Fig. 5b, c, Fig. S9c). This led us to explore the mechanisms of YAP-mediated regulation of invasion by surveying genes implicated in ECM remodeling, degradation, and proteolysis(Jun and Lau, 2011; Overall and Lopez-Otin, 2002). We found that MMP2 and MMP9 (as well as the YAP-target control CTGF) mRNA expression was decreased in shYAP GBM cells (Fig. S9d). Given that these genes are transactivated by STAT3(Dechow et al., 2004; Hilfiker-Kleiner et al., 2004; Xie et al., 2004), a transcription factor known to promote invasion and metastasis(Yu et al., 2009), we hypothesized that YAP may modulate STAT3 activity. Indeed, we found evidence of association between elevated expression of the GB-YAP signature and a published GB-STAT3 signature(Carro et al., 2010), with significant over-representation of patients with elevated expression of both signatures in GBM samples from both clinical datasets (Fig. 5d, e, Fig. S9e). This prompted us to further investigate this correlation between YAP and STAT3 activity. In vitro, we observed decreased phosphorylation of STAT3 on Tyr705 in shYAP-1 or −2 cells (Fig. 5f, Fig. S9f). Moreover, YAP OE cells expressed higher levels of phosphorylated STAT3 than CONT cells (Fig. 5g, Fig. S9f). Functionally, pharmacological inhibition of STAT3 using LLL12 impaired both the invasive and migratory capacity of shCtrl cells more than that of shYAP cells (Fig. 5h, Fig. S9g, h, Movie S7). These results demonstrate that YAP activates STAT3 to drive both migration and invasion.

a, Invasive gene signature expression in GB-YAP high, intermediate, or low patient groups in the TCGA GBM dataset. b, c, Matrigel Boyden invasion assay of shCtrl or shYAP JHGBM651 and CONT or YAP OE JHGBM612 cells, respectively. d, Expression of GB-STAT3 signatures in GB-YAP high, intermediate, or low patient samples in the TCGA GBM dataset. GB-STAT3 signatures were derived from BTIC or SNB19 GBM cells. Conserv = STAT3 signature conserved in both cell lines. e, Percentage of patients with elevated GB-YAP signature, STAT3, or both in the REMBRANDT GBM dataset. P = Fisher’s exact test using the sizes of the shown patient groups. f, g, Representative immunoblot of YAP and total and phospho-Tyr705 STAT3 expression in shCtrl or shYAP JHGBM651/JHGBM612 and CONT or YAP OE JHGBM612 cells, respectively. h, Matrigel Boyden invasion assay of shCtrl and shYAP JHGBM651 cells treated with vehicle or the STAT3 inhibitor LLL12. i, Immunoblots of YAP and total and phospho-Tyr705 STAT3 expression in non-cancer cortex and primary glioblastoma patient tissues. j, Percentage of High and Low YAP expressing patients with High or Low phospho-Tyr705/total STAT3 expression ratio from immunoblot in h. All error bars are s.e.m., Black * = P<0.05, Student’s t-test.
We then surveyed primary GBM tissues for expression and phosphorylation of STAT3 to assess a possible clinical significance of this factor (Fig. 5i). In addition to increased levels and phosphorylation of STAT3 in GBMs compared to non-cancer cortex tissues, we found that most patient-derived tumor samples with elevated YAP expression also exhibited high STAT3 phosphorylation levels (Fig. 5i, j). Conversely, only a few tumor samples with low YAP levels had high STAT3 phosphorylation (Fig. 5i, j). Taken together, these clinical results support our observations in vitro that YAP increases STAT3 activity to potentiate invasion.
YAP-TRIO signaling potentiates invasion by activating STAT3
What is the mechanism of YAP mediated STAT3 regulation? We explored the possibility that it might depend on TRIO mediated activation of Rac1. Indeed, previous studies suggested Rac1 can activate STAT3(Faruqi et al., 2001; Simon et al., 2000), although the mechanistic details of this interaction are poorly understood. In agreement with this data, we observed a decrease in STAT3 phosphorylation and invasion following silencing of TRIO expression vs. shCtrl cells, phenocopying the decreased invasive capacity of shYAP cells (Fig. 6a, b, Fig. S10a, b). Furthermore, TRIO OE GBM cells exhibited an increase in STAT3 phosphorylation and invasion compared to CONT cells (Fig. 6c. d). Remarkably, stable overexpression of TRIO in shYAP cells (shYAP + TRIO OE) recovered the phosphorylation levels of STAT3 to shCtrl cell levels (Fig. 6e). Similar results were obtained by examining STAT3 activity and in vitro invasive potential upon Rac1-GEF, TRIO, and ROCK inhibition in shYAP or shTRIO vs. shCtrl cells (Fig. S10c-e). These results demonstrate that TRIO is necessary and sufficient to explain YAP-driven STAT3 phosphorylation and invasive capacity.

a, b, Representative immunoblot of total and phospho-Tyr705 STAT3 expression in JHGBM651 or JHGBM612 cells treated with increasing doses of the Rac1-GEF inhibitor NSC23766 and TRIO inhibitor ITX3respectively. c, Matrigel Boyden invasion assay of shCtrl, or shYAP JHGBM651 cells treated with vehicle or the TRIO inhibitor ITX3. d, Representative immunoblot of total and phospho-Tyr705 STAT3 expression in shCtrl, shTRIO-1, or −2 JHGBM651 and JHGBM612 cells. e, Matrigel Boyden invasion assay of shCtrl, shYAP, or shTRIO JHGBM651 and JHGBM612 cells. f, Representative immunoblot of total and phospho-Tyr705 STAT3 expression in CONT or TRIO OE JHGB651 cells. g, Matrigel Boyden invasion assay of CONT or TRIO OE JHGBM651 cells. h, Representative immunoblot of YAP, TRIO and phospho-Tyr705 and total STAT3 expression in shCtrl or shYAP with and without CONT or TRIO OE JHGBM651 cells. i, Representative immunoblot of YAP, TRIO and phospho-Tyr705 and total STAT3 expression in shCtrl or shTRIO with and without CONT or YAP OE JHGBM612 cells. j, Left: Human Nuclei/DAPI immunofluorescent images of mouse brain coronal sections after injections of CONT + shCtrl, CONT + shTRIO, YAP OE shCtrl, or YAP OE + shTRIO JHGBM612 cells (i.s. = injection site). Bulk tumor margins are indicated on the ipsilateral hemisphere. White boxes outline the area magnified in the right panel. Right: magnified images of the corpus callosum in the right hemisphere (m.l. = midline, c.c. = corpus callosum, st = striatum, ctx = cortex). k, Total number of CONT + shCtrl, CONT + shTRIO, YAP OE shCtrl, or YAP OE + shTRIO cells invading corpus callosum into the contralateral hemisphere. (n = 5 mice per group), *=P<0.05, Student’s t-test. l, Schematic representation of YAP and TRIO modulating STAT3 phosphorylation independently of RhoA-ROCK signaling. All error bars are s.e.m. Statistics for c-g are as described in Figure 1.
Given the critical role of YAP-TRIO signaling in driving a migratory and invasive capacity of GBM cells, we sought to evaluate the relevance of this cascade in vivo using our murine intracranial xenograft model of GBM infiltration. Specifically, we sought to determine whether TRIO is necessary for YAP-driven cellular infiltration in vivo. To that end, we established control (CONT) and YAP overexpressing (YAP OE) JHGBM612 cells with or without TRIO knockdown. In vitro, we found decreased STAT3 phosphorylation in both CONT + shTRIO and YAP OE + shTRIO cells, compared to their respective controls, reinforcing the relevance of TRIO signaling in YAP-driven STAT3 activation (Fig. 6f). Next, we injected 50,000 CONT + shCtrl, CONT + shTRIO, YAP OE + shCtrl, or YAP OE + shTRIO JHGBM612 cells into the striatum (at pre-determined coordinates from the bregma; see Experimental Procedures) of immunocompromised mice and quantified the number of human GBM cells infiltrating along the corpus callosum 5 weeks post-injection. We observed that overexpression of YAP was sufficient to increase invasion of JHGBM612 cells via the corpus callosum into the contralateral hemisphere (CONT + shCtrl vs YAP OE + shCtrl); Fig. 6g, h). Moreover, knocking down TRIO significantly attenuated invasive potential of these GBM cells (CONT + shCtrl vs CONT + shTRIO; Figure 6g, h). In addition, we found a significant reduction in the number of YAP OE + shTRIO cells vs. YAP OE + shCtrl cells migrating through the corpus callosum (Fig. 6g, h). Together, these results indicated that while YAP is sufficient to increase invasive capacity of GBM cells, TRIO is necessary to promote YAP-driven cell dispersion in vivo. These findings identify TRIO as a critical switch through which YAP activates Rac1 and STAT3 signaling to potentiate cellular infiltration in GBMs (Fig. 6i).
YAP-TRIO-STAT3 signaling predicts poor clinical outcome in glioblastoma
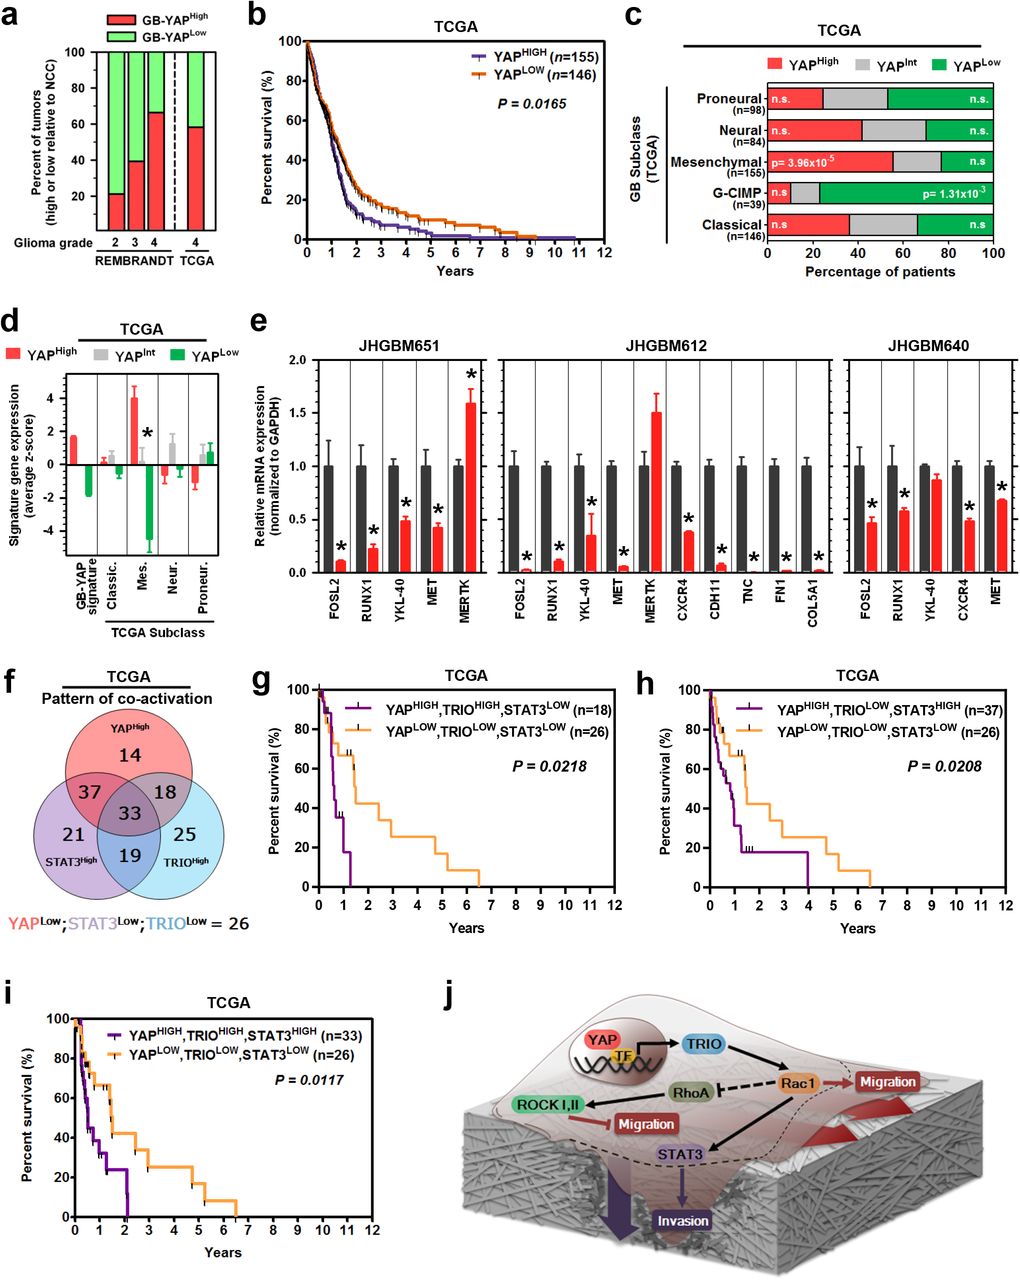
Our results suggest YAP-driven migration and invasion is critical for the biology of aggressive cancers. We therefore explored clinical implications of these findings for gliomas, of which GBM is the highest grade tumor with a median survival of 14 months11. We found that GB-YAP signature expression increased with glioma grade in the REMBRANDT dataset (Fig. S11a); notably, STAT3 and TRIO have also been reported to increase with glioma grade(Salhia et al., 2008). Additionally, the percentage of glioma patients overexpressing the GB-YAP signature compared to non-cancer cortex increased with glioma grade (Fig. 7a). Having found that YAP is hyperactive in GBMs, we focused on its prognostic value for these patients as determined by Kaplan-Meier analyses. Strikingly, higher expression of the GB-YAP signature predicted poor prognosis of GBM patients from both TCGA (Fig. 7b) and REMBRANDT cohorts (Fig. S11b). In addition, the YAP gene signature was more predictive than 91.5% of 1 million simulated, size-matched gene sets (empirical p = 0.085), suggesting it is one of the most predictive gene sets of its size.

a, Percent of patients with elevated GB-YAP signature expression. Patients are grouped by glioma grade in REMBRANDT and TCGA. b, Kaplan-Meier graph of cumulative progression-free survival in patient groups defined by GB-YAP signature expression in TCGA dataset. P=Log-Rank test. c, Percentage of GBM patients with elevated GB-YAP signature expression in each TCGA subtype. Fisher’s exact test. d, Expression of GBM subclass signatures in GB-YAP high, intermediate, or low patient samples in the TCGA and REMBRANDT GB dataset. GBM subclass signatures were derived from TCGA “Core” samples. e, mRNA expression of Mesenchymal GBM subclass signature genes in Ctrl or shYAP JHGB651, JHGB640, and JHGB612 cells. f, Distribution of patient groups expressing either one, two, or all three of GB-YAP signature, TRIO transcript, and STAT3-conserved signature expression patterns. g-i, Kaplan-Meier graphs of cumulative progression-free survival in patient groups defined by the GB-YAP signature, TRIO transcript, and STAT3-conserved signature expression in TCGA dataset. P=Log-Rank test. j, Schematic of the YAP-driven pro-migratory and invasive signaling pathway in a single cell on a layer of extracellular matrix. Dashed lines demonstrate movement of cell body during migration and invasion. Darker shading of extracellular matrix around the invading edge of the cell represents degradation of the surrounding tissue.
Due to molecular heterogeneity of GBMs, we explored if YAP activity was associated with one or more of the GBM subtypes recently described by Verhaak et al(Verhaak et al., 2010) and Brennan et al(Brennan et al., 2013). Notably, Mesenchymal GBMs are distinguished by invasion of brain parenchyma coupled with pronounced angiogenesis(Phillips et al., 2006). Moreover, the transcription factors STAT3 and C/EBPβ have been proposed to synergistically drive Mesenchymal GBMs(Carro et al., 2010). Of interest, TAZ, a paralog of YAP, was also found to potentiate Mesenchymal differentiation and transformation, but in a fashion that is independent of STAT3- and C/EBPβ, through direct transcriptional activation(Bhat et al., 2011). Consistently, Bhat et al(Bhat et al., 2011) observed no modulation of STAT3 upon TAZ knockdown in GBM cells. These results raised the possibility that YAP might modulate the Mesenchymal phenotype associated with the eponymous sub-class in a way distinct from TAZ, through activation of STAT3. Indeed, there was a significant over-representation of GB-YAP-high patients among the Mesenchymal GBMs, but not among other subclasses (Fig. 7c). Furthermore, we found that YAP-TRIO signaling regulated the activity of STAT3 by promoting its phosphorylation (Figs. 5, 6, Figs. S9, 10), suggesting that YAP may be a driver of mesenchymal reprogramming in GBMs. Consistent with this hypothesis, higher expression of the GB-YAP signature corresponded to higher expression of Mesenchymal subclass genes in both GBM datasets (Fig. 7d). In vitro, we observed decreased expression levels of several Mesenchymal subclass genes after YAP knockdown in all three GBM cell lines (Fig. 7e). Taken together, these results demonstrate that YAP can drive Mesenchymal subclass-related genes in GBMs at least in part by modulating STAT3 activity.
Interestingly, we also found that YAP-low patients were significantly overrepresented among GBMs in the glioma CpG island methylator phenotype (G-CIMP) subclass, which exhibit hypermethylation at CpG islands and longer progression-free survival (Fig. 7c). This result suggested that patients with lower YAP activity would present a less aggressive subtype of GBM, and most patients in this group might not benefit from any potential therapies targeting YAP. To explore this idea further, we inquired whether the prognostic power associated with enhanced YAP activity was restricted to a particular subclass of patients. Using Kaplan-Meier analyses, we evaluated progression-free survival along with YAP signature expression in each GBM subclass individually. Strikingly, higher expression of the GB-YAP signature predicted rapid recurrence in all the GBM subclasses except the G-CIMP subtype (Fig. S11c-f). This suggests that YAP-targeted therapies may be effective for patients with non-G-CIMP tumors, and especially the Mesenchymal subclass.
We then investigated whether YAP-TRIO-STAT3 signaling axis is clinically relevant in GBMs. First, using the TCGA dataset, we determined the distribution of patient groups with hyperactivation of either one, two, or all three of the network components (i.e. YAP, TRIO, and STAT3). Hyperactivation was determined using the GB-YAP signature, TRIO transcript, and GB-STAT3 signature (Fig. 7f). Indeed, we found a significant over-representation of GBM patients with hyperactivation of all the three members of the YAP-TRIO-STAT3 molecular network. Next, we stratified patients into 8 groups representing every possible combination of YAP, TRIO, and STAT3 co-activation, and performed Kaplan-Meier survival analyses. Notably, the groups that exhibited YAP co-activation with either TRIO or STAT3 had significantly worse prognosis than the group without hyperactivation of any of these proteins (YAPLOW, TRIOLOW, STAT3LOW) (Fig. 7g-i,; Fig. S11g, h, 12), Furthermore, the results showed that YAP+TRIO or YAP+STAT3 co-activation was associated with similarly poor prognosis as hyperactivation of all three regulators (i.e. YAPHIGH, TRIOHIGH, STAT3HIGH). Importantly, hyperactivation of TRIO and STAT (i.e. YAP+TRIO) without high YAP activity did not appear to be associated with poor patient prognosis in this dataset (Fig. S12), emphasizing the prognostic power of YAP-dependent signaling. Overall, these analyses emphasize the co-dependence of TRIO and STAT3 on YAP to confer poor patient prognosis. These results should be viewed as preliminary, as the tumor purity, mRNA degradation, and cohort size might be confounding factors in this analysis. Larger patient cohorts with matched expression data, which are currently unavailable, would help to validate these results. Nevertheless, collectively, our study provides important initial evidence of the clinical value of the YAP-driven pro-migratory and invasive genetic circuit in predicting patient outcomes (Fig. 7j).
DISCUSSION
This study suggests a central and widespread role for YAP in controlling the migratory speed and invasiveness of several cancer and normal cell types through modulation of a Rho-GTPase switch. Specifically, we demonstrated that YAP increases expression of the Rac1-GEF TRIO leading to activation of Rac1 and inhibition of RhoA small GTPases, and, subsequently resulting in STAT3 activation. This intricate cascade simultaneously promotes cellular motility and invasion, using both transcriptional and post-transcriptional mechanisms (Fig. 7j). Furthermore, we find that, although TRIO harbors two GEF domains, its YAP-driven functions are mediated by the GEF1 domain’s activation of Rac1. This is in agreement with studies in different systems that demonstrate Rac1 is the major target of TRIO(Schmidt and Debant, 2014). The only known example of RhoA activation by TRIO is Gaq signaling, where Gaq binds to the PH2 module within the GEF2 domain, releasing PH2-mediated inhibition of DH2, thereby stimulating GEFD2 activity on RhoA(Vaque et al., 2013). Nevertheless, the activity of both Rac1 and RhoA were found to be important in mediating the YAP-driven TRIO-dependent control of cell migration and invasion, suggesting the importance of the crosstalk between Rac1 and RhoA, downstream of TRIO activation.
Intriguingly, it has been reported that TRIO-mediated Rho-GTPase signaling can regulate YAP(Cai et al., 2018; Feng et al., 2014; Gargini et al., 2016; Sabra et al., 2017; Yu et al., 2014) which, coupled with our results, suggests that regulation between YAP and Rho-GTPases can be mutually enhancing, constituting a feedback that can stabilize migratory and invasive phenotypes. Recently, it has been shown that YAP regulates actin dynamics through modulation of ARHGAP29 to promote metastasis of gastric cancer cells(Qiao et al., 2017). Since YAP expression and activity is controlled by a diverse range of stimuli and genetic alterations(Chen et al., 2012; Dupont et al., 2011; Feng et al., 2014; Haskins et al., 2014; Overholtzer et al., 2006; Pan, 2010; Xu et al., 2010; Yu et al., 2014), the evidence of crosstalk between YAP, Rho-GTPases, and STAT3 establishes a wide spectrum of inputs and mechanisms that regulate cell locomotion. Furthermore, our results implicate YAP and STAT3 as key transcriptional regulators of cellular migration and invasion, which could aid development of metastatic gene expression signatures for cancer. A recent study reported the role of YAP signaling in activation of JAK-STAT3 pathway to regulate endothelial cell proliferation during angiogenesis(He et al., 2018), further establishing the significance of YAP-mediated activation of STAT3 in different phenotypic and cellular contexts.
Together with our other study by Park et al (currently under review), our results suggest YAP-controlled cell migration and invasivion are fundamental functions present in many cell types. This pathway may be particularly important in developmental and physiological contexts involving episodes of large scale migration, such as wound healing and progenitor cell navigation during neural tissue development. In this context, our study suggests that the central role of YAP in controlling cell and tissue growth is balanced by regulating cell dispersion required by many morphogenetic events.
Given the widespread hyperactivation of YAP in many cancers, our study further clarifies the mechanisms controlling invasive cancer cell phenotypes. One of the hallmarks of tumor malignancy and progression to higher pathological grades is the ability of cancer cells to invade their surrounding parenchyma, intravasate surrounding blood and lymphatic vessels, and eventually seed distant tissues as metastatic tumors(Hanahan and Weinberg, 2011). Tumor recurrence and lethality can be greatly aided by the migratory and invasive capacity of cells. While the YAP-TEAD interaction has been shown to promote metastasis in breast cancer(Lamar et al., 2012), the downstream signals responsible for increased metastatic potential have remained poorly understood. As with metastatic cancers, GBMs often evade eradication because individual cells spread from the primary bulk tumor, thus making complete resection and localized radiation treatment virtually impossible. Clinically, more than half of metastatic tumors display pronounced local infiltration(Matsukado et al., 1961) and can recur in as little as 3 months despite radical surgery, chemo- and radiotherapy(Bell and Karnosh, 1949; Chaichana et al., 2012; Dandy, 1928). Thus, understanding the molecular basis for cell dispersal can facilitate development of improved treatment modalities(Kim et al., 2018).
Our finding that YAP-TRIO signaling can promote STAT3 activity establishes a novel pro-invasive signaling axis with possible therapeutic implications in glioblastoma and other cancers, where YAP and STAT3 can independently and synergistically confer malignancy and predict poor prognosis(Carro et al., 2010). Moreover, this YAP-TRIO-STAT3 network is found in multiple cell types, and thus forms a general molecular framework for predicting clinical outcomes in aggressive cancers such as glioblastoma. Importantly, our work highlights the dependency of the downstream effects exercised by YAP on TRIO and/or STAT3 activation in conferring poor GBM patient prognosis. Therefore, our study suggests that a network, systems perspective on the etiology of aggressive cancers can benefit from explicit analysis of molecular cascades that integrate numerous signaling pathways, inform design of targeted and combination therapies, as well as augment our understanding of the drivers of transcriptionally-distinct tumor subtypes.
AUTHOR CONTRIBUTIONS
S.R.S. conceived and designed the project. S.R.S. and N.D.T. performed the experiments. N.D.T. performed bioinformatic analysis. J.P. tracked and analyzed migration time-lapse data. A.M. and G.V. assisted with early experiments. J.C.M-G assisted with YAP-TRIO in vitro rescue experiments. S.S. provided TRIO wildtype and mutant lentiviral and corresponding control constructs. S.W., and S. X. assisted with YAP-TRIO in vivo experiment. S.R.S., N.D.T., and J.P. interpreted the results. A.L. and A.Q.-H. supervised the project. S.R.S., and N.D.T. wrote the manuscript. S.M., A.L., and A.Q.-H. reviewed and revised the manuscript.
DECLARATION OF INTERESTS
Microarray data of shCtrl and shYAP JHGBM651 and JHGBM612 cells have been deposited with NCBI Gene Expression Omnibus under accession code (upon acceptance of manuscript). Reprints and permissions information is available at www.nature.com/reprints. The authors declare no competing financial interests. Correspondence and requests for material should be addressed to A.L. (andre.levchenko{at}yale.edu) or A.Q.-H (Quinones-Hinojosa.Alfredo{at}mayo.edu).
EXPERIMENTAL PROCEDURES
Cell culture
Patient primary glioblastoma tissue specimens were obtained at the Johns Hopkins Hospital under the approval of the Institutional Review Board (IRB). All primary cell lines were established from excess tumor tissue from patients undergoing surgical resection for glioblastoma as listed in Supplemental Table 1. GBM cell line derivation and culture protocols were as previously described(Pollard et al., 2009), without the addition of N2 supplement and cultured on laminin-coated (1μg/cm2) plates. Specifically, DMEM/F12 (Invitrogen) was supplemented with B27 supplement (Invitrogen), antibiotic/antimycotic (Invitrogen), human EGF (Peprotech) and FGF (Peprotech). MCF10A cells were purchased from ATCC and maintained in complete MEGM media (Lonza) supplemented with 100 ng/mL cholera toxin (Sigma) as recommended. NIH-3T3 cells were purchased from ATCC and cultured as recommended. All cell lines were tested and confirmed to be mycoplasm free using a PCR based MycoDtectTM kit from Greiner Bio-One.
Lentiviral transduction
Glycerol stocks of Human Mission TRC1 sequence-verified shRNA lentiviral plasmid vectors were obtained from the Johns Hopkins University High Throughput Biology Center (See below). Plasmids were isolated using a Spin Miniprep kit (Qiagen). Vesicular stomatitis virus glycoprotein-pseudotyped virus was produced by co-transfecting 293T cells using Lipofectamine 2000 (Invitrogen) with an shRNA transducing vector and 2 packaging vectors, psPAX2 and pMD2.G. On days 3 and 4 post-transfection, virus was harvested and filtered through a 0.22-μm pore cellulose acetate filter before centrifugal concentration using a Centricon Plus-70 (Millipore). An empty TRC1 lentiviral construct was used as the Control virus (Sigma).
The TRIO (pCDH1-GFP TRIO), TRIO iGEF1 (TRIO QALE), TRIO iGEF2 (TRIO L2051E), and its corresponding control lentiviral plasmids (pCDH1) were generated by the Schmidt Lab. Vesicular stomatitis virus glycoprotein-pseudotyped virus was produced by co-transfecting 293T cells using PureFection transfection reagent (Systems Biosciences) with the pCDH1-based lentiviral vector and pPACKH1 packaging plasmid mix (Systems Biosciences).
The YAP constitutively-active overexpression lentiviral vector was generated using pCMV-Flag YAP127/128/131/381A plasmid (Addgene) and Duet011 lentiviral plasmid.
Primary GB, MCF10A, and NIH-3T3 cells were transduced with equal titers of concentrated virus in complete growth media supplemented with 1 μg/ml polybrene (Sigma) for 24 hours. Following transduction, cells were given 24 hours to recover before selection in 0.25 μg/ml (JHGBM651, JHGBM640, JHGBM1A) or 0.5 μg/ml (JHGBM612, MCF10A, and NIH-3T3) puromycin (Sigma) for a minimum of 6 days. Minimum effective puromycin or hygromycin concentrations were determined using kill curves of non-transduced cells (data not shown).
shRNA Plasmids
Time-lapse microscopy, drug treatments, and analysis of single cell migration speed
GBM or MCF10A cells were seeded at a density of 2000-4000 cells/well in a 96-well tissue-culture polystyrene plate (BD Falcon) that was pretreated with 3 μg/cm2 laminin for GBM cells (Sigma) or 5 μg/cm2 collagen for MCF10A cells (Stem Cell Technologies). 48 hours after seeding, cells were fed with either control or treated complete growth medium (as indicated) and placed and imaged in a temperature- and gas-controlled environmental chamber (37 °C, 5% CO2). Y27632 (Tocris), NSC23766 (Tocris), or ITX3 (Tocris) were resuspended in sterile PBS concentrations for the indicated times. Time-lapse microscopy was performed using a motorized inverted microscope (Olympus IX81) equipped with a Cascade 512B II CCD camera. Phase-contrast images were captured with a 10x objective (NA = 0.30) under the control of Slidebook 4.1 (Intelligent Imaging Innovations, Denver, CO) at 10–20 minute intervals for at least 6 hours.
A single observer used a custom MATLAB script to view time-lapse images and manually mark cell body positions. (See Supplemental Videos). Due to the inhomogeneous seeding of cells throughout individual wells, care was taken to image 5-8 fields of view per well that were most comparable to other experimental conditions. Additionally, a minimum of 30 cells was tracked from 4 replicate wells for each experimental condition. Cell migration speed was computed as displacement (between each captured time point) over time. Individual cell speeds were summarized as the average speed within one-hour intervals. Since the speeds of many cell populations failed to pass normality testing, a Wilcoxon rank-sum test was used to compare experimental conditions. Error bars represent the standard error of the mean of the cell population in a given experimental condition.
Intracranial xenograft model and immunohistochemistry
All animal protocols were approved by the Johns Hopkins Animal Care and Use Committee. Briefly, JHGBM612 cells were resuspended at 75,000 cells/μl in complete growth media and placed on ice. 1-month old male NOD-SCID gamma-null (NSG) mice were anesthetized prior to intracranial injections following an established protocol(Gonzalez-Perez et al., 2010). 2 μl of shCtrl or shYAP cells were injected into the striatum; specifically (X: 1.5, Y: 1.34, Z: −3.5) mms from the bregma (n = 3 per group). 5 weeks post-injection, mice were anesthetized prior to trans-cardiac perfusion with saline followed by 10% formalin. Brains were then harvested and fixed overnight at 4 °C in 10% formalin. Fixed brains were placed in OCT compound (Tissue-Tek) overnight at at 4 °C and subsequently flash-frozen. Embedded brains were cut into 10 micron coronal sections using a cryostat microtome.
Brain sections spaced every 500μm were stained with hematoxylin and eosin to identify landmark neuroanatomical structures and therefore identify comparable slides from each mouse for further analysis. Slides immediately adjacent to the identified slides were then selected for immunohistochemistry and quantification. Antigen retrieval was performed using sodium citrate (10 mM) for 30 minutes in a water bath at 95°C. Slides were rinsed in PBS and blocked in 10% normal goat serum for 1 hour. Primary antibody was diluted in PBS with 0.1% Triton X-100 and 2% normal goat serum. Slides were incubated with primary antibody overnight at 4°C. After rinsing with PBS, the slides were incubated with the appropriate anti–IgG secondary antibody (Molecular Probes, Invitrogen) conjugated with a fluorochrome for 1 hour and rinsed. Slides were then incubated with DAPI for 30 minutes and rinsed in PBS before visualization on an Olympus IX81 inverted microscope. Antibodies are listed at the end of this section.
Immunoblotting, antibodies, and immunocytochemistry
Immunoblotting: Tissues from the operating room were briefly rinsed in HBSS before being flash frozen in liquid nitrogen. Proteins were extracted using T-PER (Pierce) tissue protein extraction reagent and a tissue homogenizer. GB, MCF10A, and NIH-3T3 cells were lysed on ice with a cell scraper and radioimmunoprecipitation assay lysis buffer (Pierce) supplemented with protease inhibitor tablets (Roche) and a phosphatase inhibitor cocktail (Pierce). Extracts incubated for 45 minutes for complete lysis and centrifuged at 10,000 RPM for 10 minutes at 4°C to pellet cell debris. Supernatant protein concentrations were quantified using a BCA Protein Assay kit (Pierce) and a spectrophotometric plate reader (BioTek). Most protein lysates were separated by running 30-100 μg of lysate on 10% Bis-Tris NuPage gels (Invitrogen) and subsequently, transferred to 0.2μm pore polyvinylidene fluoride (PVDF) membranes (BioRad). Because TRIO is an exceptionally large protein, some lysates were run on 4-12% Tris-Acetate NuPage gels and transferred to 0.45 μm pore PVDF membranes overnight. Primary antibody incubations were according to manufacturer’s recommendations in 0.1% Tween TBS supplemented with 5% non-fat dry milk or BSA, as recommended. Immunoreactive bands were visualized using the appropriate horseradish peroxidase-conjugated anti-IgG antibodies (Pierce). Bands were detected using enhanced chemiluminescence or prime detection reagent (GE Healthcare) whenever appropriate.
For immunocytochemistry, 160,000 GBM cells were seeded on laminin-coated 35-mm cell culture plates. 48 hours later, cells were washed in cold PBS and fixed in 10% formalin for 30-60 minutes. Cells were blocked in 10% normal goat serum for 1 hour. Primary antibody was diluted in PBS with 0.1% Triton X-100 and 2% normal goat serum. Cells were incubated with primary antibody overnight at 4°C. After rinsing with cold PBS, cells were incubated with the appropriate anti–IgG secondary antibody (Molecular Probes, Invitrogen) conjugated with a fluorochrome for 1 hour. Cells were rinsed in PBS before incubation with DAPI for 30 minutes. Finally, cells were rinsed in PBS before visualization on an Olympus IX81 inverted microscope.
For focal adhesion analysis, high resolution images were captured using a fluorescence microscope at 20-40X. Quantification of area or size was conducted using ImageJ.
Antibodies used for these procedures are listed at the end of this section.
Pull-down of GTP-bound Small Rho GTPases
The Rac1-GTP Assay (Cell Bio Labs) and RhoA-GTP Assay (Millipore) kits were used in accordance with the manufacturer’s instructions. Briefly, 1.2 × 10⁶ MCF10A or GBM cells per dish were seeded into collagen- or laminin-coated 100 mm cell culture dishes (Corning). 48 hours later, cells were rinsed twice with ice cold PBS and placed on ice. Extracts were harvested quickly by scraping in ice-cold 1X assay buffer supplemented with protease and phosphatase inhibitors. Lysis was completed by incubation for 30 minutes on ice and vortexing every 10 minutes. Protein supernatants were isolated and quantified as above. 4 mg of shCtrl or shYAP MCF10A lysate was used as input for RhoA-GTP pull-down and 2 mg as input for Rac1-GTP pull-down. 1 mg of protein lysate was used as input for Rac1-GTP pull-down of JHGBM651 cells. 50 μg of input lysates were kept for immunoblotting. Agarose beads conjugated with Rhotekin binding domain (RBD) were incubated with lysates for 4 hours, and p21-binding domain (PBD) agarose beads were incubated with lysates for 1 hour. Beads were rinsed three times with cold 1X assay buffer, resuspended in 2X SDS-PAGE sample buffer, and boiled for 10 minutes. Proteins were separated on 10% Bis-Tris NuPage gels, transferred to 0.2 μm pore PVDF membranes, and immunoblotted as described above. Mouse anti-RhoA antibody (26C4) was purchased from Santa Cruz. Refer to the end of this section for a listing of all antibodies used. In addition, for more quantitative analyses, G-LISA RhoA or Rac1 activation kits from Cytoskeleton were used according to manufacturer’s protocol.
Motif Search
MotifMap(Xie et al., 2009) was used to search 10 kilobase regions upstream of select transcription start sites in the hg19 reference genome. Significant motifs were called at a false discovery rate below 0.05.
Invasion assay
Matrigel-coated Boyden chambers (BD Biosciences) were used to assess invasive capacity of cells. 100,000 cells were resuspended in their appropriate media supplemented with 0.5% FBS. Cell suspension aliquots were plated on the upper surface of the transwell plates with a porous PET membrane (8μm pores) pre-coated with a layer of growth factor reduced matrigel basement membrane matrix. 750 μl of 2% FBS containing DMEM media was placed on the lower chamber. Filters were incubated at 37C°, 5% CO2 for 48 hours. Invasion of cells was determined by fixing the membrane, staining the cells using the Diff-Quik® staining kit, directly counting the number of invaded cells in 9 high-power fields at 10x using an Olympus 1X81 microscope system and calculating the mean per well.
The assays were run in triplicates and at least three independent experiments were performed. See also Supplemental Fig. 15c.
RNA extraction and quantitative real-time PCR
Total RNA was extracted in TRIzol, phase separated using chloroform, and precipitated overnight at 4°C in isopropanol. Further isolation of total RNA was performed using the RNeasy Mini Kit (Qiagen) according to the manufacturer’s instructions. 1 μg purified RNA was reverse transcribed using the Superscript III First-Strand cDNA Synthesis Kit (Invitrogen). Quantitative real-time PCR using SYBR Green (Applied Biosystems) was performed on a 7300 Cycler (Applied Biosystems) and the included data analysis software. GAPDH primers were used as a loading control. See the table below for all primer sequences used.
Primer pairs
Biostatistical analysis
For Affymetrix data (GB-YAP, TCGA, and Rembrandt datasets), raw data files were processed in aroma.affymetrix (http://statistics.berkeley.edu/sites/default/files/tech-reports/745.pdf) using a custom CDF with updated probeset mappings(Dai et al., 2005) (BrainArray v15.1.0). Differential expression analysis was performed using the sam function of the siggenes package (version 1.28.0) in R 2.15.2. For Illumina beadchip data, signature probesets (GB-STAT3 and GB-C/EBPβ datasets(Carro et al., 2010)) were required to map to a single Entrez Gene ID. Redundant probesets mapping to the same gene were eliminated after differential expression analysis.
To derive gene signatures, each cell line was analyzed for differential expression independently (GB-YAP, GB-STAT3, and GB-C/EBPβ datasets). Genes with q < .05 and absolute fold-change > 1.5 were considered as differentially expressed genes, although q < 0.1 was used when no genes passed q < 0.05. This relaxed FDR was excused because the final signatures were taken as the genes significantly differentially expressed in both cell lines, at least one of which required q < .05.
To stratify patients into groups of low, intermediate, and high expression of a given gene signature, we used the gene set z-score(Irizarry, 2009). Briefly, RMA normalized data were quantile normalized, variance filtered, and log2 transformed. Gene sets were filtered to remove genes not present in the normalized, filtered data for each analysis. Each gene was converted into an expression z-score relative to other samples of the same class (e.g. other GBMs but not low-grade gliomas), and the gene set score (GSS) was computed as the sum of the member genes’ z-scores divided by the square root of the size of the gene set. Samples with GSS < −0.5 were categorized as low, samples with GSS > 0.5 were high, and those between were intermediate. Since microarray data to derive a gene signature of TRIO was unavailable, patients with a TRIO gene z-score < −0.5 were called low and those with a TRIO gene z-score > 0.5 were called high.
Antibodies
Accession codes
The microarray dataset of JHGBM651 and JHGBM612 cells treated with shCtrl or shYAP in triplicate will be made available on the Gene Expression Omnibus prior to publication.
ACKNOWLEDGEMENTS
We thank the Department of Neurological Surgery and Oncology at Johns Hopkins Hospital for access to intraoperatively-obtained glioblastoma tissues; Lakesha Johnson and Liron Noiman for establishing primary cell cultures of these primary glioblastoma specimens; Colette Ap Rhys for designing and preparing lentiviruses; Conover Talbot Jr. for technical support and helpful discussions of microarray analysis; Tom Schaffer for technical support with the RhoA-GTP pull-down assay; and Kaisorn L. Chaichana for glioblastoma patient MRI images. This research was funded by NIH R01 NS070024 and NIH 5K08 NS055851 (A.Q.-H), and U54 CA209992 and U01 CA155758 (A.L). S.R.S is a recipient of the National Science Foundation Graduate Research Fellowship. A.M. is a recipient of the Maryland Stem Cell Postdoctoral Research Fellowship.


