

Abstract
Most human tumors display chromosome-scale copy number alterations, and high levels of aneuploidy are frequently associated with advanced disease and poor patient prognosis. To examine the relationship between aneuploidy and cancer progression, we generated and analyzed a series of isogenic human cell lines that harbor single extra chromosomes. We find that different aneuploidies can have distinct effects on metastatic behavior: across 13 different cell lines, 12 trisomies suppressed invasiveness or were largely neutral, while a single trisomy increased metastatic behavior by triggering a partial epithelial-mesenchymal transition. In contrast, chromosomal instability, which can lead to the development of aneuploidy, uniformly suppressed cellular invasion. By analyzing genomic copy number and survival data from 10,133 cancer patients, we demonstrate that specific aneuploidies are associated with distinct clinical outcomes, and the acquisition of certain aneuploidies is in fact linked with a favorable prognosis. Thus, aneuploidy is not a uniform driver of malignancy, and different chromosome copy number changes can uniquely influence tumor progression. At the same time, the gain of a single chromosome is capable of inducing a profound cell state transition, underscoring how genomic plasticity can engender phenotypic plasticity and lead to the acquisition of enhanced metastatic properties.
Introduction
Whole-chromosome aneuploidy is a nearly-ubiquitous feature of human tumors, though its role in malignancy remains poorly understood (Sheltzer and Amon 2011; Knouse et al. 2017; Chunduri and Storchová 2019). Aneuploidy alters the dosage of hundreds or thousands of genes at once, causing proportional changes in the expression of most transcripts on an affected chromosome (Williams et al. 2008; Sheltzer et al. 2012; Stingele et al. 2012; Dürrbaum et al. 2014). These dosage imbalances have pleiotropic effects on cell physiology, and can impair metabolism, protein homeostasis, and the maintenance of genomic stability (Williams et al. 2008; Sheltzer et al. 2011; Donnelly et al. 2014; Passerini et al. 2016). Despite its prevalence in cancer, under most conditions aneuploidy inhibits, rather than promotes, cell proliferation, and many single-chromosome gains can suppress tumorigenesis (Williams et al. 2008; Sheltzer et al. 2017). At the same time, the phenotypic alterations caused by aneuploidy may lead to improved fitness in certain environments (Pavelka et al. 2010; Rutledge et al. 2016), and aneuploidy can serve as a mechanism by which cells increase the dosage of growth-promoting oncogenes (Davoli et al. 2013). Thus, aneuploidy can have multifaceted and sometimes opposing roles during tumor development.
Aneuploidy can arise as a result of a cellular condition called chromosomal instability, or CIN (Holland and Cleveland 2009). Under normal conditions, the cell’s spindle assembly checkpoint (SAC) maintains a metaphase arrest until all chromosomes are correctly aligned and under tension from the mitotic spindle (Lara-Gonzalez et al. 2012). The kinase Mps1 is the master regulator of this checkpoint, and it phosphorylates multiple proteins capable of measuring the tension status of each chromosome (Pachis and Kops 2018). If the SAC is compromised, cells will undergo anaphase prematurely, leading to the random missegregation of chromosomes and the development of aneuploidy.
Clinically, cancer aneuploidy has been recognized as a common indicator of poor patient prognosis (Merkel and McGuire 1990). The overall degree of aneuploidy tends to increase during tumor progression, and aneuploid tumors from several tissues are correlated with decreased overall survival compared to tumors with near-diploid karyotypes (Sheltzer 2013; Frankfurt et al. 1985; Friedlander et al. 1984; Choma et al. 2001; Kheir et al. 1988; Kallioniemi et al. 1987). However, most of these analyses have relied on technologies that are only capable of detecting gross deviations from the euploid state (e.g., DNA flow cytometry). Modern array-based and sequencing-based methods can be used to determine the complete set of karyotypic alterations found in a patient’s tumor, but the prognostic importance of most specific aneuploidies is not known. Additionally, the reasons underlying the close link between aneuploidy and outcome remain contested.
As the vast majority of cancer deaths result from metastasis, it is possible that aneuploidy plays a role in the metastatic cascade (Mehlen and Puisieux 2006). During metastasis, cancer cells must migrate out of their local environment, intravasate into the vascular system, travel to a distant organ, and re-establish tumor growth at a secondary site (Pantel and Brakenhoff 2004). In epithelial cancers, this process has been associated with the co-option of a developmental program called the epithelial-mesenchymal transition (EMT) (Heerboth et al. 2015). During an EMT, cancer cells silence the expression of the cell-adhesion proteins typically found in epithelial tissue and activate a set of mesenchymal genes that drive cell movement and invasion. While the expression of an EMT gene signature has been correlated with poor prognosis (Taube et al. 2010), further experiments have challenged the notion that the EMT is either necessary or sufficient for tumor metastasis (Zheng et al. 2015; Fischer et al. 2015). Related programs, including a partial-EMT, in which cells fail to completely adopt a mesenchymal phenotype, have also been proposed to play a role in cancer cell dissemination (Jolly et al. 2017).
Alternately, it is possible that aneuploidy does not directly affect metastasis, and instead arises in aggressive cancers as a by-product of tumor evolution. For instance, mutations in the tumor suppressor TP53 are associated both with poor prognosis and with the acquisition of aneuploidy (Thompson and Compton 2010; López-García et al. 2017; Smith and Sheltzer 2018), and the increased levels of aneuploidy in late-stage malignancies could simply be a consequence of the loss of p53 function. Finally, a recent study has suggested that CIN, rather than aneuploidy per se, is a key driver of cancer metastasis (Bakhoum et al. 2018). According to this hypothesis, lagging chromosomes caused by CIN become trapped outside of the nucleus, forming micronuclei, and are recognized by the cGAS/STING cytosolic DNA sensing pathway. STING triggers the activation of non-canonical NFκB signaling, leading to an EMT and increased cellular invasiveness. Thus, in this model, the observed correlation between aneuploidy and metastasis may occur as a byproduct of the relationship between aneuploidy and CIN.
Our ability to understand the connections between CIN, aneuploidy, and metastasis has been hampered by a lack of controlled systems in which to study these processes. The aneuploidy that naturally develops during tumorigenesis is often triggered or accompanied by additional mutations, compromising our ability to determine causal relationships. In order to overcome these limitations, we and others have developed multiple approaches to generate human cell lines with specific whole-chromosome aneuploidies (Williams et al. 2008; Stingele et al. 2012; Sheltzer et al. 2017). By altering chromosome copy number in an otherwise-congenic background, we can isolate and study the effects of aneuploidy, absent any other secondary alterations. Similarly, while the causes of CIN in human tumors remain debated, chromosomal instability can be generated in vitro using small-molecule inhibitors of the SAC kinase Mps1, allowing us to isolate the specific consequences of CIN (Santaguida et al. 2010, 2015; Sheltzer et al. 2017). Using these systems, we set out to investigate how aneuploidy and CIN affect metastatic behavior in cancer.
Results
Single-chromosome gains can either promote or suppress metastatic behavior
Using microcell-mediated chromosome transfer (MMCT), we generated derivatives of the near-diploid human colorectal cancer cell line HCT116 that harbored single extra chromosomes (Stingele et al. 2012; Domingues et al. 2017). We successfully derived clones that were trisomic for one of six different chromosomes (Chr. 3, 5, 8, 13, 18, or 21). We then confirmed the presence of the extra chromosomes and the absence of any secondary aneuploidies in each clone using Short Multiply Aggregated Sequence Homologies (SMASH) sequencing (Figure S1A)(Wang et al. 2016).
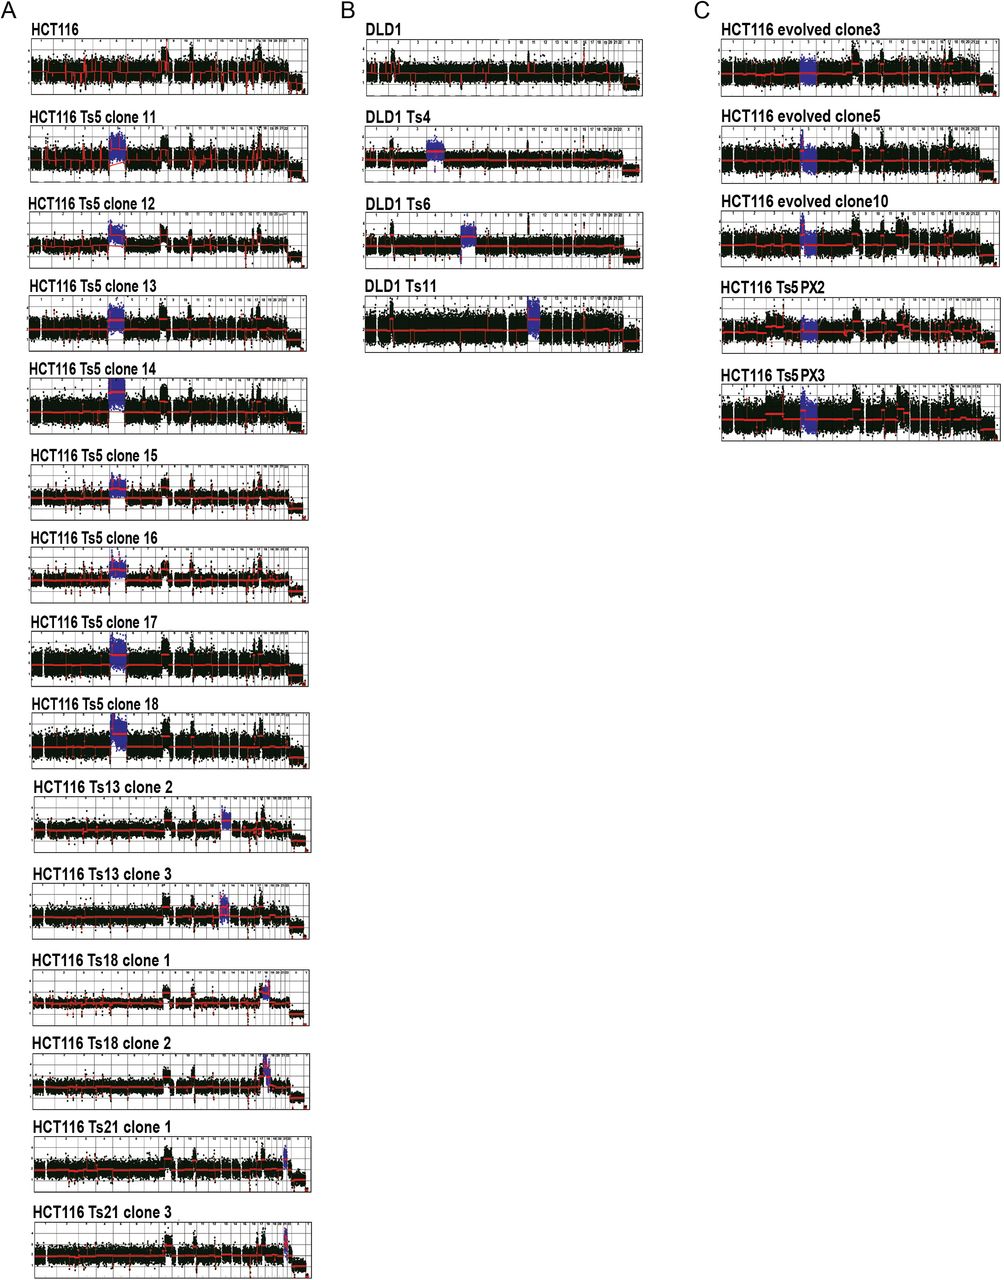
Karyotypes were analyzed using the SMASH technique, and normalized read depths across 50kb bins are shown (Wang et al. 2016).
Karyotypes of HCT116 and the HCT116 trisomies.
Karyotypes of DLD and the DLD1 trisomies.
Karyotypes obtained after reversion of HCT116 Ts5. Only evolved clone 3 and Ts5 PX2 (post xeno) showed complete loss of both arms of chromosome 5.
To test how these alterations affected metastatic behavior, we applied an in vitro invasion assay, in which cells were challenged by a chemotactic gradient to invade through a basement membrane (Figure 1A). In the near-diploid parental HCT116 line, about 20 cells per field were able to successfully invade through the Matrigel layer (Figure 1B). Gaining an extra copy of Chr. 3 or Chr. 21 did not affect the rate of invasion, while gaining an extra copy of Chr. 8, 13, or 18 significantly decreased invasion. However, in four independent clones trisomic for Chr. 5, cellular invasion significantly increased to nearly 100 cells per field (Figure 1B-C).
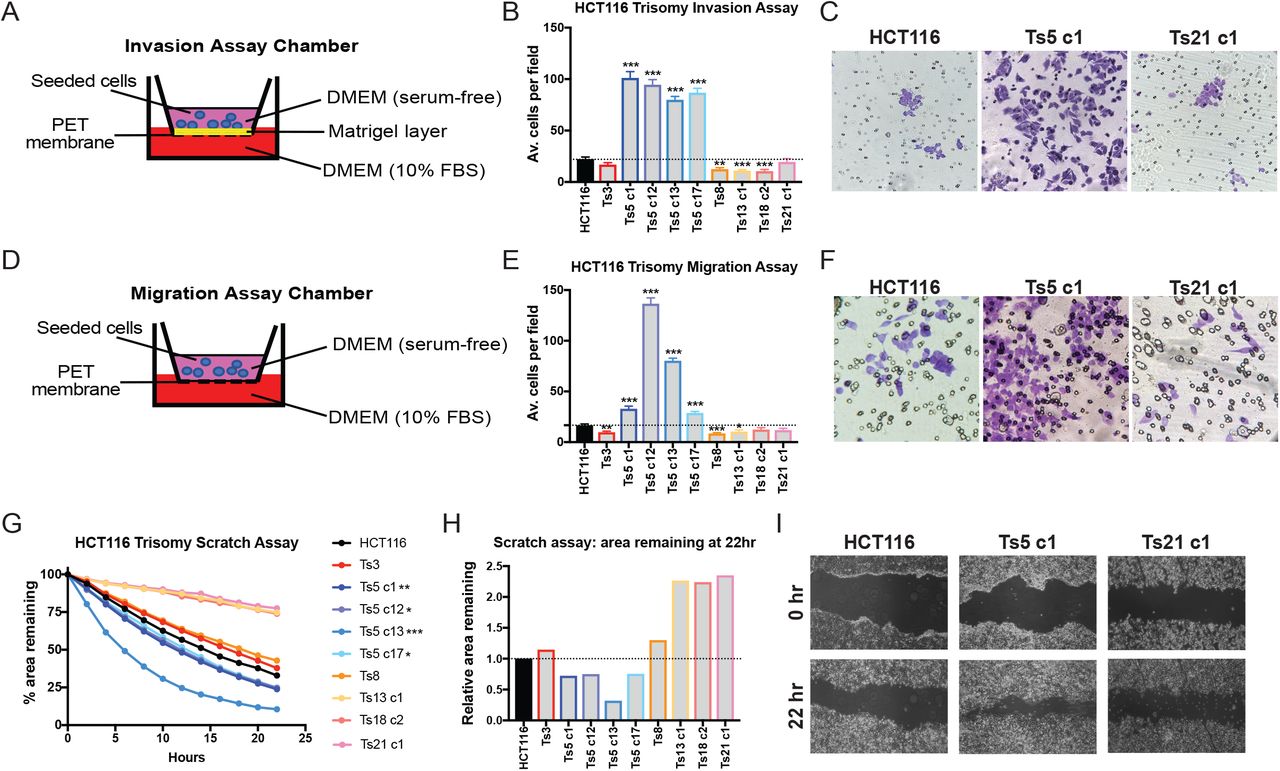
Schematic diagram of the invasion assay. Cells are seeded in the upper chamber in serum-free media while the bottom chamber contains media supplemented with 10% FBS.
Quantification of the average number of cells per field that were able to cross the membrane in the invasion assay. Averages represent three independent trials in which 15-20 fields were counted.
Representative images of HCT116, HCT116 Ts5 c1, and HCT116 Ts21 c1 invasion stained with crystal violet.
Schematic diagram of migration assay. The setup is similar to the invasion assay except that the membrane does not have a matrigel layer.
Quantification of the average number of cells per field that were able to cross the membrane in the migration assay. Averages represent three independent trials in which 15-20 fields were counted.
Representative images of HCT116, HCT116 Ts5 c1, and HCT116 Ts21 c1 migration stained with crystal violet.
Quantification of cell motility in a scratch assay. The percent area remaining between two monolayers separated by a pipette tip-induced scratch was monitored for 22 hours.
The ratio of the area remaining at 22 hours after the scratch is plotted relative to the HCT116 parental cell line. A ratio less than 1 indicates faster scratch closure relative to wild-type, while a ratio greater than 1 indicates slower scratch closure.
Representative images of the scratch closure assay immediately after the scratch (0h) and at the end of the assay (22h) for HCT116, HCT116 Ts5 c1, and HCT116 Ts21 c1.
Bars represent mean ± SEM. * p<0.05; ** p<0.005 *** p<0.0005.
To further explore the effects of aneuploidy on metastasis-related phenotypes, we performed two additional assays in each trisomic cell line. First, we conducted a migration assay, in which cells were challenged by a chemotactic gradient to move through an 8 µm pore (Figure 1D-F). Secondly, we performed a scratch-repair assay, in which we used live-cell imaging to follow the rate at which each cell line was capable of closing a cell-free gap (Figure 1G-I). From these assays, certain patterns emerged: most trisomic lines were either neutral or displayed decreased invasiveness in each experiment. HCT116 Ts13, in particular, exhibited significantly lower rates of cellular invasion and migration, and moved nearly twice as slowly as the parental line in the scratch closure assay. In contrast, four of four tested clones that harbored an extra copy of chromosome 5 displayed increased metastatic behavior in each assay. We noted some variability between independent Ts5 clones (e.g., compare Ts5 c1 and Ts5 c12, Figure 1E), but the overall patterns were consistent across this trisomy. In total, these assays demonstrate a complicated relationship between single-chromosome aneuploidies and metastatic phenotypes: specific aneuploidies may either promote, suppress, or fail to affect different metastasis-related processes, and gaining chromosome 5 in particular has a consistently strong effect on invasiveness in this cell line.
We then set out to investigate the impact of aneuploidy in other human cell lines. Using MMCT, we generated retinal pigment epithelial (RPE1) cell lines trisomic for Chr. 3, 5, 7, or 21 (Stingele et al. 2012; Domingues et al. 2017; Dürrbaum et al. 2018), and we tested their behavior in each of the three metastasis assays described above. These four trisomies were found to suppress metastatic behavior, and Ts3 had a particularly strong inhibitory effect (Figure S2A-E). Interestingly, while Ts5 increased invasiveness in HCT116 cells, in RPE1 this extra chromosome consistently blocked invasive behavior. This suggests that unique interactions between an aneuploidy and the cell’s genetic background determine whether a specific chromosome gain will have pro-metastatic or anti-metastatic consequences.

(A,F) Quantification of the average number of cells per field that were able to cross the membrane in the invasion assay in RPE1 and DLD1. Averages represent three independent trials in which 15-20 fields were counted.
(B,G) Representative images of RPE1 and DLD1 invasion.
(C,H) Quantification of the average number of cells per field that were able to cross the membrane in the migration assay. Averages represent three independent trials in which 15-20 fields were counted.
(D,I) Quantification of cell motility in a scratch assay. The percent area remaining between two monolayers separated by a pipette tip-induced scratch was monitored for 22 hours.
(E,J) The ratio of the area remaining at 22 hours after the scratch is plotted relative to the RPE1 or DLD1 parental cell line. A ratio less than 1 indicates faster scratch closure relative to wild-type, while a ratio greater than 1 indicates slower scratch closure.
Finally, to ensure that our results were not a consequence of the MMCT protocol used to generate these aneuploidies, we applied an alternate methodology to derive trisomic cells. We treated near-diploid DLD1 colon cancer cells with AZ3146, a small-molecule inhibitor of the SAC kinase Mps1, and isolated single cell-derived clones. Using SMASH sequencing, we identified DLD1 derivatives trisomic for either Chr. 4, 6, or 11 (Figure S1B). We subjected these clones to each metastasis assay, and we found that these trisomies were either neutral or suppressed invasive behavior (Figure S2F-J). In total, our results indicate that aneuploidy can have complex effects on metastasis-related phenotypes. Single-chromosome aneuploidies can be sufficient to either promote or suppress invasiveness, depending on the cell’s genetic background and the identity of the aneuploid chromosome.
Trisomy 5 promotes metastatic behavior by causing a partial epithelial-mesenchymal transition
We next sought to investigate how gaining chromosome 5 in HCT116 induced metastatic behavior. As metastasis is commonly associated with an EMT, we assessed the expression of canonical markers of epithelial cell identity in each HCT116 trisomy. We found that wild-type HCT116 cells and HCT116 derivatives trisomic for Chr. 3, 8, 13, 18, or 21 expressed high levels of the epithelial adhesion genes EpCAM, E-cadherin, and Claudin 7 (Figure 2A). In contrast, EpCAM, E-cadherin, and Claudin 7 were silenced in nine out of ten clones trisomic for chromosome 5, suggesting that this aneuploidy caused a loss of epithelial cell identity. To test whether Ts5 converted cells to a mesenchymal state, we next assessed the expression of the mesenchymal markers Fibronectin, N-cadherin, and Vimentin. We found that these genes were not expressed in any trisomic derivative of HCT116, including Ts5, indicating that this aneuploidy induces a “partial” EMT phenotype (Figure S3).

HCT116 trisomies do not express mesenchymal genes. The sarcoma cell line U2OS was analyzed as a positive control.

(A) Western blot analysis of epithelial marker expression in HCT116 trisomies. Alpha-tubulin was used as a loading control.
(B) Schematic of two strategies to select for HCT116 Ts5 chromosome-loss revertants.
(C) Western blot analysis of epithelial marker expression in trisomy 5 cells that lost the extra copy of chromosome 5. “Xeno”: cells isolated after xenograft growth. Ts5 c1 e3, e5, e10: clones isolated from high-passage cells.
(D-E) Quantification of the average number of cells per field that were able to cross the membrane in the invasion assay. Averages represent three independent trials in which 15-20 fields were counted.
(F-G) Verification of E-cadherin and EpCAM overexpression in two HCT116 Ts5 clones transfected with the indicated plasmids.
(H) Quantification of the average number of cells per field that were able to cross the membrane in the invasion assay. Averages represent three independent trials in which 15-20 fields were counted.
(I) Representative images of invasion in the indicated cell lines.
Each trisomic cell line was derived via single-cell cloning, and HCT116 exhibits a very high mutation rate (Glaab and Tindall 1997). While our data indicated that gaining chromosome 5 induces a profound alteration in cell identity, it remained possible that these results were an artefact of a mutation or some other alteration acquired during the MMCT process. Notably, our observation that a single Ts5 clone (“clone 11”) retained epithelial gene expression raised the possibility that our results were due to a secondary alteration that occurred during cell line derivation. We hypothesized that, if gaining Chr. 5 caused epithelial gene silencing, then eliminating that trisomy should restore epithelial gene expression. Alternately, if this phenotype was a byproduct of a mutation acquired during cloning, then the loss of epithelial cell identity should be independent of the presence of the extra chromosome. To differentiate between these possibilities, we used two approaches to generate derivatives of HCT116 Ts5 that had lost the extra chromosome (Figure 2B). First, we grew these cells as a xenograft in a nude mouse, a process that we previously demonstrated selected for cells that had lost the extra chromosome (Sheltzer et al. 2017). Secondly, we cultured HCT116 Ts5 cells for several weeks to allow them to missegregate the trisomy, and then we performed a second round of single-cell cloning. Using SMASH sequencing, we confirmed that the post-xenograft cell line had lost the extra chromosome, and we identified three “evolved” clones that had lost most or all of the extra chromosome (Figure S1C). We found that all four Ts5-loss cell lines had restored EpCAM, E-cadherin, and Claudin 7 expression (Figure 2C), and this correlated with a decrease in Matrigel invasion (Figure 2D). This indicates that the prior silencing of these epithelial genes was likely a consequence of the initial aneuploidy, while the aberrant expression profile in Ts5 clone 11 is most likely due to a secondary alteration or other clonal artefact.
Finally, we sought to discover whether the loss of epithelial gene expression caused the increased metastatic behavior in our Ts5 cells. First, we assessed invasiveness in Ts5 clone 11, and we verified that significantly fewer cells from this clone were able to invade through a basement membrane compared to other Ts5 clones that had silenced the epithelial adhesion genes (Figure 2E). Next, we expressed either EpCAM or E-cadherin cDNA under a constitutive promoter in two different Ts5 clones. Western blotting revealed that these constructs led to EpCAM and E-cadherin expression levels comparable to those found in the near-diploid parental HCT116 line (Figure 2F-G). We then tested the effects of restoring EpCAM or E-cadherin expression on metastatic behavior, and we found that the expression of either protein was sufficient to decrease Matrigel invasion to a level indistinguishable from the wild-type control (Figure 2H-I). In total, these results demonstrate that gaining an extra copy of chromosome 5 increases invasiveness in colorectal cancer cells by down-regulating the expression of epithelial cell-adhesion genes.
Triggering chromosomal instability with Mps1 inhibitors suppresses metastatic behavior
Our findings indicated that specific aneuploidies can directly affect metastasis, suggesting that the frequent appearance of aneuploidy in metastatic tumors is not simply a by-product of CIN. We therefore set out to investigate the relationship between CIN, whole-chromosome aneuploidy, and metastatic behavior. In order to generate CIN, we used two inhibitors of the Mps1 kinase, AZ3146 and BAY1217389, at two different concentrations. We performed live-cell imaging in HCT116 cells that expressed H2B-GFP and we verified that treatment with either drug induced a variety of mitotic errors, including anaphase bridges, lagging chromosomes, and micronuclei, in a dose-dependent manner (Figure S4). Furthermore, after exposure to 1μM AZ3146, single-cell sequencing of HCT116 revealed that 92% of cells exhibited whole-chromosome aneuploidy, compared to only 8% of cells in an untreated population (Figure S5A-C). Thus, Mps1 inhibitors allow us to trigger transient periods of chromosomal instability, which generated populations of cells with different aneuploid karyotypes.
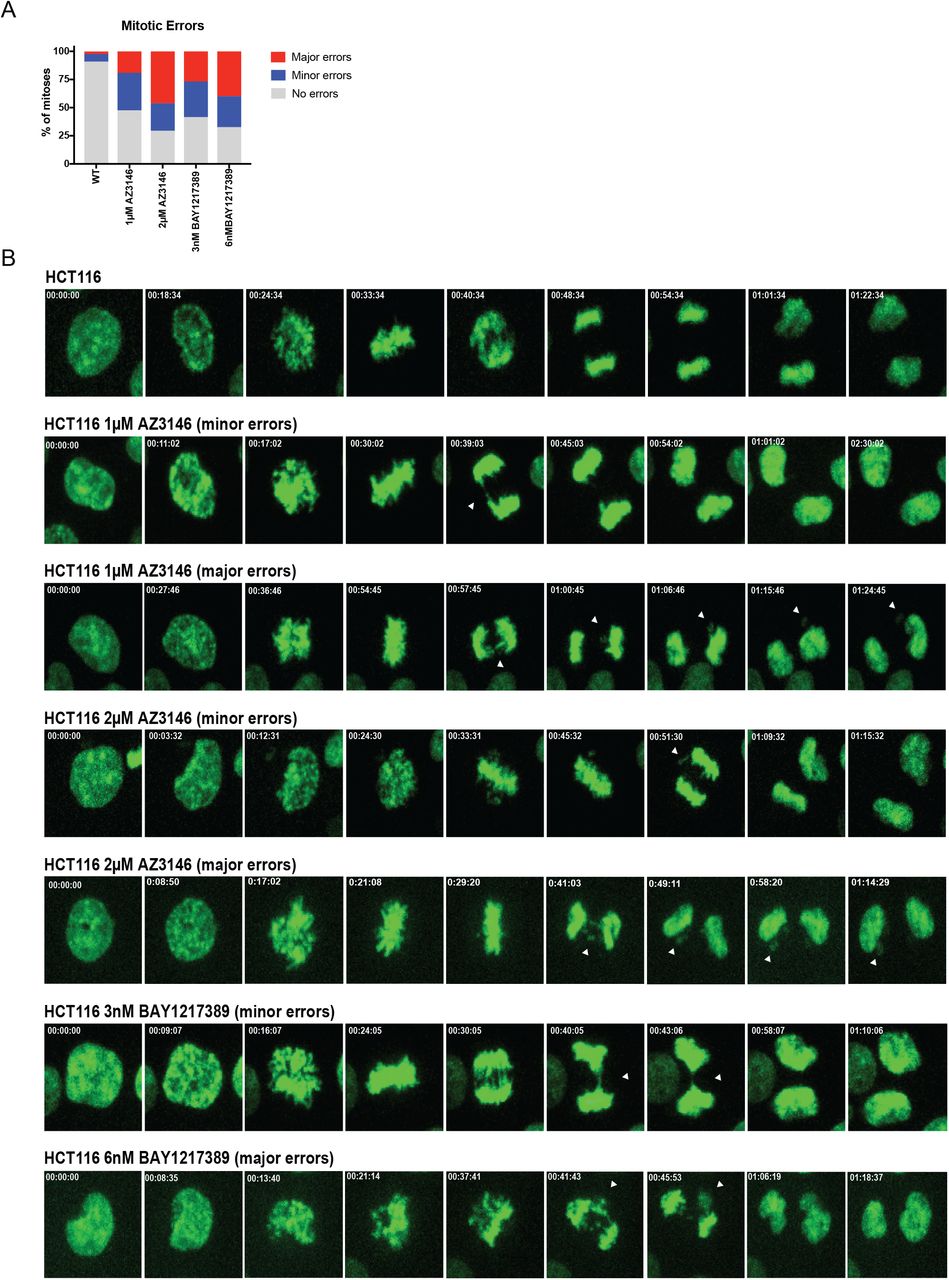
Quantification of random chromosome segregation error frequency after Mps1 inhibitor treatment.
Representative images of chromosome segregation errors due during mitosis. White arrows indicate chromosome segregation errors.

(A) The percent of cells with whole-chromosome aneuploidies in HCT116 cells +/− 1 µM AZ3146 are displayed.
(B-C) Representative karyotypes of single cells +/− 1 µM AZ3146.
Next, we tested the effects of these Mps1 inhibitors on the metastatic behavior of HCT116 and DLD1 cells. Surprisingly, we found that exposure to these drugs profoundly suppressed metastatic behavior in nearly every condition tested (Figure 3). For instance, treatment with either 2μM AZ3146 or 6nM BAY1217389 decreased invasion in HCT116 cells by more than 80% (Figure 3A-B). These drugs also resulted in highly-significant decreases in pore migration and scratch-closure. These results suggest that Mps1 inhibitors are capable of suppressing metastasis.

(A,F) Quantification of the average number of cells per field that were able to cross the membrane in the invasion assay in either HCT116 or DLD1. Averages represent three independent trials in which 15-20 fields were counted.
(B,G) Representative images of invasion in the indicated Mps1i-treated cell lines.
(C,H) Quantification of the average number of cells per field that were able to cross the membrane in the migration assay in either HCT116 or DLD1.
(D,I) Quantification of the percent area remaining in the scratch assay after Mps1 inhibitor treatment.
(E,J) The ratio of the area remaining at 22 hours after the scratch is plotted relative to the untreated parental cell line.
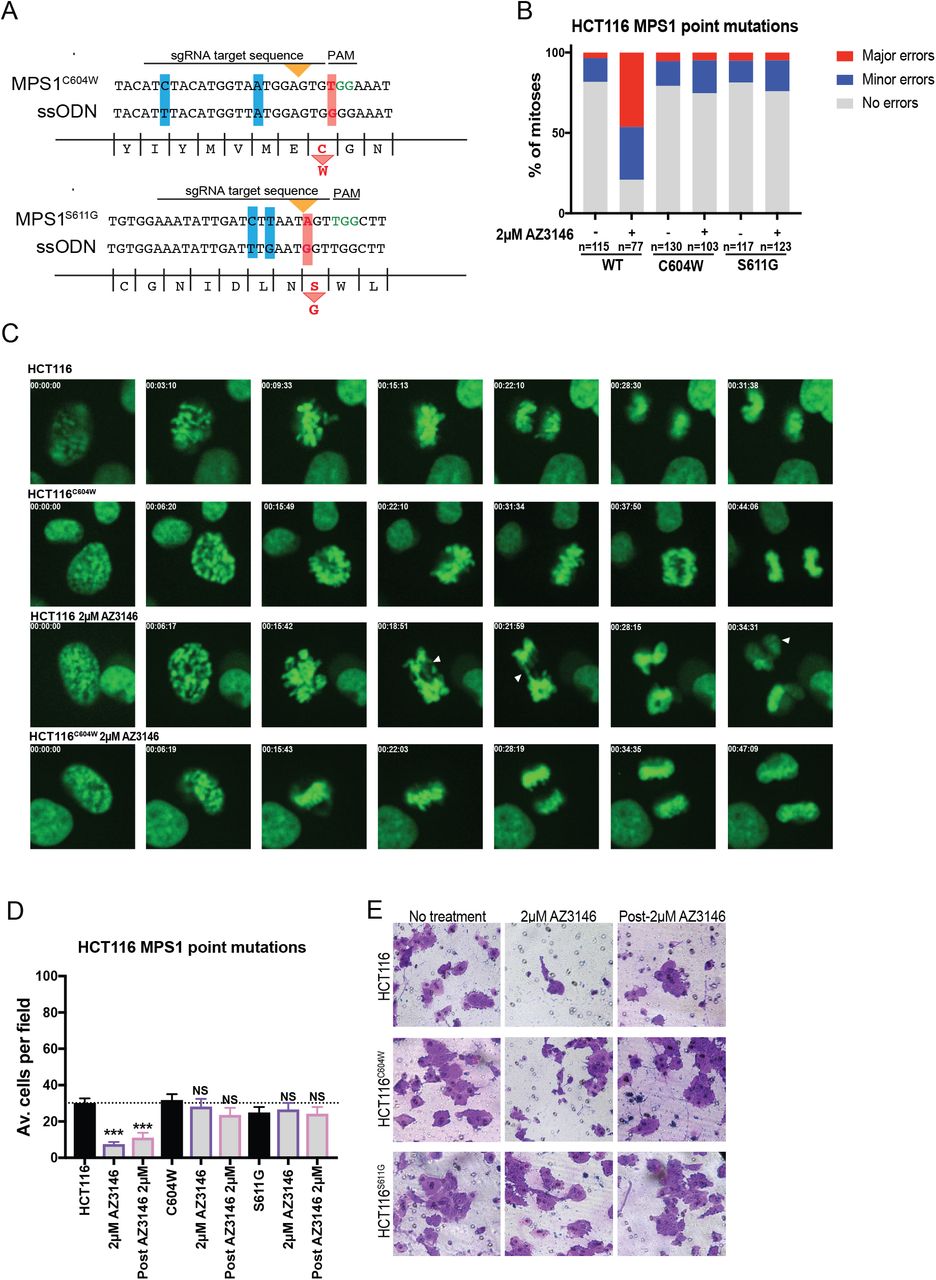
Many small molecules can exhibit promiscuous activity against other kinases, leading us to consider the possibility that an off-target effect of these drugs suppressed metastasis (Giuliano et al. 2018; Klaeger et al. 2017). To test whether the effects of Mps1 inhibitors were due to CIN, we performed two sets of experiments. First, we reasoned that aneuploidy and the cytoplasmic DNA that arises from chromosome missegregation are a “persistent” consequence of CIN, in that they can remain after the drug had been washed out. We therefore repeated each metastasis assay with cells that had been exposed to AZ3146, followed by a 24-hour drug-free washout period (“post-AZ3146”; Figure 3). Under these conditions, cancer cells displayed high levels of cytoplasmic DNA (see below). However, they still exhibited very poor metastatic behavior compared to the untreated cell lines (Figure 3). Secondly, we used CRISPR-mediated homology-directed repair (HDR) to introduce two mutations into the MPS1 gene (C604W and S611G; Figure S6A, Table S1A) that have been reported to block the binding of AZ3146 to Mps1 (Gurden et al. 2015). Live-cell imaging verified that HCT116 cells harboring these mutations displayed minimal CIN when cultured in 2 μM AZ3146 (Figure S6B-C). Correspondingly, while 2 μM AZ3146 resulted in a significant decrease in Matrigel invasion in wild-type HCT116, treatment of cells harboring either Mps1C604W or Mps1S611G with AZ3146 had no effect on invasion (Figure S6D-E). These results suggest that the effects of AZ3146 on invasion are on “on-target” consequence of Mps1 inhibition. We conclude that chromosomal instability is not a universal driver of metastasis, and certain forms of CIN are in fact able to inhibit invasive behavior.

A diagram of the CRISPR-mediated HDR strategy to introduce a C604W mutation and a S611G mutation into the endogenous MPS1 locus. Red bars highlight the missense mutations while blue bars highlight silent mutations introduced to minimize re-cutting.
Quantification of mitotic error frequency in the presence of absence of the Mps1 inhibitor AZ3146.
Representative images of mitoses in the indicated cell lines.
Quantification of the average number of cells per field that were able to cross the membrane in the invasion assay in HCT116. Averages represent two independent trials in which 15-20 fields were counted.
Representative images of HCT116 invasion.
cGAS/STING activity is insufficient to trigger an EMT or explain the metastatic behavior of HCT116 Ts5 cells
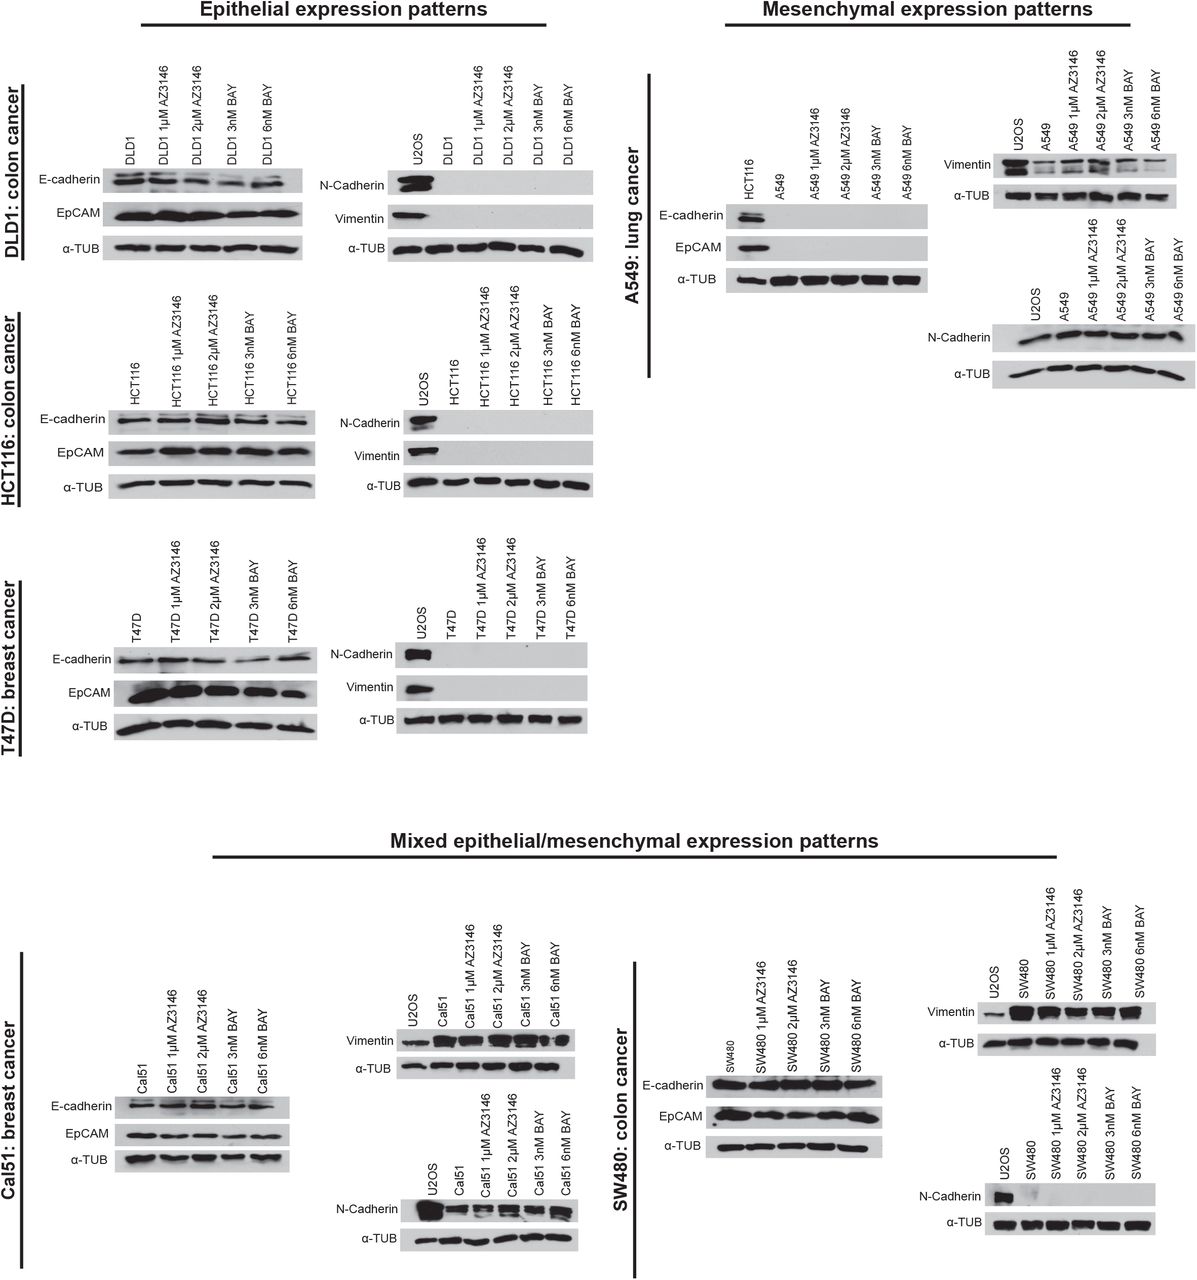
Chromosomal instability has been reported to promote metastasis by activating non-canonical NFκB signaling via the cytosolic DNA sensor cGAS and its adaptor STING (Bakhoum et al. 2018). As we found that Mps1 inhibitors are capable of suppressing metastasis, we sought to test whether they similarly affected these pathways. First, we confirmed that both AZ3146 and BAY1217389 lead to a significant, six to ten-fold increase in micronuclei in both HCT116 and DLD1 cells 24 hours after drug washout (Figure 4A-B). While the expression of STING was normally low in these cells, treatment with AZ3146 or BAY1217389 caused an increase in the appearance of cells that were strongly STING-positive (Figure 4C-D). Mps1 inhibitor treatment also caused an increase of five to eleven-fold in the translocation of the NFκB transcription factor RelB into the nucleus (Figure 4E-F). We also confirmed via qPCR that multiple NFκB targets were up-regulated (Figure 4G). Thus, these results demonstrate that the cytosolic DNA sensing pathway is functional in these cells, and that Mps1 inhibition is sufficient to activate a RelB-related transcriptional response. However, in a variety of different cancer cell lines, neither Mps1 inhibitor was sufficient to drive metastasis (Figure 3) or to alter the expression of the canonical EMT proteins EpCAM, E-cadherin, N-cadherin, or Vimentin (Figure S7). We conclude that an EMT is not an obligate consequence of chromosomal instability, and instead the previously-reported association between CIN, EMT, and metastasis may be limited to certain cancer types or specific ways of generating CIN.

Six different cancer cell lines were treated with Mps1 inhibitors and then analyzed via western blotting. The sarcoma cell line U2OS serves as a positive control for mesenchymal gene expression.

Quantification of the percent of cells with micronuclei after Mps1 inhibitor treatment in HCT116 and DLD1.
Representative images of micronuclei after Mps1 inhibitor treatment. Yellow arrows indicate certain visible micronuclei.
Quantification of the percent of cells with STING upregulation after Mps1 inhibitor treatment.
Representative images of cells with STING upregulation after Mps1 inhibitors treatment. White arrows indicate certain cells with STING upregulation.
Quantification of the percent of cells with nuclear RelB after Mps1 inhibitor treatment.
Representative images of cells after Mps1 inhibitor treatment. White arrows indicate certain cells with nuclear RelB.
qPCR quantification of NFκB target genes.
Western blot demonstrating the CRISPRi-induced knockdown of cGAS and STING in two HCT116 Ts5 clones.
EpCAM expression after knockdown of cGAS and STING with CRISPRi in HCT116 Ts5 clones.
Quantification of the average number of cells per field that were able to cross the membrane in the invasion assay after cGAS or STING knockdown.
Representative images of the invasion assay in the indicated cell lines.
Despite these results, cGAS/STING signaling undoubtedly has a profound effect on multiple cancer-related phenotypes. Additionally, STING is encoded on chromosome 5, and multiple inflammatory genes are upregulated in trisomic cell lines (Dürrbaum et al. 2014; Viganó et al. 2018), leading us to investigate whether cGAS/STING contributed to the metastatic behavior of the HCT116 Ts5 cells. To accomplish this, we stably expressed a dCAS9-KRAB CRISPRi vector in two independent Ts5 clones, which allowed us to trigger the specific down-regulation of a gene of interest (Horlbeck et al. 2016). We then transduced each line with two guide RNAs (gRNAs) that targeted either cGAS or STING, and we verified via western blot that these guides strongly suppressed cGAS and STING expression, respectively (Figure 4H). However, we found that silencing cGAS or STING had no effect on either EpCAM expression or invasive behavior in Ts5 (Figure 4I-K). Thus, whole-chromosome aneuploidy is capable of triggering metastatic behavior in a cGAS/STING-independent manner.
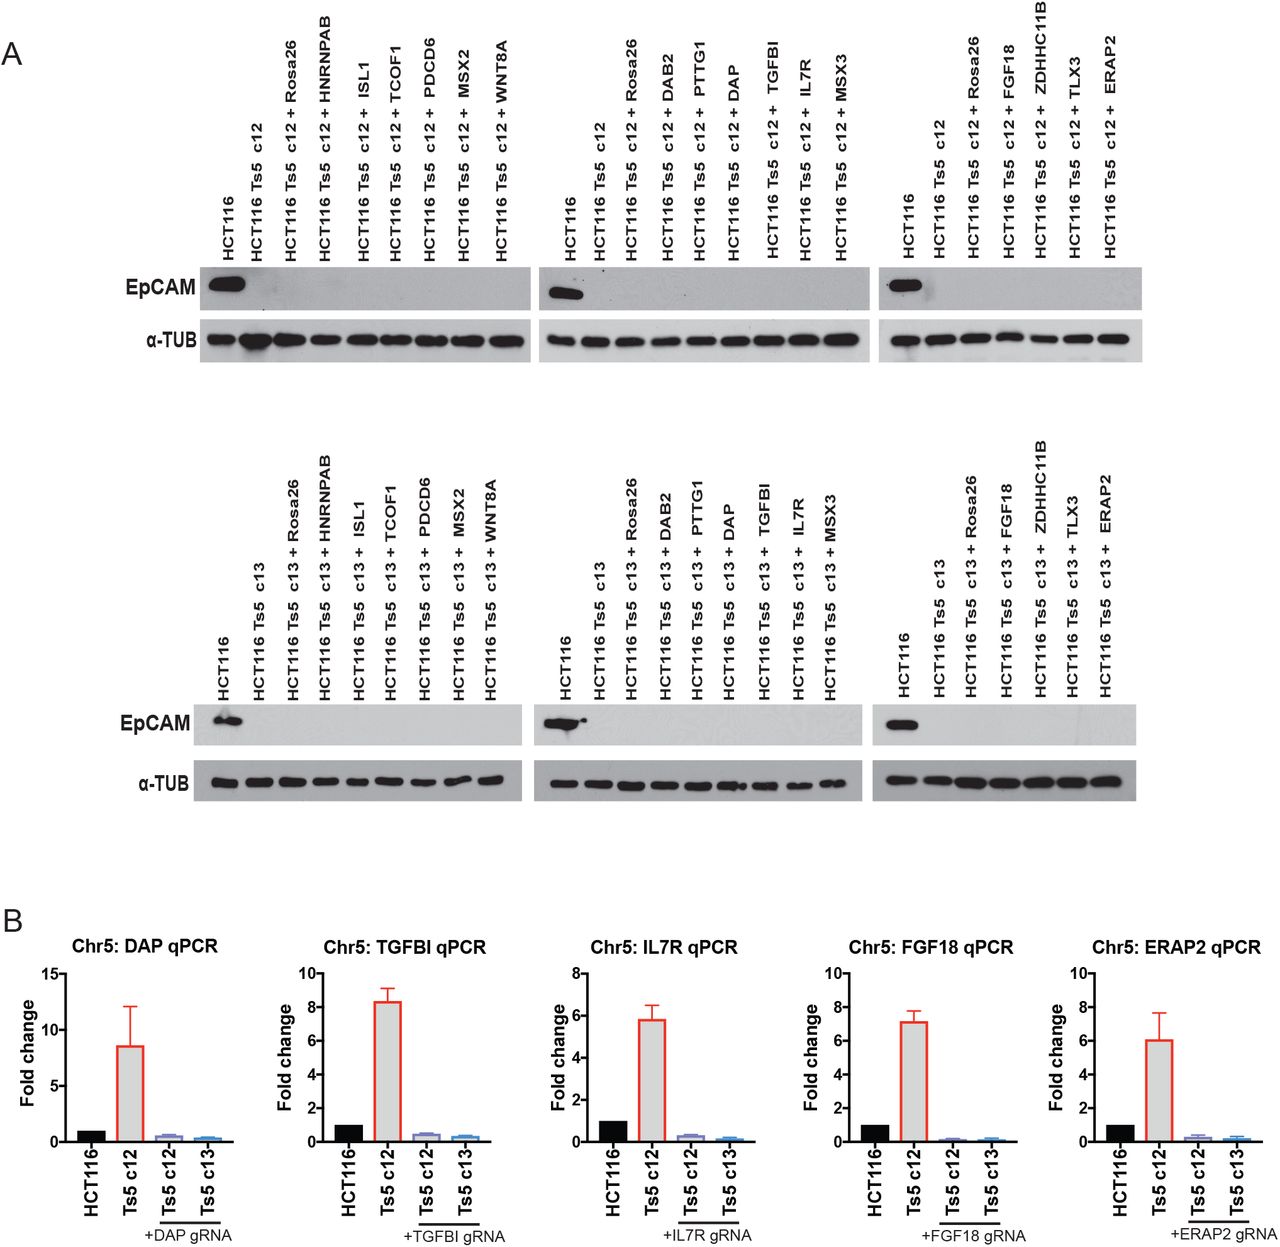
We hypothesized that the over-expression of a gene or genes on chromosome 5 led to the silencing of epithelial genes and the increased invasive behavior in HCT116 Ts5. We selected 16 candidate genes encoded on chromosome 5 that had known roles in development, signal transduction, or gene regulation, and we decreased their expression with CRISPRi in two independent Ts5 clones. However, none of these knockdowns was sufficient to restore EpCAM expression (Figure S8, Table S1B-S2). The metastatic behavior of HCT116 Ts5 may therefore result from the coordinated over-expression of several Chr5 genes, or from a gene not included among this panel.

Western blot analysis of EpCAM expression In HCT116 Ts5 clone 12 and clone 13, transduced with 16 gRNAs targeting genes on chromosome 5.
CRISPRi knockdown validation for five of the guide RNAs used in (A).
Different chromosomal aneuploidies are associated with distinct clinical outcomes
Our results indicate that whole-chromosome aneuploidies have the capability to either promote or inhibit metastatic behavior. Additionally, our previous research has demonstrated that certain aneuploidies can directly suppress transformation (Sheltzer et al. 2017). Yet, clinically, aneuploidy is widely reported to correlate with cancer progression and aggressive disease (Merkel and McGuire 1990). How can these disparate observations be reconciled?
To address this, we performed Cox proportional hazards survival modeling on 10,686 patients with 27 different types of cancer from The Cancer Genome Atlas (TCGA; other abbreviations are defined in Table S3A). In this approach, one or more clinical variables are regressed against patient outcome, allowing us to identify features that correlate with prognosis. Here, we report the Z scores from these models, which capture both the directionality and significance of a particular clinical association. 10,133 of these patients’ tumors have been analyzed by SNP-chip, allowing their tumors’ bulk karyotype to be determined (Taylor et al. 2018). Tumors in the TCGA lack comprehensive annotation of metastases, so we instead used either “overall survival” or “progression-free survival” as clinical endpoints for this analysis (Table S3A).
First, we regressed each tumor’s total aneuploidy burden against patient outcome. We determined that highly-aneuploid cancers were associated with a significantly worse prognosis than tumors with low aneuploidy in nine of 27 different patient cohorts (Figure 5A-B). In the remaining 18 cancer types, no significant association was detected, and we did not find any cohorts in which high aneuploidy portended a favorable outcome. Some cancer types in which aneuploidy has previously been reported to be a prognostic biomarker were not found to exhibit a significant correlation in this analysis (e.g., lung cancer; Choma et al. 2001); this may be because of differences in the technology used to measure aneuploidy, differences between patient populations, or because of the limited number of patients included in some cohorts. The acquisition of aneuploidy was linked to the loss of p53 function, as p53-mutant tumors tended to have higher levels of aneuploidy than p53-wild-type tumors (Figure S9A). However, the overlap between p53 mutations and highly-aneuploid tumors was unable to fully account for the prognostic significance of aneuploidy: in multivariate Cox regression models that included both p53 status and aneuploidy, high aneuploidy burden was still significantly correlated with poor survival in six different cohorts (Figure S9B-C).

The total number of arm-length aneuploidies per sample is plotted for p53-wildtype and p53-mutant tumors from each TCGA cohort. Boxes represent the second and third quartiles, while bars indicate the 10th and 90th percentiles.
Z scores from bivariate Cox proportional hazards modeling that combine p53-mutation status and aneuploidy score (split at the 20th and 80th percentiles) are displayed.
Kaplan-Meier curve in uterine carcinoma demonstrating that aneuploidy burden is still associated with poor prognosis in p53-mutant tumors.

The total number of aneuploid chromosomes in each tumor was calculated according to (Taylor et al. 2018). In each cancer type, patients were subdivided into two groups: low aneuploidy (≤ 20th percentile aneuploidy score) and high aneuploidy (≥ 80th percentile aneuploidy score). Kaplan-Meier curves are shown for three cancer types.
Z scores from Cox-proportional hazards analysis based on the aneuploidy scores, as described above, are displayed. Note that Z > 1.96 indicates a significant association between higher aneuploidy and death, while Z < −1.96 indicates a significant association between higher aneuploidy and survival.
A heatmap comparing chromosome arm copy number vs. patient outcome across 10,133 patients with 27 different types of cancer. The color-bar indicates the Z score from the Cox analysis. For visualization purposes, Z scores were capped at 4 and −4.
A heatmap comparing dichotomized chromosome arm copy number vs. patient outcome across 10,133 patients with 27 different types of cancer. In this analysis, survival was compared between patients in which a given arm was gained and patients in which a given arm was either lost or was copy-neutral. The color-bar indicates the Z score from the Cox analysis. For visualization purposes, Z scores were capped at 4 and −4.
Representative Kaplan-Meier curves of two instances in which chromosome gains are associated with improved patient prognosis.
A heatmap comparing dichotomized chromosome arm copy number vs. patient outcome across 10,133 patients with 27 different types of cancer. In this analysis, survival was compared between patients in which a given arm was lost and patients in which a given arm was either gained or was copy-neutral. The color-bar indicates the Z score from the Cox analysis. For visualization purposes, Z scores were capped at 4 and −4.
Representative Kaplan-Meier curves of two instances in which chromosome losses are associated with improved patient prognosis.
Scatter plots comparing the average chromosome copy number vs. the Z score obtained from Cox analysis for three different cancer types.
A bar graph displaying the average chromosome copy number across all 27 cancer types, binned based on the Z score from the Cox model.
We next set out to determine how specific aneuploidies influenced patient prognosis. We constructed Cox models to interrogate the relationship between the alteration status of each chromosome arm (“loss”, “neutral”, or “gain”) and patient outcome across the 27 cohorts. This analysis revealed 160 arm-length aneuploidies that were associated with survival time (Figure 5C and Table S3B). In every cancer type, at least one arm-length alteration was associated with outcome, indicating that specific aneuploidies can be prognostic factors even in cancer types in which bulk aneuploidy is uninformative. Consistent with the divergent results that we obtained in RPE1 and HCT116 cells, chromosome 5 was not strongly associated with outcome across cancer types. This suggests that genetic- or cell type-specific alterations affect the relationship between aneuploidy and metastatic behavior.
For 66 arm-length aneuploidies, a positive relationship was uncovered between chromosome copy number and survival (Z > 1.96), while for 94 aneuploidies a negative relationship (Z < −1.96) was found. These results could be consistent with two different models: a positive Z score could indicate that tumors that harbor an amplification of that chromosome have a worse prognosis than tumors that lack that amplification, or it could indicate that tumors that have lost a copy of that chromosome have a better prognosis than tumors that are copy-neutral. Similarly, negative Z scores could indicate that chromosome losses accelerate patient death or that chromosome gains protect against it. To differentiate between these models, we re-analyzed the TCGA survival and karyotype data, binning “loss” and “neutral” calls together, or binning “gain” and “neutral” calls together (Figure 5 D-G and Table S3C-D). This analysis revealed that in ∼87% of cases, the aneuploidy event (either gain or loss) was associated with worse patient outcome. However, strikingly, in ∼13% of cases, the gain or loss of a chromosome arm correlated with improved patient survival. For instance, glioblastomas that are copy-neutral or have lost Chr10p have a median survival time of 422 days, while glioblastomas that harbor a gain of Chr10p have a median survival time of 1987 days (Figure 5E). Thus, while most aneuploidies correlate with poor patient prognosis, aneuploidy of many different individual chromosomes can be associated with decreased tumor aggressiveness.
If aneuploidy is capable of either promoting or suppressing aggressive behavior, then why is bulk tumor aneuploidy a common hallmark of poor prognosis? To address this, we compared the arm-level Z scores obtained from our survival analysis with the overall frequency of each aneuploidy event. We found that, in general, chromosome arms that were associated with poor prognosis when amplified were significantly more likely to be gained than lost in primary tumors. Similarly, arms whose deletions correlated with dismal survival were more commonly lost than gained (Figure 5H-I). For instance, in head and neck squamous cell carcinoma, 8q amplifications are associated with poor prognosis, and this chromosome arm was gained in 54% of patients and lost in <1% of patients. In contrast, 3p deletions are a biomarker of poor prognosis, and this chromosome arm was lost in 61% of patients and gained in <1% (Figure 5H). This suggests that aneuploidies capable of suppressing aggressive behavior are selected against during tumor development, leading to an enrichment of metastasis-promoting aneuploidies, even though they represent only a fraction of all possible copy number changes.
Discussion
Stoichiometric imbalances in endogenous proteins caused by aneuploidy interfere with multiple cellular functions (Sheltzer and Amon 2011). It is therefore conceivable that cell motility, matrix degradation, and the other processes necessary for invasive behavior might also be perturbed by aneuploidy-induced dosage imbalances. Thus, while aneuploidy is a hallmark of cancer, aneuploidy in itself might potently suppress certain functions otherwise needed for tumorigenicity and metastasis. To investigate the relationship between aneuploidy and metastasis, we have generated and analyzed a series of modified cell lines that differ from each other by a single chromosome. Using this system, we discovered that single-chromosome gains can have multifaceted effects on several proxies for metastatic ability. Across 13 different trisomies, 12 inhibited or had a minor effect in metastasis assays.
HCT116 cells harboring an extra copy of chromosome 5 behaved differently from every other trisomy studied and displayed a clear increase in invasiveness. We traced this phenotype to an aneuploidy-induced partial epithelial-mesenchymal transition, in which the specific amplification of chromosome 5 causes the silencing of epithelial cell adhesion genes. This effect is independent of cGAS/STING signaling, and we posit that the over-expression of one or more genes on chromosome 5 cooperate to induce this phenotypic switch. Aneuploidy-induced cell state transitions may be a novel cause of the strong correlation between aneuploidy and death from cancer. Additionally, recent evidence has underscored the importance of phenotypic plasticity in the metastatic cascade and has suggested that an EMT is neither a necessary nor an irreversible step in cancer cell dissemination (Zheng et al. 2015; Fischer et al. 2015). Instead, cancer cells can lose certain epithelial characteristics to promote migration out of the primary tumor site and into circulation, but they can re-establish them (through a mesenchymal-epithelial transition) in order to colonize a distant location (Dongre and Weinberg 2019). Aneuploidy, too, can be reversible: gaining and losing chromosomes through CIN could contribute to this plasticity and allow cancer cells to switch between different phenotypic states.
CIN has previously been reported to directly influence metastasis by triggering a cGAS/STING-dependent EMT and increase in cell motility. By generating CIN with Mps1 inhibitors, we have verified the link between chromosomal instability and cGAS/STING activation, but we find that these inhibitors suppress rather than promote metastatic behavior. These results demonstrate that increased invasiveness is not an obligate consequence of either CIN or cGAS/STING signaling and may instead depend on the mechanism by which CIN arises. As CIN causes the acquisition of aneuploidy, we believe that, as with the single-chromosome trisomic cell lines that we have characterized, CIN-induced proteome deregulation may interfere with the processes necessary to achieve a metastasis-competent state. Low levels of CIN, or CIN that allows the development of rare, metastasis-promoting aneuploidies, may be necessary to observe the conditions under which CIN enhances metastasis. Additionally, as several Mps1 inhibitors have entered clinical trials in human patients (Xie et al. 2017), our results further suggest that one potential benefit of Mps1 inhibition as a therapeutic strategy may be an overall decrease in metastatic dissemination.
Interestingly, while Ts5 enhanced metastasis in HCT116 cells, this same chromosome mildly suppressed metastatic behavior when added to retinal-pigment epithelial cells. We speculate that the gain of chromosome 5 has a specific effect on HCT116 cells based on their genetic and epigenetic background, and our pan-cancer analysis of aneuploidy-associated patient mortality supports this hypothesis. Many aneuploidies exhibit distinct clinical associations in different cancer types: for instance, Chr10p losses are associated with poor survival in gliomas and kidney cancers, but Chr10p amplifications are associated with poor survival in leukemia and hepatocellular carcinoma (Table S3B). We further observed that, among amplified chromosomes, Chr8q gains showed the strongest correlation with patient death, but this association was only present in six of 27 cancer types (Table S3B). We find no evidence to support the hypothesis that specific aneuploidies are universal metastasis promoters (Duesberg et al. 2006). Instead, the consequences of each aneuploidy are closely tied to the original tumor type. Yet, chromosome copy number changes can provide raw fodder for tumor evolution. While a subset of aneuploidies do in fact correlate with decreased aggressiveness in patient samples, these aneuploidies are rarely observed. The copy number changes that instead drive malignant behavior are selected through evolution, and thus “deadly” aneuploidies appear to be more common than they actually are. These results reconcile the apparent contradiction between the behavior of artificially-constructed aneuploid cells, which almost always display a pronounced growth defect, and the aggressive behavior of aneuploid human tumors (Stingele et al. 2012; Sheltzer et al. 2017).
Methods
Cell lines and tissue culture conditions
The identity of each human cell line was verified by STR profiling (University of Arizona Genetics Core, Tucson, AZ). The karyotype of every aneuploid cell line used in this manuscript was verified with the SMASH technique (Wang et al. 2016) or had been previously analyzed with a similar low-pass whole-genome sequencing method (Sheltzer et al. 2017). The names of the clones and their karyotypes are summarized in Table S4. HCT116, DLD1, RPE1, Cal51, SW480 were grown in DMEM supplemented with 10% FBS, 2 mM glutamine, and 100 U/mL penicillin and streptomycin. T47D cells were grown in RPMI supplemented with 10% FBS, 6.94 μg/ml insulin (Thermo Fisher, Waltham, MA; BN00226), 2 mM glutamine, and 100 U/ml penicillin and streptomycin. A549 cells were grown in Ham F12 supplemented with 10% FBS, 100 U/mL penicillin and streptomycin and 2 mM glutamine. All cell lines were grown in a humidified environment at 37°C and 5% CO2.
Karyotype analysis with SMASH
Cells were trypsinized and resuspended in PBS, centrifuged at 1000 rpm for 5 minutes, and then the pellets were collected. Total cellular genomic DNA was isolated using the Qiagen QIAamp kit (Cat. No. 51036). SMASH karyotyping was performed as described (Wang et al. 2016). In brief, total cell genomic DNA was enzymatically fragmented to a mean size of ∼40bp and joined to create chimeric fragments of DNA suitable for creating NGS libraries (300-700bp). The fragment size selection was done with Agencourt AMPure XP beads (Beckman Coulter, Cat. No. A63881). Illumina-compatible NEBNext Multiplex Dual Index Primer Pairs and adapters (New England Biolabs, Cat. No. E6440S) were ligated to the selected chimeric DNA fragments. These barcoded DNA fragments were then sequenced using an Illumina MiSeq. Bin boundaries were determined empirically by apportioning valid SMASH mappings from 56 CHD trios sequenced at high depth to a fixed number of bins such that the minimum bin count is maximized and the remaining bins are populated as evenly as possible (Andrews et al. 2016; Andrews 2017). Approximately 2% of the resulting bins showed significant variation in count across the CHD population and were thus excluded from further analysis and display using both automated means and human review. The generated reads were demultiplexed and mapped using custom scripts, and plots were generated with G-Graph (Andrews 2017).
Single-cell sequencing
HCT116 cells were plated into 6 well cell culture plates and 24hr later the cells were treated with 1μM AZ3146. The next day, the media was changed. 24hr later, the cells were trypsinized and single-cell sorted into 96 well PCR plates (ThermoFisher Scientific, Cat. No. AB0731) containing cell lysis buffer (0.1% SDS, 2% Triton) and incubated at 65°C for 1 hour. In brief, genomic DNA was enzymatically digested with NlaIII (NEB, Cat. No. R0125). Both ends of fragments were tagged by using oligonucleotides that contain cell-barcode, universal primer and several random nucleotides, “varietal tags”, through ligation and extension reactions. Cell barcodes allow us to multiplex samples, and the tags allow unique counting of initial DNA fragments. After amplification by universal primer, the fragment size selection was performed with Agencourt AMPure XP beads (Beckman Coulter, A63881) to obtain ideal length range of fragments for sequencing. Barcoded sequencing adapters were ligated to the DNA fragments which allows us to further multiplex samples for sequencing. Next generation sequencing was done on an Illumina MiSeq and demultiplexed using customized scripts and karyotype plots were generated with G-Graph (Andrews 2017).
Invasion and migration assays
For transwell migration assays, cells were plated in the upper chamber of the transwell insert (Corning Cat. No. 3464, 24-well insert, pore size: 8 µm). For DLD1 and HCT116 cells, 3 × 10⁴ cells were seeded, while for RPE1 cells 1× 10⁴ cells were seeded. For transwell invasion assays, cells were plated in the top chamber with Matrigel-coated membranes (Corning Cat. No. 354480, 24-well insert, pore size: 8 µm). For DLD1, 1 × 10⁵ cells were seeded, for HCT116, 2 × 10⁵ cells were seeded, and for RPE1, 1.5 × 10⁴ cells were seeded. Cells in the upper chamber were plated in serum-free DMEM, while media with 10% FBS was added to the lower chamber. The plates were incubated for 24 hours at 37°C, and then the cells on the upper surface were removed using cotton swabs. The membranes were then fixed in methanol and stained with crystal violet dye. The membranes were cut out and mounted on to slides. They were imaged at 40x (15-20 images) and counted to obtain the average number of cells per field that migrated or invaded. Two to three chambers were used per cell line and/or condition. For experiments using Mps1 inhibitors, the cells were either treated for 24 hours with the indicated drug, followed by 24 hours of drug-free washout prior to seeding, or the cells were treated with the indicated drug for 24 hours and then seeded immediately.
Scratch assays
For scratch assays, 1−1.5 × 10⁶ cells were seeded on a 6-well dish and 24 hours later (at around 90% confluency) the monolayer was scratched with a 200 µL pipette tip. The cell culture plate was then placed in an inverted Zeiss Observer for live-cell imaging (5% CO2, 37°C). Phase contrast images were taken every 30 mins for 22 h at 8-10 positions along the scratch and 2-3 trials were repeated for each cell line and condition. Data was analyzed with ImageJ to determine the scratch area remaining using the Wound Healing Tool Macro (Collins 2007). For experiments with Mps1 inhibitors, the cells were either treated for 24 hours with the indicated drug followed by 24 hours of drug-free recovery prior to seeding, or the cells were treated with the indicated drug for 24 hours immediately after seeding.
Western blot analysis
Whole cell lysates were harvested and resuspended in RIPA buffer [25 mM Tris, pH 7.4, 150 mM NaCl, 1% Triton X 100, 0.5% sodium deoxycholate, 0.1% sodium dodecyl sulfate, protease inhibitor cocktail (Sigma, Cat. No. 4693159001), and phosphatase inhibitor cocktail (Sigma, Cat. No. 4906845001)]. Quantification of protein concentration was done using the RC DC Protein Assay (Bio-Rad, Hercules, CA; Cat. No. 500–0119). Equal amounts of lysate were denatured and loaded onto a 10% SDS-PAGE gel. The Trans-Blot Turbo Transfer System (Bio-Rad) and polyvinylidene difluoride membranes were used for protein transfer. Antibody blocking was done with 5% milk in TBST (19 mM Tris base, NaCl 137 mM, KCl 2.7 mM and 0.1% Tween-20) for 1 hour at room temperature except for E-cadherin, cGAS, N-cadherin and Vimentin which used 5% BSA in TBST. The following antibodies and dilutions were used: E-cadherin (Cell Signal, Danvers, MA; Cat. No. 3195) at a dilution of 1:1000 (5% BSA), N-cadherin (Cell Signal; Cat. No. 13116) at a dilution of 1:1000 (5% BSA), Vimentin (Cell Signal; Cat. No. 5741) at a dilution of 1:1000 (5% BSA), EpCAM (Abcam, Cambridge, MA; Cat. No. ab124825) at a dilution of 1:1000 (5% milk), Claudin-7 (Abcam; Cat. No. ab27487) at a dilution of 1:1000 (5% milk), Fibronectin (Abcam; Cat. No. ab32419) at a dilution of 1:1000 (5% milk), cGAS (Sigma-Aldrich; Cat. No. HPA031700) at a dilution of 1:1000 (5% BSA), and STING (Cell Signal; Cat. No. 13647) at a dilution of 1:2000 (5% milk). Blots were incubated with the primary antibody overnight at 4°C. Anti-alpha tubulin (Sigma-Aldrich; Cat. No. T6199) at a dilution of 1:20,000 was used as a loading control. Membranes were washed at RT 3 times (10 mins each) before they were incubated in secondary antibodies for an hour at RT. HRP goat anti-mouse (Bio-Rad; Cat. No. 1706516) at 1:50,000 was used for tubulin blots while HRP goat anti-rabbit (Abcam; Cat. No. ab6721) at 1:30,000 was used for all other primary antibodies. Membranes were washed 3 times again (15 min each) and developed using ProtoGlow ECl (National Diagnostics; Cat. No. CL-300) and autoradiographic film (Lab Scientific; XAR ALF 2025).
Overexpression of E-Cadherin and EpCAM
The following plasmids were obtained from Applied Biological Materials (Richmond, BC, Canada): E-cadherin (Cat. No. LV704934), EpCAM (Cat. No. LV149412) and an empty control plasmid (Cat. No. LV591). The plasmids were transfected into HCT116 Trisomy 5 cells using Lipofectamine 3000 (ThermoFisher, Cat. No. L3000001). The cells were then selected with puromycin for 2 weeks and then bulk-sorted with FACS for RFP-expressing cells. Invasion assays and western blot analysis was performed on cells that were expanded following FACS purification.
CRISPRi plasmid construction and virus generation
Guide RNAs for CRISPRi experiments were chosen from (Horlbeck et al. 2016). Guides were cloned into the LRG2.1 mCherry vector (Addgene; Cat. No. 108099) using a BsmBI digestion as previously described (Giuliano et al. 2019). Plasmids were transformed in Stbl3 E. coli (Thermo Fisher; Cat. No. C737303) and sequenced to confirm the presence of the correct gRNA sequence. A dCas9-KRAB construct (Addgene; Cat. No. 85969) was used to knock down target gene expression. Guide RNA sequences are listed in Table S1A.
Lentivirus was generated using calcium phosphate transfection as previously described (Chang et al. 2013). Supernatant was harvested at 2 to 3 intervals 48 to 72 hr post-transfection by filtering through a 0.45 μm syringe, and then frozen at −80° C for later use or supplied directly to cells with 4 μg/mL polybrene.
RNA isolation and quantitative real-time PCR
Total cellular RNA was extracted and isolated using TRIzol (Life Technologies; Cat. No. 15596018) and a Qiagen RNeasy Mini Kit (Cat. No. 74106). Total RNA was converted to cDNA using SuperScriptTM III First-Strand System kit (ThermoFisher Scientific; Cat. No. 18080051). Quantitative PCR was performed for the target genes using SYBR Premier Ex Taq (Takara; Cat No. RR420L) and quantified using the QuantStudio 6 Flex Real-Time PCR system (Applied Biosystems). Primers are listed in Table S2.
Immunofluorescence and Microscopy
Cells were placed on autoclaved 12mm x 12mm glass coverslips in twelve well cell culture plates. The next day, the cells were treated with the indicated drug in separate cell culture wells. 24 hours later, fresh culture media was added for a post-drug recovery period of 24 hours. Later they were fixed with either 4% paraformaldehyde for 15 min at RT (when staining for of STING) or cold (−20 °C) methanol for 5min at RT (when staining for Rel-B). For STING, selective plasma membrane permeabilization was done using 0.02% Saponin in TBS for 2 min. For Rel-B, nuclear permeabilization was done using 0.15% of Triton X-100 in TBS for 10 min. TBS + 1% BSA + 22.52 mg/ml of glycine was used as a blocking agent for 45 minutes. TBS + 1%BSA was used as blocking agent during primary antibody staining (STING at a dilution of 1:1000; Abcam Cat. No. ab181125; RelB at a dilution of 1:500; Abcam Cat. No. ab180127) overnight at 4 °C. After washing the cells, they were incubated with goat anti-rabbit Alexa Fluor 647 (at a dilution of 1:1000; Abcam Cat. No. ab150083). The coverslips were treated with DAPI (0.1ug/ml in TBS) for 2 min. The coverslips were then mounted with Prolong Diamond Antifade Mountant (ThermoFisher Scientific; Cat No., P36965). The cells were viewed on a spinning disk confocal microscope (UltraVIEW Vox; PerkinElmer) and quantified using Volocity version 6.3.
Live cell imaging
HCT116 cells expressing H2B-GFP were seeded and treated with Mps1 inhibitors as indicated. Live-cell imaging was performed at room temperature using spinning-disc confocal microscopy system (UltraVIEW Vox; PerkinElmer) and a charged-coupled device camera (ORCA-R2; Hamamatsu Photonics) fitted to an inverted microscope (DMI6000 B; Leica) equipped with a motorized piezoelectric stage (Applied Scientific Instrumentation). Long-time course imaging was performed using a Plan Apochromat 20X 0.7 NA air objective with camera binning set to 2×2. Image acquisition and analysis was performed using Volocity version 6.3 (PerkinElmer).
Quantification of micronuclei
Cells were seeded onto twelve well cell-culture plates. The next day, the cells were treated with Mps1 inhibitors as indicated. A drug post-recovery period of 24 hours was given to the cells. The cells were then stained with Hoescht 33342 (Invitrogen; Cat. No. H3570) at 5 ng/ml for 20min at 37°C. The cells were viewed under Nikon Eclipse Ti-S microscope and quantified using NIS elements BR version 4.40.
Knocking-in AZ3146-resistance mutations with CRISPR-mediated HDR
Mps1-targeting guides and single-stranded donor templates to introduce the AZ3146-resistance mutations were designed using Benchling (www.benchling.com). In addition to the C604W and S611G alterations, multiple silent mutations were included in the donor oligo to prevent re-cutting following template-mediated repair (Table S1A). Guide RNAs were cloned into the Lenti-Cas9-gRNA-GFP vector (Addgene # 124770) as previously described (Giuliano et al. 2019). To perform CRISPR-mediated HDR, 2μg of Mps1 gRNA plasmid was transfected along with 100 pmol of ssODN into Cas9-expressing cell lines using Lipofectamine 3000 (Thermo Fischer Scientific, Cat. No. L3000015). Successful knock-in was confirmed using the primers listed in Table S1A.
TCGA data analysis
Survival data for TCGA patients was acquired from (Liu et al. 2018). Karyotype data for TCGA patients was acquired from (Taylor et al. 2018). P53 mutation data for TCGA patients was acquired from (Bailey et al. 2018). Across the 33 available TCGA cohorts, we first eliminated the six cohorts with fewer than 100 patients. Next, we chose “overall survival time” as a default endpoint, as it reflects an objective and unambiguous event. However, we noted that five of the remaining cohorts had fewer than 15 deaths; for those five cohorts we used “progression free interval” as a clinical endpoint rather than “overall survival” (Table S3A).
To assess the link between bulk aneuploidy and patient outcome, we compared survival between “low aneuploidy” tumors (≤ 20th% aneuploidy score) and “high aneuploidy” tumors (≥ 80th% aneuploidy score. Cox proportional hazards modeling was performed using Python, pandas, rpy2 and the R survival package. For analysis including p53, only tumors that harbored a non-synonymous mutation were considered p53-mutant (missense, non-sense, or frameshift). Code written for this analysis is available at github.com/joansmith/aneuploidy-survival. This analysis also relied on packaged code from (Smith and Sheltzer 2018), now also available at github.com/joansmith/biomarker-survival for ease of reuse.
Acknowledgments
We thank members of the Sheltzer Lab for helpful comments on this work. Research in the Sheltzer Lab is supported by an NIH Early Independence Award (1DP5OD021385), a Breast Cancer Alliance Young Investigator Award, a Damon Runyon-Rachleff Innovation Award, a Gates Foundation Innovative Technology Solutions grant, and a CSHL-Northwell Translational Cancer Research Grant. This work was performed with assistance from the CSHL Flow Cytometry Shared Resource, which is supported by the CSHL Cancer Center Support Grant 5P30CA045508. Research in the Wigler Lab was supported by grants to M. Wigler from the Simons Foundation (SFARI 497800) and Life Sciences Founders Directed Giving-Research (award numbers 519054).
References


