

Abstract
Soil organisms are crucial for ecosystem services that support human life. However, little is known about the distribution, diversity and threats facing them. Here, we compiled a global dataset of sampled earthworm communities from over 7000 sites in 56 countries to predict patterns in earthworm diversity, abundance, and biomass. Further, we identify the environmental drivers shaping these patterns. Local species richness and abundance typically peaked at higher latitudes, while biomass peaked in the tropics, patterns opposite to that observed in many aboveground taxa. But similar to many aboveground taxa, climate variables were more important in shaping earthworm communities than variables relating to soil or habitat cover. These findings highlight that, while the environmental drivers are similar, conservation strategies to conserve aboveground biodiversity might not be appropriate for earthworm diversity.
Main Text
Despite repeated calls for large-scale biogeographic studies of soil organisms (1–3), global biodiversity patterns remain relatively unknown, with most efforts focused on soil microbes (4–6), the smallest of the soil organisms. Consequently, the drivers of soil biodiversity, particularly soil fauna, remain unknown at global scales. Nevertheless, soils harbour high biodiversity (7–11), and are responsible for a large number of ecosystem functions and services that we rely upon for our well-being (9, 10, 12, 13).
Here we analyse global patterns in diversity, abundance and biomass of earthworms (hereafter ‘community metrics’). Earthworms are considered ecosystem engineers (14) in many habitats, and contribute to soil quality (e.g., nutrient availability through decomposition 15–17). They also directly provide a variety of vital ecosystem functions and services (18). Whereas most biodiversity-ecosystem functioning studies focus on species richness as a diversity measure (19–21), the provisioning of ecosystem functions by earthworms is likely to vary depending on abundance (22), biomass (23–25), and ecological group of the earthworm species (24, 26, 27; see Supplementary Materials and Methods). Consequently, understanding global patterns in community metrics for earthworms is critical.
Our ecological understanding of global biodiversity patterns (e.g., latitudinal diversity gradients 28, 29) are largely based on the distribution of aboveground taxa only. For many aboveground taxa, variables relating to climate (30–33) or energy (e.g., primary productivity 34; evapotranspiration 35, 36) are often the most important predictors of diversity across large scales. At large scales, climatic drivers also shape belowground communities (5, 37–41), but the response to these drivers in belowground communities may differ from those seen aboveground (5, 42, 43). For example, mean annual temperature positively correlates aboveground diversity (44), but negatively correlates with the diversity of many classes of fungi (5), likely due to the optimum temperature of the latter being exceeded (45).
From small scale field studies we know that soil properties such as pH and soil carbon will influence earthworm diversity (40, 46, 47). For example, lower pH values constrain the diversity of earthworms by reducing calcium availability (48), and soil carbon provides resources that sustain diversity (46). Alongside the many interacting soil properties (40), there are a variety of other drivers can shape earthworm diversity, such as climate and habitat cover (46, 49, 50). However, to date, no single framework focused on soil fauna has integrated a comprehensive set of environmental drivers to identify the most important ones.
As many soil organisms have shown global diversity patterns that differ from aboveground organisms (5, 42, 43, 51), we anticipate that earthworm community metrics (particularly diversity) will not follow global patterns seen aboveground. This would be consistent with previous studies at smaller scales, which have shown that species richness of earthworms increases with latitude (40, 50). Because studies have shown that local earthworm communities are highly influenced by soil properties, we furthermore expect soil properties (e.g., pH and soil organic carbon) to be key environmental drivers of earthworm communities.
We collated 181 earthworm diversity datasets from the literature and unpublished field studies (162 and 19, respectively) to create a dataset spanning 56 countries (all continents except Antarctica) and 7048 sites (Figure 1a). We used this raw data to explore key characteristics of earthworm communities (species richness, abundance and biomass), and determine the environmental drivers that shape earthworm biodiversity. We then used the relationships between earthworm community metrics and environmental drivers to predict local earthworm communities across the globe. Here, we present the first global maps describing earthworm biodiversity, distilled into three earthworm community metrics: diversity, abundance, and biomass.
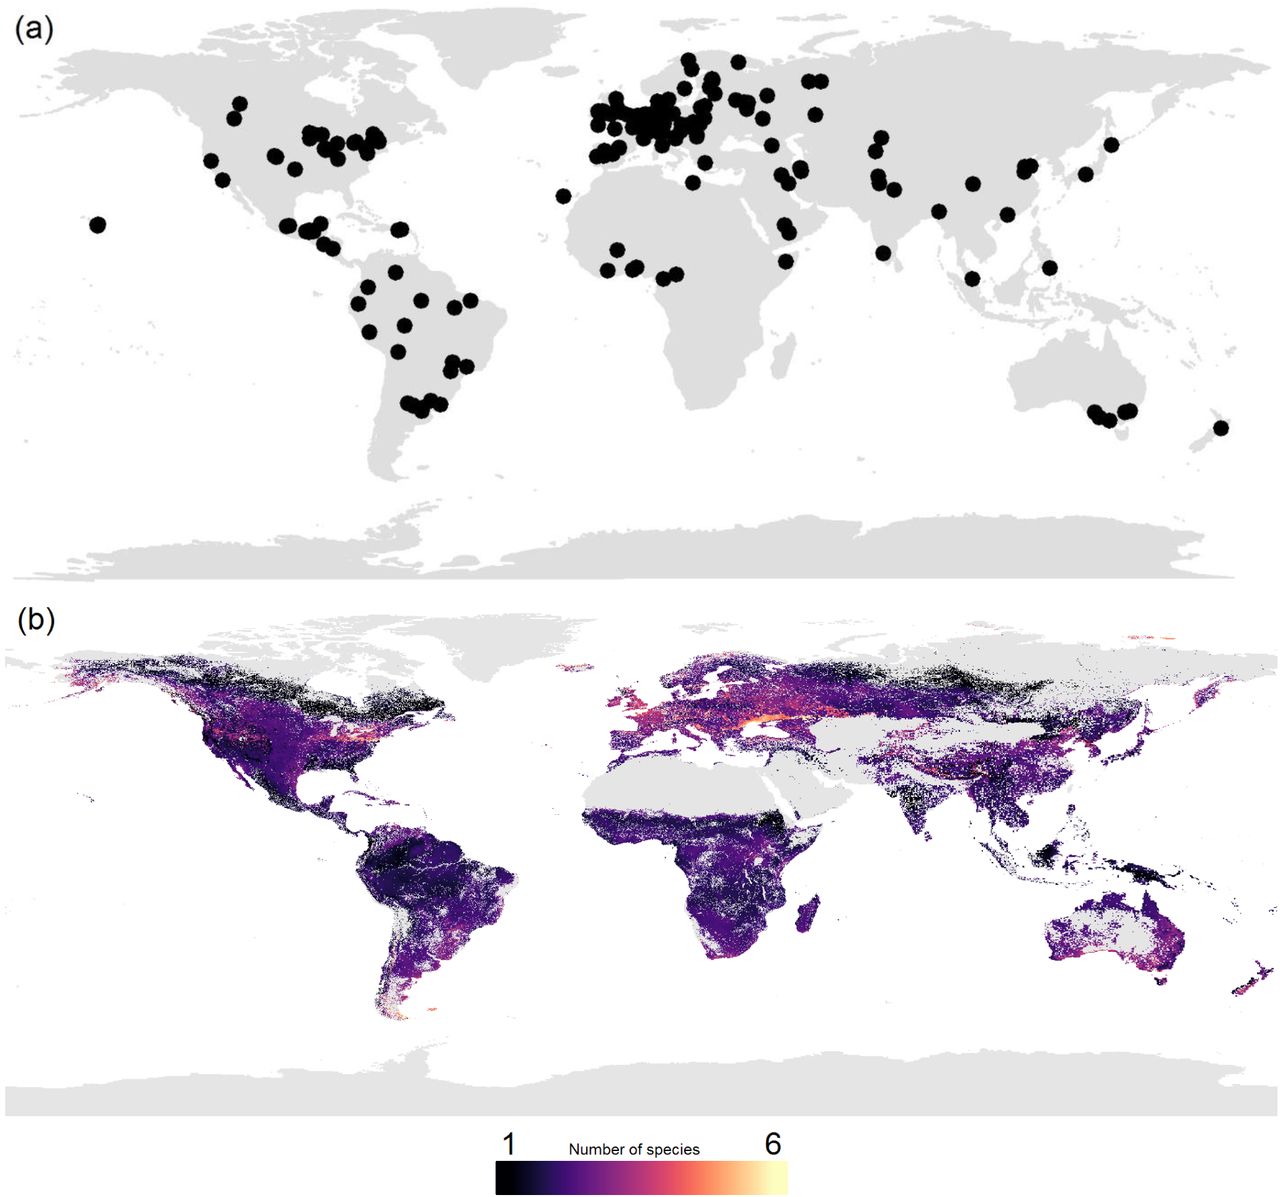

(a) Map of the distribution of data, showing any record that was used in at least one of the three models (species richness, abundance, and biomass). Each black dot represents the centre of a ‘study’ (i.e., a set of data with consistent methodology, see Supplementary Materials and Methods). In total, 229 studies were included (from 181 datasets), which equated to 7048 sites across 56 countries. (b-d): The globally predicted values from the three biodiversity models, species richness (within site, ~1m2; panel b), abundance (panel c; individuals per m2), and biomass (panel d; grams per m2). Areas of high diversity are shown in yellow colours, and areas of low diversity are shown in dark purple colours. Grey areas are habitat cover categories which lacked samples of earthworm commuties, thus lack predictions. To prevent outliers skewing the visualization of results, the colour of maps were curtailed at the extreme low and high values. Curtailing was based on where the majority of values laid. Thus, values lower or higher than that number marked on the scale are coloured the same but may represent a large range of values.
Three mixed effects models were constructed for each of the three community metrics; species richness (calculated within a site, ~1m2), abundance per m2, and biomass per m2. Each model contained 12 environmental variables as main effects (Supplementary Table 2) which were grouped into six themes; ‘soil’, ‘precipitation’, ‘temperature’, ‘water retention’, ‘habitat cover’ and ‘elevation’ (see Supplementary Materials and Methods). Within each theme, each model contained interactions between the variables. Following model simplification, all models retained most of the original variables, but some interactions were removed (Supplementary Table 3). All models performed well in cross-validation (Supplementary Figure 2) with relatively high R2 values (Supplementary Table 4 a and c, see Supplementary Material for further details).
Predicting across global environmental data layers, local diversity of earthworms was estimated to range between 1 and 4 species across most of the terrestrial globe (Figure 1b) (mean: 1.98 species; SD: 0.55). These values are in line with previous suggestions (47). The lowest values of species richness occurred across the boreal/subarctic regions, which was expected based on aboveground biodiversity patterns. However, low diversity also occurred in subtropical and tropical areas, such as India and Indonesia, in contrast with commonly observed macroecological patterns. This low earthworm diversity could be due to these regions typically being outside of the optimal temperature range (12-20°C 52) for earthworms. Areas of high local species richness were at mid-latitudes, such as the southern tip of South America, and the southern regions of Australia and New Zealand. Europe (particularly north of the Black Sea) and northeastern USA also had particularly high local species richness. While this pattern contrasts with the latitudinal diversity patterns found in many aboveground organisms (28, 29, 53), it is consistent with patterns found in some belowground organisms (ectomycorrhizal fungi 5, bacteria 41, nematodes 54, 55), but not all (arbuscular mycorrhizal fungus 39, oribatid mites 56). The mismatch between above- and belowground biodiversity has been predicted (42, 51, 57). This work highlights the fact that it is important that soil organism diversity patterns are examined in concert with those of aboveground taxa if we want to fully understand large-scale patterns of biodiversity and their underlying drivers (43, 58).
However, the patterns seen could be as a result of past climates, in particular glaciation in the last ice age. With the expectation that regions in the mid-to high latitudes that were previously glaciated would be re-colonised by earthworm species with high dispersal capabilities and large geographic ranges (50). Thus mid-latitude communities would have high local diversity but minimal beta-diversity, and the opposite would be true in the tropical regions. When the number of unique species within each 5 degree latitude band was calculated (i.e., regional richness, Figure 2a) there was no evidence of a latitudinal diversity gradient once sampling effects have been accounted for (Figure 2b). This highlights that even with relatively low sampling effort in the tropics (Figure 2a), endemism of earthworms (59) and beta diversity within the region (i.e., across the sites; 50, 60) must be considerably higher than within the well-sampled temperate region.

(a) The number of unique species within each 5 degree latitude band (grey bars) and the number of sampled sites within the same latitude band (red line). (b) Sampled-based rarefied species richness within each 5 degree latitude band. Latitude bands with less than 22 sites were not included in the analysis.
Across the globe, predicted total abundance of the local community of earthworms typically ranged between 5 and 150 individuals per m2, in line with estimates from Curry (46) (Figure 1c; mean: 57.00 individuals per m2; SD: 43.59). There was a slight tendency for areas of higher community abundance to not be in the tropics, but in temperate areas such as Europe (particularly the UK, France and Ukraine), New Zealand, and part of the Pampas and surrounding region (South America). Lower community abundance occurred in many of the tropical and sub-tropical regions, such as Brazil, central Africa, and parts of China. In regions of lower earthworm abundance the relationship between community abundance and ecosystem function (61–63) implies a lower provision of the ecosystem services performed by these organisms. Further research is needed to disentangle whether these functions are in fact reduced or whether they are carried out by other soil taxa (64).
The predicted total biomass of the local earthworm community across the globe typically ranged between 1 g and 150 g per m2 (Figure 1d; mean: 380.86g; SD: 47684.3, see Supplementary Materials and Methods for discussion in regards to extreme values). The areas of high earthworm biomass were spread across the globe, but concentrated in the tropics (particularly Indonesia, parts of Coastal West Africa, Southern Central America, much of Colombia and Western Venezuela), some regions of North America and the Eurasian Steppe. In some regions this was almost the inverse of the abundance patterns (Figure 1c), thus these results may relate to the fact that earthworms decrease in body size towards the poles (65, 66), unlike other animals (e.g., birds and mammals 67). This decrease in earthworm body size might be due to smaller-bodied earthworms with greater dispersal capabilities recolonising northern regions following deglaciation post-ice age (50). In northern North America, where there are no native earthworms (68, 69), high density and, in some regions, high biomass of earthworms likely reflects the earthworm invasion of these regions. The invasive smaller European earthworm species likely encounter an enormous unused resource pool, which leads to exceptionally high population sizes (70). In contrast, in Brazil, where we had a relatively higher sampling density (Figure 1a), patterns of abundance and biomass corresponded with the earthworm species that have been documented there. There are a number of giant earthworm species (71) within Brazil (and other countries in the tropics, such as Indonesia, where a similar pattern is shown). These giant earthworms normally occur at low densities and low species richness (72), causing the patterns observed of high biomass but low abundance.
For all three of the community metric models (species richness, abundance, and biomass), climatic variables were the most important drivers (the ‘temperature’ theme being the most important for both species richness and total biomass models, and ‘precipitation’ theme for the community abundance model; Figure 3). The importance of climatic variables is consistent with many aboveground taxa (e.g., plants 31, reptiles/amphibians/mammals 34) and belowground taxa (bacteria and fungi 5, 41, nematodes 55, springtails 73) when examined at large scales. This suggests that climate related methods and data, which are typically used for the estimation of aboveground biodiversity by macroecologists, may also be suitable for estimating earthworm communities. However, the strong link between climatic variables and earthworm community metrics is cause for concern, as climate has been and will continue to change due to anthropogenic activities over the coming decades (74). Our findings further highlight that changes in temperature and precipitation are likely to influence earthworm diversity (75–77) and their distributions (40, 78). The expansion or shifts in distributions may be particularly problematic in the case of invasive earthworms, such as in North America (68, 79). However, a change in climate will most likely affect abundance and biomass of the earthworm communities before diversity, as shifts in the latter depend upon dispersal capabilities, which are relatively low in earthworms: 10m per year (80) compared to 600m per year for the average terrestrial organism (81). This underscores the need to study earthworms in terms of multiple community metrics in order to accurately assess responses of communities to climate change.

Based on RandomForest models, the importance of the six variable themes from the three biodiversity models. Each row shows the results of each model (top: species richness, middle: abundance, bottom: biomass). Each column represents a theme of variables that was present in the simplified biodiversity model. In the main plot area, the most important variable group has the largest circle. Within each row, the circle size of the other variable themes are scaled in size depending on the relative change in importance. Thus, the circle size should only be compared within a row. Variable theme importance, calculated from the node impurity, was the weighted average of all variables within each theme, following simplification.
Habitat cover and soil properties still influenced the earthworm community (Supplementary Figure 3 a and b) and in the case of habitat cover, especially the community structure in relation to the three ecological groups (epigeic, endogeics and anecics, see Supplementary Material and Methods and Supplementary Figure 4). Across larger scales, climate will influence both the habitat cover and the soil properties, all of which will affect earthworm communities. Being able to account for this indirect effect with appropriate methods and data may alter the perceived importance of soil properties and habitat cover (e.g., with pathway analysis 33). In addition, for soil properties, the mismatch in scale between community metrics and soil properties taken from global layers (for sites where sampled soil properties were missing; see supplementary methods and materials) could also reduce the apparent importance of the theme.
By compiling a global dataset of earthworm communities we show, for the first time, the global distribution of earthworm diversity, abundance and biomass, and identify key environmental drivers responsible for these patterns. Our findings suggest that climate change might have significant and serious effects on earthworm communities and the functions they provide. Despite earthworm communities being driven by similar environmental drivers as aboveground communities (31, 33), this relationship results in different patterns of diversity. We highlight the need to integrate belowground organisms into the global biodiversity paradigm to fully understand global patterns of biodiversity. Our study creates an avenue for future research: given that climate was the most important predictor of earthworm communities, it is possible for ecologists who have previously focused on modelling aboveground diversity to use similar methods belowground. By modelling both realms, aboveground/belowground comparisons are possible, potentially allowing a clearer view of the biodiversity distribution of whole ecosystems.
Author contributions:
Competing interests:
Data and materials availability:
Acknowledgments
Funding: ML was supported by the TULIP Laboratory of Excellence (ANR-10-LABX-41). KSR was supported by (ERD-ADV grant 323020 to WvdP).
sDIV
References
- 1.↵
- 2.
- 3.↵
- 4.↵
- 5.↵
- 6.↵
- 7.↵
- 8.
- 9.↵
- 10.↵
- 11.↵
- 12.↵
- 13.↵
- 14.↵
- 15.↵
- 16.
- 17.↵
- 18.↵
- 19.↵
- 20.
- 21.↵
- 22.↵
- 23.↵
- 24.↵
- 25.↵
- 26.↵
- 27.↵
- 28.↵
- 29.↵
- 30.↵
- 31.↵
- 32.
- 33.↵
- 34.↵
- 35.↵
- 36.↵
- 37.↵
- 38.
- 39.↵
- 40.↵
- 41.↵
- 42.↵
- 43.↵
- 44.↵
- 45.↵
- 46.↵
- 47.↵
- 48.↵
- 49.↵
- 50.↵
- 51.↵
- 52.
- 53.↵
- 54.↵
- 55.↵
- 56.↵
- 57.↵
- 58.↵
- 59.↵
- 60.↵
- 61.↵
- 62.
- 63.↵
- 64.↵
- 65.↵
- 66.↵
- 67.↵
- 68.↵
- 69.↵
- 70.↵
- 71.↵
- 72.↵
- 73.↵
- 74.↵
- 75.↵
- 76.
- 77.↵
- 78.↵
- 79.↵
- 80.↵
- 81.↵


