

Abstract
Characterizing the mode – the way, manner, or pattern – of evolution in tumours is important for clinical forecasting and optimizing cancer treatment. DNA sequencing studies have inferred various modes, including branching, punctuated and neutral evolution, but it is unclear why a particular pattern predominates in any given tumour [1]. Here we propose that differences in tumour architecture alone can explain the variety of observed patterns. We examine this hypothesis using spatially explicit population genetic models and demonstrate that, within biologically relevant parameter ranges, tumours are expected to exhibit diverse evolutionary modes including four archetypal “oncoevotypes”: rapid clonal expansion (predicted in leukaemia); progressive diversification (in colorectal adenomas and early-stage colorectal carcinomas); branching evolution (in invasive glandular tumours); and almost neutral evolution (in certain non-glandular and poorly differentiated solid tumours). We thus provide a simple, mechanistic explanation for a wide range of empirical observations. Oncoevotypes are driven by differences in cell dispersal and cell-cell interactions, which we show are essential for accurately characterizing, forecasting and controlling tumour evolution.
A tumour is a product of somatic evolution in which interacting processes of mutation, selection, genetic drift, and cell dispersal generate a patchwork of cell subpopulations (clones) with varying degrees of aggressiveness and treatment sensitivity [2]. A primary goal of modern cancer research is to characterize this evolutionary process, so as to enable precise, patient-specific prognostic forecasts and to optimize targeted therapy regimens.
Much progress has been made in revealing the evolutionary features of particular cancers, yet these findings raise as many questions as they answer. Why do different tumour types exhibit different modes of evolution [1, 3, 4, 5, 6]? What conditions sustain the frequently observed pattern of branching evolution, in which several clones diverge and evolve in parallel [1, 7]? And why do some pan-cancer analyses indicate that many tumours evolve neutrally [8], whereas others support extensive selection [9]?
Factors proposed as contributing to intra-tumour evolution include microenvironmental heterogeneity, niche construction, and positive ecological interactions between clones [10, 2]. However, because such factors have not been well characterized across human cancer types, it remains unclear how they might relate to evolutionary modes.
On the other hand, it is well established that tumours exhibit a wide range of architectures. In leukaemia, for example, mutated stem cells in semi-solid bone marrow produce cancer cells that mix and proliferate in the bloodstream (Figure 1a). Colorectal adenomas and early-stage colorectal carcinomas, by contrast, inherit the glandular organization of normal intestine and spread via glandular fission (bifurcation) [11] (Figure 1b). At later stages, solid tumours of many types assume a glandular or acinar structure and disperse by budding and tissue invasion [12] (Figure 1c). Most well-differentiated adenocarcinomas and squamous cell carcinomas of multiple primary sites (including late-stage colorectal carcinomas) show this growth pattern. Other tumour types such as hepatocellular carcinoma, undifferentiated carcinomas of multiple primary sites, and some benign tumours instead comprise a dense mass of cells with a well-delineated boundary around each tumour nodule (Figure 1d). Microenvironmental heterogeneity can impose additional spatial structure; in particular, hypoxia or physical barriers can prevent cell dispersal except near the tumour boundary.

a, Acute myeloid leukaemia, M2 subtype, bone marrow smear. b, Early stage colon cancer (patient TCGA-A6-2684, slide 01Z-00-DX1). c, Non-small cell lung cancer (patient TCGA-44-6147, slide 01Z-00-DX1). d, Hepatocellular carcinoma (patient TCGA-CC-5258, slide 01Z-00-DX1). Image a is courtesy of Cleo-Aron Weis; images b, c and d were retrieved from The Cancer Genome Atlas at https://portal.gdc.cancer.gov, with brightness and contrast adjusted linearly for better visibility. Scale bars are 100 μm. Dotted curves outline exemplary tumour glands (b and c). e-h. Corresponding spatial structures and modes of cell dispersal.
Despite such observed diversity, previous models of tumour population genetics have typically been limited to a single type of spatial structure and a single mode of cell dispersal (Methods; Supplementary Table 1). The evolutionary effects of tumour architecture have not been systematically examined.
Variation in tumour evolutionary mode
Because gene flow is among the principal forces that shape population genetics, we hypothesized that the different tumour structures illustrated in Figure 1 might result in different tumour evolutionary modes. Conventional methods for predicting evolutionary outcomes are inapplicable in the context of range expansion with high mutation rates and strong selection. Therefore, to test our hypothesis, we developed a way to formulate multiple classes of mathematical models, each tailored to a different class of tumour, within a general framework, and we implemented this framework as a stochastic computer program.
Our approach is built on basic tenets of cancer evolutionary theory [2]. Simulated tumours arise from a single cell that has acquired a fitness-enhancing mutation. Each time a tumour cell divides, its daughter cells can acquire passenger mutations, which have no phenotypic effect, and more rarely driver mutations, which confer a fitness advantage. In solid tumours, we assume that cells compete with one another for space and other resources. Whereas previous studies have assumed that tumours grow into empty space, our model also allows us to simulate the invasion of normal tissue that is a defining feature of malignancy.
To examine effects of varying tumour architecture, we analyse models with different spatial structures and modes of cell dispersal while keeping constant the driver mutation rate and the distribution of driver mutation effects. We set dispersal rates such that, in all cases, tumours take a similar amount of time to grow from one cell to one million cells, corresponding to several years in real time.
Our first example model is a limiting case with no spatial structure, which has been proposed as an appropriate model of leukaemia evolution [13]. Initially, we assume that the tumour cell division rate only slightly exceeds the death rate, so that the tumour grows at a slow exponential rate. In the absence of spatial constraints, rapid clonal expansions can result from driver mutations that increase the cell division rate by as little as a few percent. For plausible parameter values, the vast majority of cells at the end of the simulation share the same set of driver mutations, and typically no cell has more than two drivers (Figure 2a).

Four oncoevotypes predicted by our model. a, Dynamics of driver mutation diversity in 20 stochastic simulations of a non-spatial branching process (initial death rate 0.98, relative to initial division rate). Diversity corresponds to the number of clones that have distinct combinations of driver mutations. A generation is defined as the expected cell cycle time of the initial tumour cell. Black curves correspond to the individual simulations illustrated in subsequent panels (having metrics closest to the medians of sets of 100 replicates). b, Muller plots of clonal dynamics over time, for a non-spatial branching process. Colours represent clones with distinct combinations of driver mutations (the original clone is grey-brown; subsequent clones are coloured using a recycled palette of 26 colours). Descendant clones are shown emerging from inside their parents. c, Final clone proportions. d, Driver phylogenetic trees. Node size corresponds to clone population size at the final time point and the founding clone is coloured red. Only clones whose descendants represent at least 1% of the final population are shown. e-h, Results of a model of tumour growth via gland fission (8,192 cells per gland). In the spatial plot (g), each pixel corresponds to a patch of cells, corresponding to a tumour gland, coloured according to the most abundant clone within the patch. i-l, Results of a model in which tumour cells invade normal tissue at the tumour boundary (512 cells per gland). m-p, Results of a boundary-growth model of a non-glandular tumour. In all cases, the driver mutation rate is 10−5 per cell division, and the mean of the exponential distribution of driver fitness effects is 10%. Other parameter values are listed in Supplementary Table 2.
In our second model, consistent with the biology of colorectal adenomas and early-stage colorectal carcinomas [11], and in common with previous studies [4, 14], we simulate a tumour that consists of large glands (at least 2,000 cells per gland [15]) and that grows via gland fission. Although the driver mutation rate and the driver phenotypic effect are exactly the same as in the previous case, the addition of spatial structure dramatically alters the evolutionary mode. The organization of cells into glands limits the extent to which driver mutations can spread through the population. As the tumour grows larger, selective sweeps become progressively localized, leading to ever greater spatial diversity, with different combinations of driver mutations predominating even in neighbouring glands (Figure 2b). This pattern is maintained even if cells are able to acquire drivers that directly increase the gland fission rate, because such mutations rarely spread within demes (Supplementary figure 2a).
Our third case corresponds to a glandular tumour that grows by invading normal tissue. To parameterize this model, we estimated the number of cells per gland in well-differentiated adenocarcinomas – one of the most abundant types of human cancer across primary sites – using semi-automated analysis of histopathological slides selected at random for three patients with advanced colorectal cancer, a tumour type with pronounced stromal infiltration and spatially separated glands [16]. We delineated a total of 41 clearly separated glands in whole-slide images from the three patients and counted the cells in each gland with digital pathology software [17] (Supplementary figure 1).
In cross section, the number of cells per gland ranged from 14 to 1,563, with 68% of cases between 50 and 500 cells (Supplementary Table 3). It is therefore reasonable to assume that each gland of an invasive, acinar tumour can contain between a few hundred and a few thousand interacting cells. This range of values is, moreover, remarkably consistent with results of a recent study that used a very different method to infer the number of cells in tumour-originating niches. Across a range of tissue types, the latter study concluded that cells typically interact in communities of 300-1,900 cells [18].
In contrast to the fission case, simulated invasive glandular tumours typically exhibit branching evolution and stepwise increases in driver diversity (Figure 2c). Because competition between tumour cells and normal cells amplifies selection, even small increases in cell fitness can spark rapid clonal expansions. Nevertheless, even if cells are able to invade neighbouring glands within the tumour bulk (Supplementary figure 2b), clonal interference inhibits selective sweeps. The result is a zonal tumour, with large regions sharing the same combination of driver mutations.
Our fourth and final model represents a tumour with no glandular structure and with growth confined to its boundary, which has been proposed as a particularly appropriate model of liver cancer nodules [19, 6]. The spatial structure of this model favours genetic drift, rather than selection. For our fixed parameter values, tumour evolution in the boundary-growth case is effectively almost neutral (Figure 2d). Selection is only slightly more prominent when cells can compete with neighbours within the tumour mass (Supplementary figure 2c).
Comparison with multi-region sequencing data
Our modelling results demonstrate that variation in spatial structure and mode of cell dispersal is sufficient to generate very distinct tumour evolutionary modes or “oncoevotypes”. To further explore how outcomes vary between models, and to see how our results compare with clinical data, we are compelled to summarize outcomes using a small set of metrics. Theoretically, the rich information conveyed in Figure 2 cannot be condensed into only a few variables. In practice, however, we find that oncoevotypes can be clearly distinguished using two simple, intuitive measures. The first metric is the diversity of driver mutations. This metric roughly corresponds to the breadth of the driver phylogenetic tree (as in the final column of Figure 2). For fairer comparison with sequencing data, in calculating diversity we exclude driver mutations with frequencies below 1%, most of which are unlikely to be detectable in practice. The second metric is the mean number of driver mutations per cell, which roughly corresponds to the depth of the driver phylogenetic tree.
In terms of our two evolutionary metrics, the results of our four example models form four distinct clusters (Figure 3a). The non-spatial model typically results in only two driver mutations per cell (including one driver present in the cell of origin), and minimal diversity of driver mutations. Gland fission results in a high number of drivers per cell and especially high driver diversity. In the model of an invasive glandular tumour, diversity is intermediate, relative to the number of drivers per cell. Finally, in the boundary-growth model, both metrics are close to minimal. Neutral counterparts of these four models – which have identical parameter values, except that drivers have no phenotypic effect – cluster together, near the boundary-growth model.

Oncoevotypes distinguished in terms of summary metrics. a, Evolutionary metrics of four example models with different spatial structures and different modes of cell dispersal but identical driver mutation rates and identical driver mutation effects (100 stochastic simulations per model). Parameter values are. the same as in Figure 2. Neutral counterparts of the four models are represented together as an additional group. Black points correspond to kidney tumour (ccRCC) data, labelled with patient codes [7]. b, c, Variation in evolutionary metrics depending on gland size in invasive glandular tumours (b) and models of tumours growing via gland fission (c), with 100 stochastic simulations per model. Black points again correspond to ccRCC data.
Few studies have examined tumour evolutionary trajectories in sufficient detail to enable comparison with our model results. The most remarkable exception is a recent multi-centre study of kidney cancer (specifically, clear cell renal cell carcinoma, ccRCC) that involved multi-region, high-depth sequencing of 101 tumours, targeting a panel of more than 100 putative driver genes [7]. This data set is ideally suited for generating accurate driver phylogenetic trees (Figure 2 of ref [7]) that are readily comparable to the driver phylogenetic trees predicted by our models. We focus on five cases of ccRCC for which driver frequencies were reported in the original publication. These five tumours are representative of the larger cohort in exhibiting branching evolution, with between three and nineteen driver mutations per tumour (Supplementary figure 3a).
Since ccRCC is an invasive glandular tumour, we would expect ccRCC evolutionary modes to resemble outcomes of our invasive glandular model. Indeed, we find that the evolutionary metrics of the five tumours are highly consistent with an appropriate model (Figure 3a) and the two sets of driver trees have similar structures (Supplementary figure 3). This result is robust to varying gland size within plausible ranges (Figure 3b; Supplementary figure 2d).
Variation in tumour mutation frequency distributions
Because researchers and clinicians seldom have access to multi-regional sequencing data, nor the longitudinal data needed to track how tumour clone sizes change over time, tumour phylogenies and evolutionary parameters are instead typically inferred from mutation frequencies measured from a single biopsy sample at a single time point. The distribution of mutation frequencies (the site frequency spectrum or variant allele frequency spectrum) may potentially be used to infer the mode of evolution. Because our models track the complete phylogenies of simulated tumours at single-cell resolution, they allow us to examine how these mutation frequencies depend on both selection and spatial structure.
Current cancer sequencing technologies are neither sensitive enough to detect the majority of low frequency mutations, nor precise enough to distinguish between high frequency and clonal (100% frequency) mutations. Accordingly, for practical purposes, the most relevant part of the mutation frequency distribution is in the intermediate frequency range. A proposed way to examine differences between distributions within the intermediate range is to plot the cumulative mutation count (the number of mutations present at or above frequency f) versus the inverse mutation frequency, 1/f [8, 20]. In the neutral non-spatial model, the cumulative count is approximately proportional to 1/f (Figure 4a, blue points), and any large deviation from a straight line might then be taken as evidence of selection.
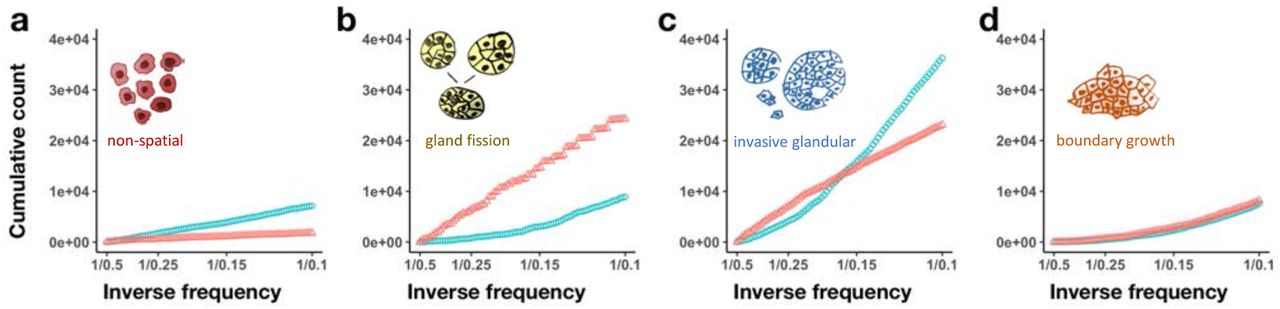
Mutant allele frequency distributions predicted by our model for simulations with only neutral mutations (blue points) or both neutral and driver mutations (red points). Cumulative mutant allele count is plotted against inverse mutant allele frequency (1/f), restricted to mutations with frequencies between 0.1 and 0.5. Each distribution represents combined data from 100 simulations. a, Non-spatial branching process. b, Tumour growth via gland fission, with 8,192 cells per gland. c, Tumour invasion of normal tissue at the tumour boundary, with 512 cells per gland. d, Boundary-growth model (1 cell per gland). Parameter values are the same as in Figure 2.
Our models indicate that tumour architecture has important effects on tumour mutation frequency distributions (Figure 4b-d; Supplementary figure 4). In particular, when the cumulative mutation count is plotted against the inverse mutation frequency (1/f), the curve for the neutral model no longer resembles a straight line. On the contrary, the average non-neutral model curve can be closer to a straight line than the average neutral model curve. Moreover, in some cases selection increases the gradient of the curve (Figure 4b) and in other cases reduces the gradient (Figure 4c). These results imply that methods using mutation frequencies to infer selection in solid tumours will yield incorrect conclusions if they fail properly to account for effects of gene flow.
Discussion
In summary, we have demonstrated that differences in spatial structure and the mode of cell dispersal provide a straightforward explanation for the spectrum of evolutionary modes observed in human tumours. This explanation depends only on well established tumour traits, avoiding the need to invoke variation in less well characterized factors such as fitness landscapes, clonal cooperation, or microenvironmental heterogeneity. The oncoevotypes we have identified are consistent with a wide range of empirical observations.
In line with previous mathematical analysis and numerical simulations [21, 13], our models illustrate that absence of spatial structure enables clonal expansions and can plausibly result in large tumours with only one or two driver mutations per cell. These dynamics indeed resemble those of blood cancers such as chronic myeloid leukaemia, which are the least spatially structured of human tumours, and in which cell proliferation is driven by a single change to the genome.
We find that models of tumour growth via gland fission instead produce a distinctive pattern of progressive diversification. Specifically, these dynamics arise when selection in the expanding population is much stronger at the within-gland level than at the between-gland level. All else being equal, we predict that larger tumour glands will result in more driver mutations per cell, and greater diversity of drivers (Figures 3c and 3c).
In invasive glandular tumours, we predict branching evolution, resulting in zonal heterogeneity. An invasive glandular morphology has indeed been associated with branching evolution, not only in clear cell renal cell carcinoma [7] but also in many other cancer types [1].
The least degree of selection is predicted in non-glandular or undifferentiated tumours. In this case, our results echo previous studies demonstrating that genetic drift can predominate when mutations can spread only by “surfing” on a wave of population expansion [22, 23]. Inasmuch as boundary-growth models describe hepatocellular carcinoma [19, 6], the predicted suppression of selection is consistent with other evidence for neutral evolution in that cancer type [6]. Nevertheless, previous computational modelling has shown that selection may play a greater role when cell dispersal gives rise to numerous, disconnected tumour nodules [19]. Suppression of selection in the boundary-growth model is also consistent with the existence of large, non-glandular benign tumours that only rarely progress to malignancy.
Our framework implies that some tumour types will transition from one oncoevotype to another as they progress. A previously proposed “big bang” model of colorectal cancer [4, 3] posits that early selective sweeps are followed by effectively neutral evolution, such that mutation frequency is determined by the time of mutation occurrence. This idea was examined using a computational model of tumour growth via gland fission, with a maximum of one driver mutation per cell [4]. Based on more realistic population genetic modelling, we instead find reason to expect ongoing selection throughout the early stages of colorectal tumour progression (when growth is driven by gland fission), enabling driver mutations to reach much higher frequencies than in the neutral case (Supplementary figure 5). As colorectal cancer becomes invasive, we predict a transition towards branching evolution within each of multiple invasive clones. This explanation is consistent with multiregion sequencing studies showing extensive diversification during colorectal cancer progression [4, 5], while also agreeing with results of comparative genomic analysis, which indicate that colorectal cancers evolve subject to strong positive selection and have substantially more driver mutations per tumour than most other cancer types [9].
An important implication of our work is that tumour architecture determines how well biopsy samples reflect intra-tumour heterogeneity. Oncologists typically base treatment decisions on the presence or absence of particular mutations in cells taken from only a small region of a solid tumour. In general, our framework predicts that biopsy samples will be most representative of non-glandular tumours with well-delineated boundaries, such as hepatocellular carcinoma nodules, and least representative of tumours that grow via glandular fission, such as early-stage colorectal carcinomas (Figure 2). As discussed above, this prediction generally aligns with conclusions drawn from multi-region sequencing.
Whereas previous mathematical modelling studies have focussed on phenotypic effects of driver mutations [4, 14, 21], our perspective instead emphasizes the importance of gene flow in tumour evolution. And whereas the prevailing consensus is to categorize cancers in terms of intra-tumour diversity [24], our findings motivate new research efforts to quantify parameters of cell dispersal and cell-cell interactions. We contend that accurately characterizing tumour ecology will be an essential first step in the quest to develop patient-specific models of tumour progression, as well as models for optimizing treatment regimens to constrain the emergence of drug resistance [25, 26].
A particular implication of this change in perspective relates to resolving a prominent debate about the prevalence of neutral tumour evolution [27]. The most compelling evidence for neutral evolution in human cancers is based on the observation that the mutation frequency distributions of many tumours resemble the null distribution predicted by a non-spatial neutral model [8]. However, in the present study we have extended previous work [28] showing that, even in the neutral case, spatial structure is expected to distort mutation frequency distributions in solid tumours, potentially obscuring signatures of selection. Although we find that evolution may be effectively neutral within a few specific tumour types, our results are generally consistent with extensive selection, in line with findings from pan-cancer comparative genomics [9].
Our framework progresses the state of the art in modelling intra-tumour evolution. Nevertheless, in balancing biological realism with simplicity and generality, we have necessarily omitted a number of factors that may further influence tumour evolutionary dynamics. The effects of spatially-varying carrying capacity, alternative modes of cell dispersal, and density-dependent tumour growth provide especially interesting topics for further investigation.
Code availability
Mathematical model code is open source [29]. Muller plots were drawn using the ggmuller R package [30].
Author contributions
R.N. conceived the research question and designed and created the modelling framework. R.N. and D.B. performed analysis of data from the model. J.N.K. obtained and analysed histopathological data. R.N. wrote the manuscript with critical comments and input from N.B., D.B. and J.N.K. All authors have read and edited the final manuscript.
Methods
Previous mathematical models of tumour population genetics
Many previous studies of tumour population genetics have used non-spatial branching processes [21, 13], in which cancer clones grow exponentially without interacting. Among spatial models, a popular option is the Eden growth model (or boundary-growth model), in which cells are located on a regular grid with a maximum of one cell per site, and a cell can divide only if an unoccupied neighbouring site is available to receive the new daughter cell [31, 19]. Other methods with one cell per site include the voter model [32, 19, 33] (in which cells can invade neighbouring occupied sites) and the spatial branching process (in which cells budge each other to make space to divide). Further mathematical models have been designed to recapitulate glandular tumour structure by allowing each grid site or “deme” to contain multiple cells and by simulating tumour growth via deme fission throughout the tumour [4] or only at the tumour boundary [14]. A class of model in which cancer cells are organized into demes and disperse into empty space has also been proposed [34, 23]. Supplementary Table 1 summarizes selected studies representing the state of the art of stochastic modelling of tumour population genetics.
Our main methodological innovations are to implement all of these distinct model structures, as well as models of invasive tumours, within a common framework, and to combine them with methods for tracking driver and passenger mutations at single-cell resolution. The result is a highly flexible framework for modelling tumour population genetics that can be used to examine consequences of variation not only in mutation rates and selection coefficients, but also in factors that control gene flow.
Computational model structure
Simulated tumours in our models are made up of patches of interacting cells located on a regular grid of sites. In keeping with the population genetics literature, we refer to these patches as demes. All demes within a model have the same carrying capacity, which can be set to any positive integer. Each cell belongs to both a deme and a genotype. If two cells belong to the same deme and the same genotype then they are identical in every respect, and hence the model state is recorded in terms of such subpopulations rather than in terms of individual cells. For the sake of simplicity, computational efficiency, and mathematical tractability, we assume that cells within a deme form a well-mixed population. The well-mixed assumption is consistent with previous mathematical models of tumour evolution [4, 14, 34, 23] and with experimental evidence in the case of stem cells within colonic crypts [35].
Initial conditions
A simulation begins with a single tumour cell located in a deme at the centre of the grid. If the model is parametrized to include normal cells then these are initially distributed throughout the grid such that each deme’s population size is equal to its carrying capacity. Otherwise, if normal cells are absent, then the demes surrounding the tumour are initially unoccupied.
Stopping condition
The simulation stops when the number of tumour cells reaches a threshold value. Because we are interested only in tumours that reach a large size, if the tumour cell population succumbs to stochastic extinction then results are discarded and the simulation is restarted (with a different seed for the pseudo-random number generator).
Within-deme dynamics
Tumour cells undergo stochastic division, death, dispersal, and mutation events, whereas normal cells undergo only division and death. The within-deme death rate is density-dependent. When the deme population size is less than or equal to the carrying capacity, the death rate takes a fixed value d0 that is less than the initial division rate. When the deme population size exceeds carrying capacity, the death rate takes a different fixed value d1 that is much greater than the largest attainable division rate. Hence all genotypes grow approximately exponentially until the carrying capacity is attained, after which point the within-deme dynamics resemble a birth-death Moran process – a standard, well characterized model of population genetics.
In all spatially structured simulations we set d0 = 0 to prevent demes becoming empty. For the well-mixed model, we set d0 > 0 and dispersal rate equal to zero, so that all cells always belong to a single deme (with carrying capacity greater than the maximum tumour population size).
Mutation
When a cell divides, each daughter cell inherits its parent’s genotype plus a number of additional mutations, drawn from a Poisson distribution. Each mutation is unique, consistent with the infinite-sites assumption of canonical population genetics models. Whereas some previous studies have examined the effects of only a single driver mutation (Supplementary Table 1), in our model there is no limit on the number of mutations a cell can acquire. Most mutations are passenger mutations with no phenotypic effect. The remainder are drivers, each of which increases the cell division or dispersal rate.
The program records each genotype’s immediate ancestor and the matrix of hamming distances between genotypes (that is, how many mutations are not shared by each pair of genotypes), which together allow us to reconstruct the entire tumour phylogeny. To improve efficiency, the distance matrix excludes genotypes that failed to grow to more than ten cells and failed to produce any other genotype before becoming extinct.
Driver mutation effects
Whereas previous models have typically assumed that the effects of driver mutations combine multiplicatively, this can potentially result in implausible trait values (especially in the case of division rate if the rate of acquiring drivers scales with the division rate). To remain biologically realistic, our model invokes diminishing returns epistasis. Specifically, the effect of a driver is to multiply the trait value r by a factor of 1+s(1−r/m), where s > 0 is the mutation effect and m is an upper bound. Nevertheless, because we set m to be much larger than the initial value of r, the combined effect of drivers in all models in the current study was approximately multiplicative. For each mutation, the value of the selection coefficient s is drawn from an exponential distribution.
Dispersal
Depending on model parametrization, dispersal occurs via either invasion or deme fission. In the case of invasion, the dispersal rate corresponds to the probability that a cell newly created by a division event will immediately attempt to invade a neighbouring deme. This particular formulation ensures consistency with a standard population genetics model known as the spatial Moran process. Because the dispersal rate is a probability, all values greater than or equal to 1 are equivalent. The destination deme is chosen uniformly at random from the four nearest neighbours (Von Neumann neighbourhood). Invasion can be restricted to the tumour boundary, in which case the probability that a deme can be invaded is N/K, where N is the number of tumour cells in the deme and K is the carrying capacity. If a cell fails in an invasion attempt then it remains in its original deme. If invasion is not restricted to the tumour boundary then invasion attempts are always successful.
In fission models, a deme can undergo fission only if its population size is greater than or equal to carrying capacity. As with invasion, deme fission immediately follows cell division (so that results for the different dispersal types are readily comparable). The probability that a deme will attempt fission is equal to the sum of the dispersal rates of its constituent cells. Deme fission involves moving half of the cells from the original deme into a new deme, which is placed beside the original deme. If the dividing deme contains an odd number of cells then the split is necessarily unequal, in which case each deme has a 50% chance of receiving the larger share. Genotypes are redistributed between the two demes without bias according to a multinomial distribution. Cell division rate has only a minor effect on deme fission rate because a deme created by fission takes only a single cell generation to attain carrying capacity.
If fission is restricted to the tumour boundary then the new deme’s assigned location is chosen uniformly at random from the four nearest neighbours, and if the assigned location already contains tumour cells then the fission attempt fails. If fission is allowed throughout the tumour then an angle is chosen uniformly at random, and demes are budged along a straight line at that angle to make space for the new deme beside the original deme.
Our particular method of cell dispersal is chosen to enable comparison between our results and those of previous studies and to facilitate mathematical analysis. In particular, when the deme carrying capacity is set to 1, our model approximates an Eden growth model (if fission is restricted to the tumour boundary, or if dispersal is restricted to the tumour boundary and normal cells are absent), a voter model (if invasion is allowed throughout the tumour), or a spatial branching process (if fission is allowed throughout).
To fairly compare different spatial structures and modes of cell dispersal, we set dispersal rates in each case such that the time taken for a tumour to grow from one cell to one million cells is approximately the same as in the neutral Eden growth model with maximal dispersal rate. This means that, across models, the cell dispersal rate decreases with increasing deme size. Given that tumour cell cycle times are of the order of a few days, the timespans of several hundred cell generations in our models realistically correspond to several years of tumour growth.
Two versus three dimensions
We chose to conduct our study in two dimensions for two main reasons. First, the effects of deme carrying capacity on evolutionary dynamics are qualitatively similar in two and three dimensions, yet a two-dimensional model is simpler, easier to analyse, and easier to visualize. Second, we aimed to create a method that is readily reproducible using modest computational resources and yet can represent the long-term evolution of a reasonably large tumour at single-cell resolution.
One million cells in two dimensions corresponds to a cross-section of a three-dimensional tumour with many more than one million cells. Therefore, compared to a three-dimensional model, a two-dimensional model can provide richer insight into how evolutionary dynamics change over time. Developing an approximate, coarsegrained analogue of our model that can efficiently simulate the population dynamics of very large tumours with different spatial structures in three dimensions is an important direction for future research.
Implementation
The program implements Gillespie’s exact stochastic simulation algorithm [36] for statistically correct simulation of cell events. The order of event selection is 1. deme, 2. cell type (normal or tumour), 3. genotype, and 4. event type. At each stage, the probability of selecting an item (deme, cell type, genotype or event type) is proportional to the sum of event rates for that item, within the previous item.
Diversity metric
To measure diversity of driver mutation combinations, we use the inverse Simpson index defined as  , where pi is the frequency of the ith combination of driver mutations. For example, if the population comprises k types of equal size then pi = 1/k for every value of i, and so D = 1/(k × 1/k2) = k. Furthermore, in the hypothetical case where each clone is replaced by α daughter clones with equal frequencies, we have D = 2α(n−1), where n is the average number of drivers per cell.
Our diversity metric fulfils the same purpose as the intratumour heterogeneity (ITH) measure used in the TRACERx renal study [7], and indeed the two metrics are strongly correlated across our models (Spearman’s ρ = 0.93). Our metric has three main advantages compared to ITH: first, D is a continuous variable; second, D is robust to methodological differences that affect ability to detect low frequency mutations; third, D is not directly dependent on our second evolutionary metric (the number of driver mutations per cell).
Acknowledgments
We thank Katharina Jahn, Richard Neher, Andreas Deutsch, Kiril Korolev and Cleo-Aron Weis for helpful discussions. R.N. and N.B. were supported by ERC Synergy Grant 609883. J.N.K. was supported by the German Consortium for Translational Cancer Research (DKTK/DKFZ) fellowship program and by RWTH Aachen START grant 2018/691906. R.N. was also supported by the National Cancer Institute of the National Institutes of Health under Award Number U54CA217376. The content is solely the responsibility of the authors and does not necessarily represent the official views of the National Institutes of Health.


