

Abstract
Fluidics based single cell RNASeq (scRNASeq) provides a high throughput method for quantifying gene expression at single cell resolution. However, it remains unclear whether this approach is robust in dynamic clinical settings—including the extent to which new analytic tools required by the unique characteristics of scRNASeq are effective in such contexts. We report scRNASeq analysis of ~1,000 cells from each of 38 patients requiring veno-arterial extracorporeal life support (VA-ECLS)—a diverse group of critically ill patients experiencing circulatory collapse as a common endpoint to wide ranging diseases. Using existing tools including Alra for technical drop out imputation and Harmony for batch effect removal, we established an analysis pipeline capturing major biological signals from theses samples as confirmed by flow cytometry. We demonstrate that even in this very complicated clinical setting, scRNASeq can reveal novel aspects of disease biology that can be translated to and validated in subsequent patient cohorts.
One Sentence Summary Properly analyzed, fluidics based single cell RNASeq is a robust analytical tool even in complex clinical settings.
Microfluidics based single cell transcriptional profiling enables study of cell biology at higher resolution and throughput than previously possible (1, 2). This approach has led to studies deepening our understanding of development (3, 4), as well as animal models of disease (5). Initial efforts to apply this technology clinically have shown promise in the contexts of infectious disease (6) and tumor biology (7, 8). Moreover, transcriptomics has been shown to be a powerful tool in repurposing drugs (9, 10) and single cell transcriptomics may reveal novel therapeutic targets in this clinical context. The extent to which high throughput, microfluidics based single cell RNASeq (scRNASeq) can be applied to complex clinical questions—including patient survival—remains largely undefined, as does the optimal approach to such analysis.
As both sentinels and effectors of disease response, peripheral blood mononuclear cells (PBMCs) are an accessible and attractive target for clinical application of scRNASeq. However, PBMCs represent a hetergenous and dynamic cell population. Further complicating such analysis is the fact that the data produced by microfluidics scRNASeq represents a “sparse matrix” with only a fraction of known genes exhibiting detectable expression. This represents a combination of genes that are not expressed—biological dropouts—as well as genes that are expressed but failed to be detected—technical dropouts. As a result of this and other unique features of the data produced by high throughput scRNASeq, specialized tools have been developed (11–15). But it remains to be determined to what extent an analytical pipeline can be identified that can extract clinically useful information from single cell RNASeq analysis of circulating PBMCs in a dynamic clinical setting.
In an effort to address this question, we performed fluidics based scRNASeq analysis of PBMCs from critically ill patients being initiated on venous-arterial extracorporeal life support (VA-ECLS). Patients requiring VA-ECLS represent a heterogeneous population with a wide range of disease states including myocardial infarction, primary graft dysfunction, myocarditis, and acutely deteriorated heart failure (16). However, these patients exhibit a common pathophysiologic endpoint: circulatory collapse (17). For some patients, VA-ECLS support provides life support while failing organs recover and regain function, while in others it provides a life support bridge until definitive intervention—such as organ transplantation or implantation of mechanical assist devices—can be achieved. VA-ECLS continues to be associated with mortality rates of around 60% (18), due mainly to unrelenting progression of the underlying disease process, but also complication of VA-ECLS itself (19).
Results
Confounding impact of batch effects
We performed scRNASeq based transcriptional profiling of a total of 40,000 peripheral blood mononuclear cells from 38 patients at the time of initiation of VA-ECLS (mean time between sample acquisition and VA-ECLS, ±79 minutes) on the inDrop microfluidics encapsulation platform (1). The study design and approach to analysis are summarized in Figure 1, and the clinical characteristics of these patients are summarized in Table 1. Not surprisingly, non-surviving patients exhibited significantly more acidosis and poorer renal function at baseline than survivors, but no other clinical parameters were predictive. We were interested in identifying whether scRNASeq analysis could provide additional predictors of—and potentially mechanistic insights into—survival in these patients.

Overview of study design, including the work flow used for data processing.
Clinical features of patient cohort included in the study. Clinical characteristics of patients, stratified by 30 day survival. Factors with statistically significant differences between survivors and non-survivors are bolded. P-value is for two sided t-test where the distribution was near-normal, two sided Wilcoxon rank sum test otherwise.
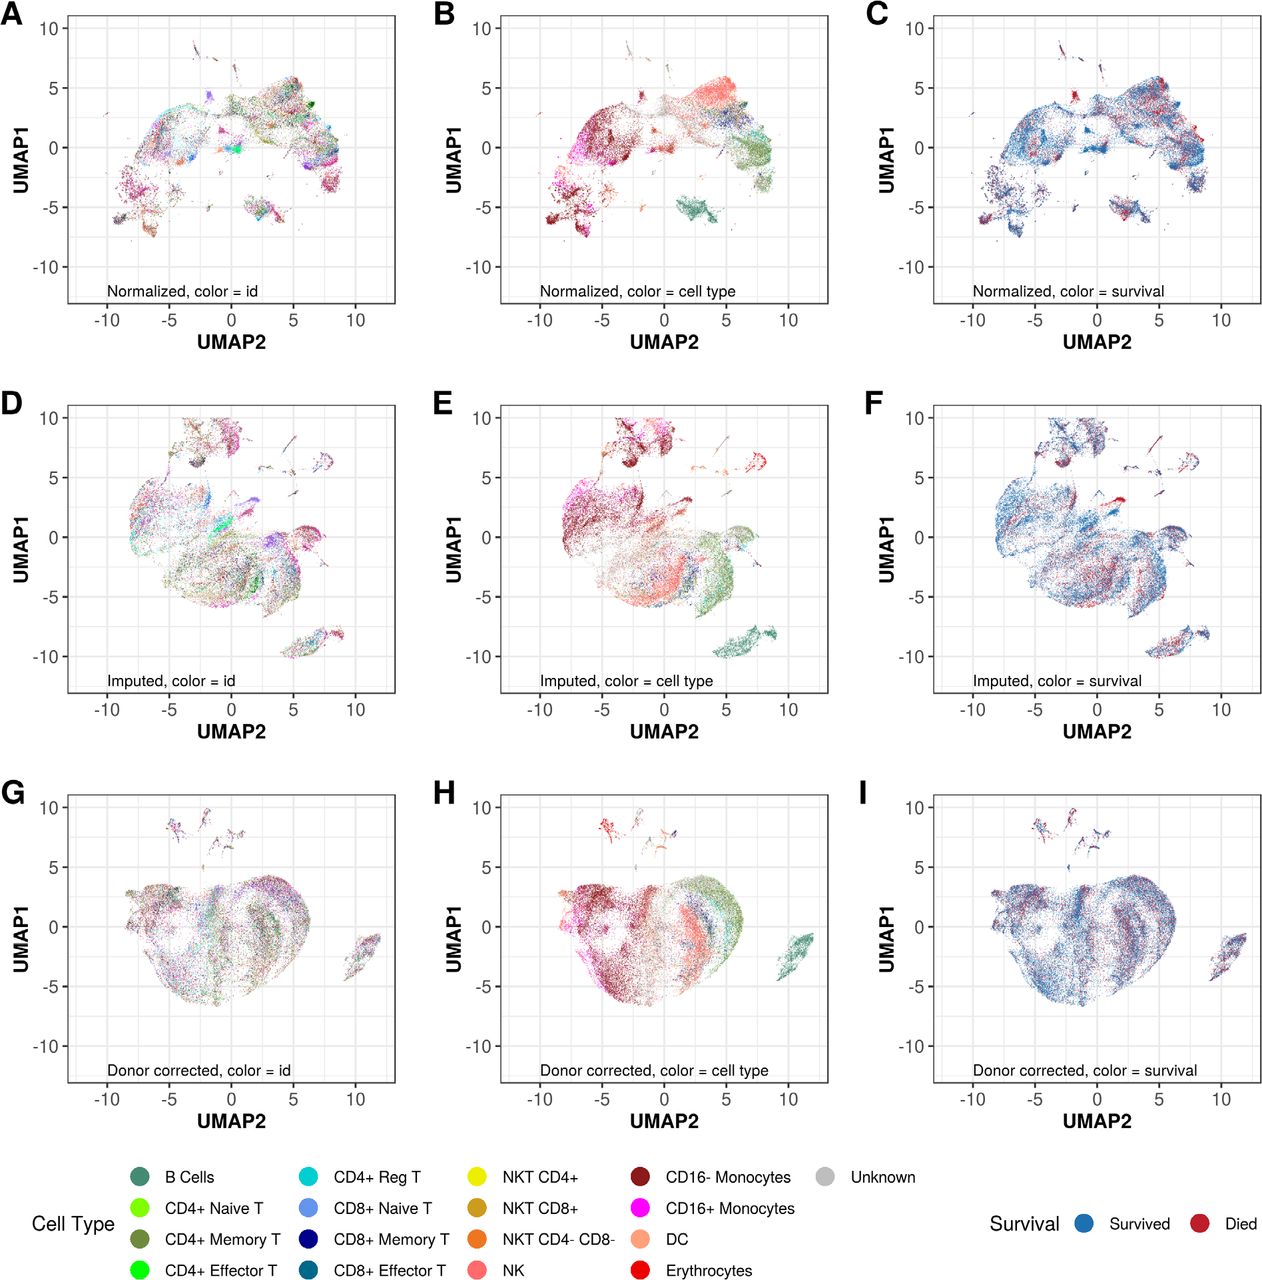
While unsupervised, genome-wide clustering of the expression data demonstrated a number of cell clusters comprised solely of cells from deceased patients, it was apparent that this was an artefact of batch effect as these clusters were each comprised of cells from a single patient (Fig 2A-C). It is well established that microfluidics based scRNASeq approaches are subject to technical dropouts—failure to detect transcripts that are present due to technical factors including low efficiency of RNA capture by the oligo-dT primers in the droplets (13). Imputation of technical dropouts via the ALRA algorithm (14) ameliorated the batch effects to some extent (Fig 2D-F). Explicit regression of the batch effects via the Harmony algorithm (15) homogenized the data with respect to donor/batch, while improving clustering by PBMC subtype (Fig 2G-I) as determined by expression of genes encoding canonical surface markers (supplemental Table S2).

Unsupervised clustering of the profiled cells in two dimensions by Uniform Manifold Approximation and Projection (UMAP). Cells are color coded by patient study identifier (A,D,G), cell type as assigned by expression of surface marker genes (B,E,H) or 72 hour mortality status (C,F,I). Systematic removal of artefactual clustering is demonstrated by imputation of technical dropouts by the ALRA algorithm (14) (D-F), followed by batch (donor) effect removal by Harmony (15) (G-I).
Unsupervised clustering based on genome wide gene expression after removal of batch effects and imputation of technical dropouts demonstrated that the cells tended to cluster by major PBMC subtypes (Fig 3A), based on expression of established markers of these cell populations (Fig 3B). This observation suggests that scRNASeq can capture the major themes of cellular biology even in this clinically complex and dynamic setting—provided appropriate steps are taken to account for technical dropouts and batch effects.

Cell subtypes and concordance with flow cytometric analysis. (A) After data processing, cells clustered predominantly by cell type as defined by expression of surface marker genes. In addition to major PBMC populations, a small number of contaminating erythrocytes can also be seen. (B) The expression of surface markers themselves show distinct patterns of expression, suggesting that the cells are clustering by biological class rather than other technical or clinical factors. (C) Proportions of cells in each major lymphocyte subgroup as defined by scRNASeq correlate well with results of flow cytometric analysis of these same samples.
Cell type assignment validation by flow cytometry
Previous work has indicated that the expression of genes encoding surface markers is highly correlated to protein levels of those surface markers (20). To verify that this was the case in this clinical context of patients under extreme physiological stress, we also analyzed these samples by conventional flow cytometry (FC). We compared the proportions of cells in the major lymphocyte subtypes as defined by the gene expression data vs. direct measurement of surface markers by FC. Cell assignments between the two methodologies correlated well (Fig 3C). Prior to imputation of technical dropouts, only 54% of cells could be unambiguously assigned to a specific PBMC subtype, compared to 81% after imputation. Notably, imputation had no significant effect on either the slope of the regression line or the R2 between the proportion of lymphocytes assigned to each subclass by either FACS or scRNASeq (in fact, both values increased slightly after imputation—supplemental Table S3). The fact that the correlation between lymphocyte subset proportions as defined by FACS and scRNASeq did not deteriorate following imputation suggests that the substantial increase in cell assignment achieved by imputation identified the true biological type of these cells as opposed to random noise.
Conventional cell types not predictive
After imputation of technical zeros and removal of batch effects, there were no obvious survival-related clusters of cells upon UMAP visualization of the data (figure 2I), suggesting that processes related to survival were not the dominant sources of gene expression variation between these heterogeneous cells. This prompted us to interrogate each PBMC subtype to look for survival signals within each subtype. First we sought to determine whether conventional PBMC classification could predict outcome. Using our gene expression-based cell type assignments, we looked for differences in proportions of these cell types in surviving vs. non-surviving patients. Although some trends were apparent, none of the observed differences were statistically significant after adjustment for multiple comparisons (Fig. 4A). This suggested we needed to look deeper into each major cell type to try to identify novel sub-populations that may relate to survival.

Identification of factors associated with survival (A) Proportions of all cells in each patient that were classified as each of the major PBMC subtypes, stratified by patent outcome at 72 hours. After adjustment for multiple comparisons, none of these conventional subtypes could significantly predict survival. (B) Expression patterns of highly variable genes (defined by normalized dispersion (2)) and cell surface markers. For each patient, the proportion of cells in each PBMC subtype that expressed each gene was calculated. The median proportion was then compared between survived vs. deceased patients by Wilcoxon rank sum test. Red bars indicate the genes that were expressed more frequently in cells of a given subtype from deceased patients. Blue bars indicate the genes that were expressed more frequently in cells for a given subtype in patients who survived. The intensity of the color corresponds to 1-FDR, such that the darkest colors indicate the most significant genes. Those clusters containing genes enriched for specific Gene Ontology Biological Process terms are annotated. Up to two significant terms are listed for each cluster. A complete list of enriched terms is provided in Supplemental Table S4. (C-E) 72 hour (C,D) or 30 day (E) survival based expression of surface markers. Patients were stratified using median expression level as the cutoff based on proportion of CD8+ NKT cells that were positive for CD52 (C) or CD3G (D,E).
Biological processes associated with survival
The batch-effect corrected data showed no survival related cell clusters. Harmony produces a batch effect corrected matrix of principle components. To identify genes associated with survival within subtypes, we identified the set of highly variable genes (Supplemental Data S2) within our dataset based on normalized dispersion (2) from the ALRA imputed data. For each patient, we then quantified the proportion of cells of each subtype that expressed each of these genes. For each gene, the proportions among surviving patients were compared to the proportions among non-surviving patients using the Wilcoxon rank sum test. This allowed us to identify genes within each PBMC subtype that were associated with survival (blue bars in Fig 4B) or non-survival (red bars in Fig 4B). We clustered the genes based on this measure of differential expression, and annotated the resulting gene clusters based on their enrichment (21) for Gene Ontology biological process terms (Fig 4B, left panel, and Supplemental Table 4). Within multiple PBMC subtypes, patients who died exhibited higher proportions of cells expressing genes associated with GO terms related to inflammation including antigen binding, cytokine activity, and heat shock protein binding. This suggests a wide spread increase in inflammatory response across cell types in these non-surviving patients.
However, other processes appeared to have more discreet patterns of activation within specific cell types. Genes associated with S100 protein and actin binding—perhaps related to the cytoskeletal rearrangement essential to antigen presentation and effector cell activation (22)—exhibited an inverse relationship between CD8+ naïve T cells compared to CD8+ natural killer T (NKT) cells. Non-surviving patients exhibited higher proportions of CD8+ naïve T cells expressing genes related to these biological processes at the time of initiation of VA-ECLS, while the inverse was true of CD8+ NKT cells.
Novel surface markers associated with survival
Future measurement and/or isolation of novel subpopulations of survival-related cells would be facilitated by identifying surface markers that identify these cells. Therefore, we next focused our differential gene analysis on surface markers (Fig 4B, left panel). After control for multiple comparisons, two surface markers stood out. Surviving patients had significantly higher proportions of CD8+ NKT cells (CD3+/CD8+/CD19−/CD56+) that were CD52+ or CD3G+ (p < 0.001, FDR < 0.05 for both markers). We stratified the patients based on their CD52 +/− proportions and CD3G+/− proportions (among all CD8+ NKT cells), using the median proportion as the cutoff in each case. This stratification identified patients with significantly different mortality risks on VA-ECLS during the first 72 hours of support (Fig 4C,D). We hypothesized that immune response at VA-ECLS initiation would be predictive of early survival, and this was confirmed by this analysis. After this initial period, however, we expected that other factors related to the underlying disease process would be more important than the initial inflammatory response. It was surprising, therefore, that CD3G expression levels were predictive not only of 72-hour survival, but also of 30-day survival (Fig. 4E) among these patients.
Validation of CD52+/CD8+ NKT Cells as predictors of outcome
The preceding analysis relied on FDR adjustment of p-values to control the family wise error rate of our identified survival markers. Based on this measure, there is less than a 5% chance that the predictive nature of CD52+/CD8+NKT cells was due to random noise in the data. Nevertheless, it remains possible that this observation represents a biological reality for these patients that cannot be generalized to other patients. To evaluate this possibility, we performed FC analysis of a second cohort of 20 patients that were not included in the original scRNASeq analysis (Fig. 5A,B). For each patient, we quantified the proportion of CD8+ NKT cells that were CD52+. Again using the median proportion as the cutoff, we found that a high proportion of CD52+ cells among CD8+ NKT cells was predictive of 48 hour survival (p=0.024, Fig 5C). By 72 hours, this association was no longer statistically significant (p=0.06, Fig 5D). We were interested to note that a single patient with a high proportion of CD8+NKT that were CD52+ died in the first 48 hours. When we examined this patient’s case further, we found that this was one of only two patients in the cohort who presented with an infectious etiology to their cardiac collapse, whereas the vast majority of these patients had experienced an acute cardiovascular event (myocardial infection, pulmonary embolism, or massive hemorrhage). Upon removal of patients with a known acute infectious process at presentation, the proportion of CD52+ cells among CD8+ NKT D52 was again a significant predictor of survival at 72 hours (Fig 5E).

Validation of CD52 as a survival marker. Flow cytometric analysis was performed on PBMCs from 20 additional VA-ECLS patients. (A,B) Representative scatter plots of the percentage of CD52+ CD8+ NKT cells from ECLS patients that died (A) and survived (B). The following gating was used for flow cytometry analysis; gates were drawn to exclude debris and select lymphocytes based on FSC vs. SSC, doublets were excluded based on a FSC-w vs. FSC-h plot, live cells were identified as Fixable Viability Stain 450 negative, a gate was drawn for CD3+ and CD19− (T cells), NKT cells were CD3+ CD56+, NKT cells were plotted based CD4+ and CD8+ NKT cell populations (left panels within both A and B) with CD8+ CD4− gated, and CD52+ cells were gated (right panels of A and B). (C-E) Kaplan-Meier plots of survival proportion (y-axis) vs. survival time in days (x-axis). (C) The proportion of CD8+ NKT cells that were CD52+ was predictive of 48 hours survival, using the median proportion as the cutoff between “low” and “high”. (D) This difference was no longer significant at 72 hours until (D) removal of the two patients with infectious etiologies for their cardiovascular collapse.
Discussion
In this study we present single cell RNASeq analysis of PBMCs from patients being put on VA-ECLS due to circulatory collapse in the context of acute illness. Single cell transcriptomics was developed over 25 years ago (23–25, reviewed in 26), but the technology made a quantum advance in terms of throughput in the last several years as a result of development of microfluidics based cell encapsulation systems (1, 2, 27). The ability to quantify the transcriptomes of thousands of individual cells holds the promise to reveal new information about heterogeneous disease states, enabling tuning personalized medicine efforts to target specific cell populations (28). Initial efforts in this direction with human material have focused on cancer (7, 29–31), although examples in other diseases are emerging (32, 33) including one example of identification of a PBMC repertoire associated with survival in acute infectious disease based on analysis of ~100 cells from 2 patients (6).
Thus, the extent to which scRNASeq is both feasible and informative in the dynamic setting of critical illness remains largely unknown. Our results provide evidence that not only can this technology detect biological signal in a heterogeneous and rapidly changing clinical context, but can do so in a way that reveals deeper understanding of physiologic events associated with—and potentially driving—clinical outcomes.
ECLS is a powerful stimulator of the immune response against a background of already tenuous perfusion and end organ function (19). Whether this immune response is adaptive or mal-adaptive remains unclear. On the one hand, immunoparalysis was associated with worse outcomes (though not in a statistically significant fashion) in one small series (34). Furthermore, the 2006 ARDS Network Trial (35) found worse outcomes when steroids were started late in the disease course, and no change in outcomes when they were started earlier (despite short term improvements in physiologic measures of ventilation and perfusion). On the other hand, the use of steroids has been associated with survival in elderly patients in one registry based review (36) as well as dramatic clinical improvement on ECLS in a number of case reports (37–40). It is important to note that all of this evidence comes from the setting of acute respiratory failure. There little or no data to inform us about the role of inflammation with respect to survival among patients undergoing VA-ECLS for acute decompensated heart failure.
Our analysis identified activation of immune response across cell types among non-surviving patients. However, we also observed cell type specific effects including activation of S100 protein and actin binding signatures in CD8+ naïve T cells. Although the CD8+ naïve T cells constituted a small cell population, these cells can proliferate rapidly when they encounter their target antigens. The extensive synthetic surfaces of the VA-ECLS circuit can induce significant inflammatory responses (19). The presence of CD8+ naïve T cells with activating gene signatures among non-surviving patients—as identified here—may be indicative of an immune system poised to have a maladaptive inflammatory response to VA-ECLS.
In contrast, we also found that higher proportions of CD8+ NKT cells that were either CD3G+ and CD25+ was associated with improved survival. CD52+ cells have been implicated in autoimmune disease, and this surface marker is the target of a therapeutic agent used to treat both some leukemias and multiple sclerosis (41, 42). However, there is evidence suggesting that a there is a subset of CD8+ cells that are protective against autoimmune disease (43), and that these protective cells may be CD52+ (44). Similarly, CD3G has been demonstrated to play an essential role in restraining auto-immune reactivity (45). Thus, the CD52+ and/or CD3G+ NKT cells we identified here may be indicative of an immune system poised for a more permissive response to the inflammatory stimulation of VA-ECLS.
Insofar as these cells promote a permissive (rather than reactive) immune state, this observation is consistent with the hypothesis that attenuating the immune response to VA-ECLS may be beneficial in heart failure patients. However, our current study does not allow us to determine whether this association is cause or effect. Notably, non-surviving patients in our study were also more ill at initiation of VA-ECLS as manifest by more pronounced acidosis and poorer renal function. Whether this signifies a maladaptive immune response that can be treated or an irrevocably dysregulated physiology resistant to any therapy whatsoever remains to be determined.
Fluidics based scRNASeq enables transcriptomic characterization of individual patient cells at high throughput. The resulting data presents specific challenges and pitfalls. However, we have demonstrated that these factors can be overcome through appropriate analysis techniques and that this technology allows detection of biologically meaningful signals in these cells even in a dynamic and complex clinical setting. We anticipate that future applications of this approach will continue to reveal new information about the roles of both known and novel cells populations in human disease, and this information will continue to establish new biomarkers and therapies to the benefit of our patients.
Materials and Methods
Patient materials
This study was approved by our institution’s Institutional Review Board, and all patients gave informed consent to participate. All samples and data were anonymized prior to the analysis described here.
Approximately 10ml of whole blood from ECLS patients at time of boarding (mean difference from pump start time: + 79 minutes) were collected in EDTA Vacutainers. Peripheral blood mononuclear cells (PBMC) were isolated by density centrifugation using Ficoll-Paque PLUS (GE Healthcare) and cryopreserved in CryoStor (Sigma-Aldrich) at approximately 4×10⁶ cells per vial.
Flow cytometry
Cryopreserved PBMCs were rapidly thawed at 37 °C, washed in RPMI (10% FBS, 2mM L-glutamine, 1:10000 Benzonase), and rested overnight in 200μl of RPMI (10% FBS, 2mM L-glutamine) in a 96 well plate at a concentration of 1.0×10⁶ cells per well. Prior to surface staining non-viable cells were labelled with Fixable Viability Stain 450 (FVS450) and Fc receptors were blocked. A multiparameter flow cytometry panel was designed for detection of surface antigens. The panel consisted of directly conjugated anti-human antibodies; CD3-BB515, CD4-BUV395, CD8-APC-H7, CD19-APC, CD56-APC-R700, and CD16-BV510. For cell surface markers, cells were stained in PBS supplemented with 2% FBS and 2mM EDTA for 35 minutes at 4 °C. Stained cells were analyzed on a BD Influx flow cytometer equipped with 488nm, 355nm, 561nm, 405nm, and 640nm lasers, using a 100μM nozzle, at 20 psi, and an offset of 1.0. All flow experiments included single-stained controls, fluorescence minus one controls, and well-characterized healthy control. Acquisition of flow cytometry data was performed using Sortware v1.2 and analyzed with FlowJo v10.0.8.
Single cell encapsulation and reverse transcription
At the time of cell encapsulation for single cell RNASeq, cryopreserved PBMCs were rapidly thawed at 37 °C, washed in twice in RPMI (10% FBS, 2mM L-glutamine, 1:10000 Benzonase) and 2×10⁵ cells were resuspended in 1× PBS. To exclude non-viable cells from sorting, 3 nM of SYTOX Green (Thermo Fisher Scientific) was added to each sample tube. Cells were sorted on a BD Influx flow cytometer using a 100μM nozzle, at 20 psi, and an offset of 1.0. The following gating hierarchy was used: PBMCs were separated from debris based on distribution of light scatter by SSC/FSC; cell doublets were excluded by signal pulse characteristics of FSC-W/FSC-H and SSC-H/SSC-A. Viable cells with intact cell membranes were gated as SYTOX Green negative. For each patient sample 20,000 events were sorted (51.2ul) directly in 112.8μl of 1xPBS. Prior to InDrop 36ul of optiprep was added to each tube.
Thawed, sorted and diluted cells were encapsulated along with barcoded beads and reverse transcription reagents using the inDrop platform (1CellBio, Watertown, MA). Flow rates were adjusted periodically throughout the experiment, with the help of high speed video microscopy, to ensure that the number of droplets containing one bead was maximized while minimizing droplets with two or more beads. Run times were calculated to capture 1500 cells per sample. Each sample was run on a separate, freshly silanized microfluidics device. Reverse transcription was performed following the manufacturer’s protocol. Briefly, barcoding oligo were cleaved by exposing each droplet emulsion aliquot to UV light for 10 minutes. The emulsions were then incubated at 50°C for one hour, and then 70°C for 15 minutes. The emulsion was then broken, and the aqueous phase containing the cDNA removed. The cDNA was cleaned up MinElute columns (Qiagen, Hilden, Germany) and excess barcodes enzymatically removed. Second strand synthesis was performed using the NEBNext Ultra II second strand synthesis kit (NEB, Ipswich, MA) according to the manufacturer’s protocol. The samples were then again cleaned up on MinElute columns, and sample integrity confirmed by Bioanalyzer (Agilent, Santa Clara, CA). In vitro transcription was then performed using the NEB HiScribe High Yield RNA synthesis kit according to the manufacturer’s instructions. Sample integrity was again verified by Bioanalyzer. The IVT products were then reverse transcribed using random hexamers. Amplifciation cycles were optimized by diagnostic qPCR, and then the samples were amplified using unique PE1/PE2 indexing primers such that samples could be pooled prior to sequencing. Amplified cDNA was then cleaned up using AMPure beads (Beckman Coulter, Indianapolis, IN). Library integrity and fragment size was confirmed by BioAnalyzer prior to sequencing.
Sequencing
Prepared libraries were normalized and pooled, and sequenced on a NovaSeq 6000 sequencer (Illumina, San Diego, CA) using the S2 100 cycle kit. Read one was 36 cycles, the index read was 6 cycles, and Read 2 was 50 cycles. Cells were sequenced to an approximate detah of 90,000 reads per cell. Resulting sequencing data was converted to demultiplexed FASTQ files prior to downstream analysis.
Data processing
The sequencing data was aligned to the human genome (assembly GRCh38) and unique feature counts obtained using the software pipeline developed by the inDrop manufacturer (https://github.com/indrops/indrops). The raw count data was then filtered, normalized, imputed, and batch corrected using tools for the R statistical analysis platform. Full details of the data processing and analysis are presented in Supplemental datafile S1, and is also available as an R markdown document at https://github.com/vanandelinstitute/va_ecls
Statistical analysis
For differential gene expression analysis, the expression matrix was filtered to include only variably expressed genes as described (46). Briefly, for each gene, the mean was calculated across all cells. The dispersion of (variance / mean) was also calculated for each gene across all cells. The genes were then split into 20 bins based on mean expression. Within each bin, dispersions were converted to robust z-scores (the absolute difference between each dispersion and the median dispersion for that bin, divided by the median absolute deviation for that bin). Genes with a dispersion z-score > 2.0 were retained for further analysis.
Given that the single cell RNASeq expression data was a sparse matrix, we compared patients in terms of proportions of cells expressing genes of interest. For any given gene, the proportion of cells (of a given subtype of interest) was calculated. Surviving patient and non-suviving patients were then compared in terms of median proportion, and difference between patient groups was tested by mean of Wilcoxon rank sum analysis of the proportions in each group. Given the large number of genes under analysis, all p-values were adjusted using the false discovery rate method (47).
When comparing proportions of cells in each of the major subtypes between outcome groups (figure 4A), the same approach was used, but since the number of comparisons was relatively small and we wanted to avoid any type I errors (as opposed to simply constraining the family wise error rate), p-values were adjusted using the method of Holmes.
Survival analysis was performed by plotting Kaplan Meijer curves and comparing the curves using the log-rank test. Given that only 3 survival curves were analyzed, no p-value adjustment was performed (although the results would have remained significant even under the most stringent adjustment including Bonferroni correction).
Data availability
The single cell RNASeq expression data (as a matrix of raw counts) and supporting metadata is available from GEO (GSE127221).
Code availability
Code used to perform the analysis and generate the figures, with accompanying documentation and explanation including system requirements and dependencies, is available from Github at http://github.com/vanandelinstitute/va_ecls.
List of Supplementary Materials (included at end of this document)
Table S1. Classification scheme for PBMC subsets based on scRNASeq expression
Table S2. Impact of imputation on slope and R2 of correlation between FACS and scRNASeq
Table S3. Significantly enriched GO terms
Table S4. List of surface markers analyzed.
Figure S1: Representative scatter plots depicting the gating strategy used for FACS analysis
List of Supplementary Materials (separate files)
Data S1 (final_analysis.html). Detailed description of the data analysis including annotated code to reproduce figures 2–4 from the manuscript is provided in the file “final_analysis.html”. Reproducing the analysis can be facilitated by downloading the github repository https://github.com/vanandelinstitute/va_ecls.
Data S2 (variable_gene_list.xls). The list of highly variable genes as defined by normalized dispersion used for the analysis shown in Figure 4B is provided in the file “variable_gene_list.xls”
Funding
This work was made possible by the generosity of the Helen and Richard DeVos foundation.
Author contributions
EJK and SJ conceptualized and conceived the project. EJK also performed the analysis, developed methodology, and wrote the manuscript. MW performed the flow cytometry work described in this work, analyzed data, and reviewed and edited the manuscript. HM, and EE performed the single cell encapsulation, and reviewed and edited the manuscript. CK assisted with patient enrollment and data collection. EG, ML, SF, TB, GM, TT, MD, and PW provided clinical resources and supervision for the project and reviewed the manuscript. NMS performed analysis of clinical data. SJ also acquired funding, developed methodology, supervised the project, and wrote the manuscript.
Competing interests
The authors declare no competing interests.
Acknowledgments
We would like to acknowledge Jennifer Schuitema for overseeing recruitment, consent, and collection of blood samples, the ECMO nursing staff for collecting blood samples and processing plasma after-hours, and David Chesla and Donald Daley from the Spectrum Health Biorepository for sample processing during after-hours. The authors thank the Van Andel Genomics Core for providing sequencing facilities and services.
References


