

Abstract
Membraneless pericentromeric heterochromatin (PCH) domains play vital roles in chromosome dynamics and genome stability. However, our current understanding of 3D genome organization does not include PCH domains because of technical challenges associated with repetitive sequences enriched in PCH genomic regions. We investigated the 3D architecture of Drosophila melanogaster PCH domains and their spatial associations with euchromatic genome by developing a novel analysis method that incorporates genome-wide Hi-C reads originating from PCH DNA. Combined with cytogenetic analysis, we reveal a hierarchical organization of the PCH domains into distinct “territories,” in which “intra-arm” interactions are the most prevalent, followed by 3D contacts between specific PCH regions on different chromosomes. Strikingly, H3K9me2/3-enriched regions embedded in euchromatic genome show prevalent 3D interactions with the PCH domain. These spatial contacts require H3K9me2/3 enrichment, are likely mediated by liquid-liquid phase separation, and influence organismal fitness. Our findings have important implications for how PCH architecture influences the function and evolution of both repetitive heterochromatin and the gene-rich euchromatin.
Main Text
Nuclear architecture and dynamics regulate many important genome functions (reviewed in (1–4)). The development of Hi-C, which combines chromosome conformation capture (3C) (5) with genome-wide sequencing (6), has led to major breakthroughs in our understanding of global nuclear architecture (reviewed in (7)). However, analyses of Hi-C results have focused on single copy sequences in euchromatic regions (e.g. (6, 8–10), and virtually all have excluded the large Peri-Centromeric Heterochromatin (PCH) portion of genomes due to its enrichment for large blocks of repetitive DNAs (11, 12). Despite being gene-poor, the PCH plays vital roles in chromosome dynamics (13, 14) and genome integrity (15–17).
A defining characteristic of heterochromatin is its enrichment for ‘repressive’ epigenetic features, such as Histone H3 lysine 9 di- and trimethylation (H3K9me2/3) and its reader protein, Heterochromatin Protein 1a (HP1a) (18, 19). Interestingly, PCH DNA/chromatin from different chromosomes coalesce into one or a few membraneless PCH ‘domains’ (or chromocenters) in the 3D cell nucleus (20, 21). Recent studies have shown that specific biophysical properties of HP1a and liquid-liquid phase separation (LLPS) may mediate PCH domains formation (22, 23). This widely observed spatial organization of PCH domains could significantly influence transcription and other genome functions (24), such as silencing of euchromatic genes transposed near or in PCH genomic regions (25–27).
In addition to PCH and peritelomeric heterochromatin, regions of H3K9me2/3 enrichment are also present in euchromatic genome (28–30). Previous studies of a large block (∼1 Mb) of Drosophila heterochromatin inserted in subtelomeric euchromatin (BwD) (31, 32), revealed that large, repetitive, H3K9me2/3 and HP1a-enriched regions in euchromatic genome can spatially interact with the main PCH domain despite their separation by a large linear distance along the chromosome. However, it remains unknown whether the more prevalent, smaller (tens of Kbs), and naturally occurring H3K9me2/3 enriched regions in euchromatic genome, such as those associated with epigenetically silenced transposable elements (TEs) (33, 34), also contact the larger PCH domain.
We currently lack a global and in-depth understanding of the 3D organization of PCH domains, their interactions with euchromatic regions of the genome, and the associated functional importance. To address these questions, we overcame technical limitations inherent to analyzing repeated DNA sequences and developed a novel Hi-C analysis method that includes repetitive DNAs highly represented in PCH regions (Figure 1A and S1). The Release 6 D. melanogaster genome is the most complete genome among all multicellular eukaryotes, and includes a nearly full assembly of the non-satellite PCH DNA (35, 36). The boundaries between PCH and euchromatic genome have also been epigenetically identified (30). The annotated assembly allowed us to include three types Hi-C reads that originate from PCH DNA (Figure 1A): 1) unique single-copy sequences within PCH (e.g. protein coding genes, “unique”), 2) simple repeats known to be enriched in PCH (“repeat”, Table S1), and 3) sequences that map to multiple sites in the PCH (i.e. non single-locus mapping, “multi”). We used these sequence classifications to assess contact frequencies between PCH regions, and between PCH and H3K9me2/3-enriched regions in euchromatic genome (Figure 1B and below), using published Hi-C data from 16-18hr D. melanogaster embryos (37).

(A) Three types of PCH-derived sequences were included in the Hi-C analysis: 1) reads mapped to single-copy sequence in the epigenetically defined PCH regions (“unique” reads, 2.4% of filtered Hi-C reads (see Figure S1)), 2) reads mapped to known heterochromatic simple repeats (“repeat” reads, 6.44%), or 3) reads mapped to non-unique sequences (dark blue) that are present within epigenetically defined PCH regions (“multi” reads, 3.0%). (B) Methods for assessing if a euchromatic H3K9me2-enriched region displays exceptional 3D contacts with PCH. The observed percentage of euchromatin-PCH read pairs for an H3K9me2 enriched euchromatic region is compared to a null distribution generated using randomly selected, non-H3K9me2 enriched euchromatic regions to estimate p-value.
Analyses of the formation and function of 3D PCH domains generally assume they are homogeneous, despite the fact that they contain coalesced PCH regions from different chromosomes that have high sequence heterogeneity. To investigate potential substructures within the PCH domains, we focused on Hi-C read pairs in which both ends mapped uniquely to PCH genomic regions (“unique” PCH reads, Figure 1A). In addition to PCH regions on the 2nd, 3rd, and X chromosomes, the entire 4th and Y chromosomes were included in the analysis because the entirety of these two chromosomes are enriched with heterochromatic marks (30, 38). We estimated the number of Hi-C read pairs coming from any two of the 100kb PCH regions. Using a sequential exclusion approach (see Materials and Methods), we identified three types of prevalent spatial interactions among PCH regions: within an arm (intra-arm), between arms of the same chromosome (inter-arm), and between arms of different chromosomes (inter-chromosome). The most frequent interactions were among PCH windows on the same chromosomal arm, which accounts for 98.08% (replicate 1, Figure 2A) and 97.15% (replicate 2, Figure S2) of parsed Hi-C read pairs (also see Figure S3 and Table S2 for the number of read pairs supporting each interaction). This observation suggests PCH regions from each arm (e.g. 2L PCH) are organized into distinct “territories”, similar to identified chromosome territories for the euchromatic genomes (6, 8, 39–41). Exclusion of intra-arm interactions revealed strong spatial interactions between PCH regions flanking the centromeres (inter-arm, i.e. 2L-2R, 3L-3R), which accounted for 34.72% and 35.88% (replicate 1 and 2) of the remaining read pairs (0.67% and 1.02% of total unique PCH-PCH read pairs respectively), and specific inter-chromosome interactions, mainly 3L −4 (9.68% and 9.49% of non-intra-arm read pairs). To quantitatively investigate whether these interactions are exceptional, we compared the observed percentage of read pairs against expectations that are based on either theoretical mappability (42) or empirically observed number of reads mapped to PCH on each chromosome arm (see Materials and Methods, Figure 2B) We also performed permutation tests for the latter to evaluate the statistical significance. Contact frequencies between 2L-2R, 3L-3R, and 3L-4 are indeed significantly more than expected (compared to both expectations, permutation p-value < 0.0001). Finally, we excluded all intra-chromosome interactions to specifically study contact frequencies between PCH regions on different chromosomes (Figure 2B). The relative frequencies of most inter-chromosome associations did not exceed expectations (e.g. 2L-3L), suggesting random contacts across cell populations. However, frequencies of 3D contacts between 3rd chromosome PCH and the 4th chromosome (3L-4, 3R-4) were exceptionally high (compared to both expectations, permutation p-value < 0.0001). Contact frequencies between 2L-4, 2R-4, and 3R-Y were also significantly more than expected.

(A) Heatmap for the number of Hi-C read pairs supporting the spatial interactions between pairs of 100kb PCH windows (total 189 windows). Replicate 1 is shown (see Figure S2 for replicate 2). Centromeres are denoted by arrowheads. (B) Barplots for the observed and expected proportion of read pairs supporting spatial interactions between PCH on different chromosomes, excluding intra-arm (above) and inter-arm (below) interactions. Interactions that are more than expected and have significant permutation p-values (all p < 0.0001) are denoted with arrows. (C) Example showing how distance between foci was estimated (top) and representative images of embryonic cells stained with DAPI (DNA, blue) and FISH probes recognizing indicated PCH regions (3R-4, 2R-3R, and 2R-4, pink and yellow) (bottom). (D,E) Boxplot (D) and histogram (E) showing the relative distance between PCH foci. Orange box/bars are for exceptional PCH interactions (3R-4) while gray ones are for other interactions. In (D), numbers of nuclei counted are in parentheses. In (E), threshold for nuclei with overlapping foci is denoted with arrow, and the percentages denote nuclei with overlapping foci. FISH analysis based on absolute distance led to the same conclusions (Figure S4). ** p < 0.01, *** p < 0.001.
The spatial interactions detected with Hi-C represent a superimposition of different chromosome conformations within cell populations. To investigate the prevalence and cell-to-cell variability of identified 3D interactions, we performed single-cell fluorescence in situ hybridization (FISH) on embryos of the same genotype and stage as those used for Hi-C. In D. melanogaster, different simple repeats are specifically enriched in the PCH regions of certain chromosomes (43). This allowed us to ask if chromosome-specific probes that label simple repeats from PCH regions that displayed exceptional Hi-C spatial interactions (e.g. 3R-4) colocalized more often than probes from the same chromosomes with lower frequency interactions (2R-3R and 2R-4). We measured the “relative distance,” defined as the distance between FISH signal centroids divided by the nuclear radius (Figure 2C), to account for variable cell size at late embryonic stages. The relative distance between 3R (dodeca)-4th chromosome (AATAT) is significantly shorter than 2R (AACAC)-3R or 2R-4 (Mann-Whitney test, p = 0.0001 (3R-4 vs 2R-3R) and <10-6 (3R-4 vs 2R-4), Figure 2D). For all three pairs of interactions, the distribution of relative distance is bimodal (Figure 2E), with a sharp peak near zero. We defined two foci as ‘overlapping’ when their distances were shorter than this natural threshold (denoted by arrow in Figure 2E). Consistent with the Hi-C results, the proportion of nuclei with overlapping foci was higher for 3R-4 than for 2R-3R or 2R-4 (Fisher’s Exact test, p = 0.22 and 0.0006 respectively, Figure 2E). Importantly, the distribution of the relative distances between foci reveals that these spatial interactions are dynamic and vary between individual cells, as previously shown for euchromatic Hox locus in mouse (44). Overall, both Hi-C and FISH analyses demonstrate a hierarchical 3D organization of PCH domains. Each PCH arm composes a distinct territory. While PCH regions from different chromosomes interact, a natural consequence of their coalescence into common 3D domains, some specific interactions happen more often than random, in particular the inter-arm (2L-2R, 3L-3R) and inter-chromosomal (3L/3R-4) 3D associations.
The coalescence of PCH regions and large blocks of translocated heterochromatin in the euchromatic genome (e.g. BwD, (31, 32)), as well as the observations of the formation of HP1a liquid droplets both in vitro and in vivo (22, 23), led us to predict that small euchromatic regions enriched for H3K9me2/3 and HP1a could also spatially associate with the main PCH domains. To test this hypothesis, we identified euchromatin-PCH Hi-C read pairs, which contain sequences from single-copy, euchromatic genome paired with any PCH sequence (i.e. all three categories of PCH sequences, Figure 1A). We then estimated, among Hi-C read pairs whose one end mapped uniquely to a specific euchromatic region, the percentage of euchromatin-PCH read pairs (Figure 1B). We generated null distributions for the percentage of euchromatin-PCH Hi-C read pairs using random euchromatic, non-H3K9me2/3 enriched regions to calculate empirical p-values (Figure 1B). Euchromatic regions with exceptional percentage of euchromatin-PCH Hi-C read pairs (empirical p-values < 0.05) were considered to interact spatially with PCH (see Materials and Methods).
We identified by ChIP-seq 496 H3K9me2-enriched regions (290bp - 21.63Kb, with an average size of 3.84 kb) in euchromatic genome (>0.5 Mb distal from the epigenetically defined euchromatin-PCH boundaries) in embryos of the same genotype and stage as the Hi-C data (see Materials and Methods). Of these H3K9me2-enriched regions, 13.91% (n = 69) and 8.67% (n = 43) displayed significant spatial associations with PCH in either or both Hi-C replicates, respectively (Figure 3A). These numbers are significantly higher than expected (i.e. 5% of the H3K9me2-enriched regions would be significant under null expectation; binomial test, p = 0.00059 (both) and 3.04×10⁻¹⁴ (either)). Thus, we conclude that euchromatic H3K9me2-enriched regions are more likely to spatially interact with PCH than euchromatic regions without H3K9me2 enrichment. For subsequent analyses, we focused on euchromatic H3K9me2-enriched regions that significantly interacted with PCH in both Hi-C replicates (hereafter referred to as “EU-PCH” associations).

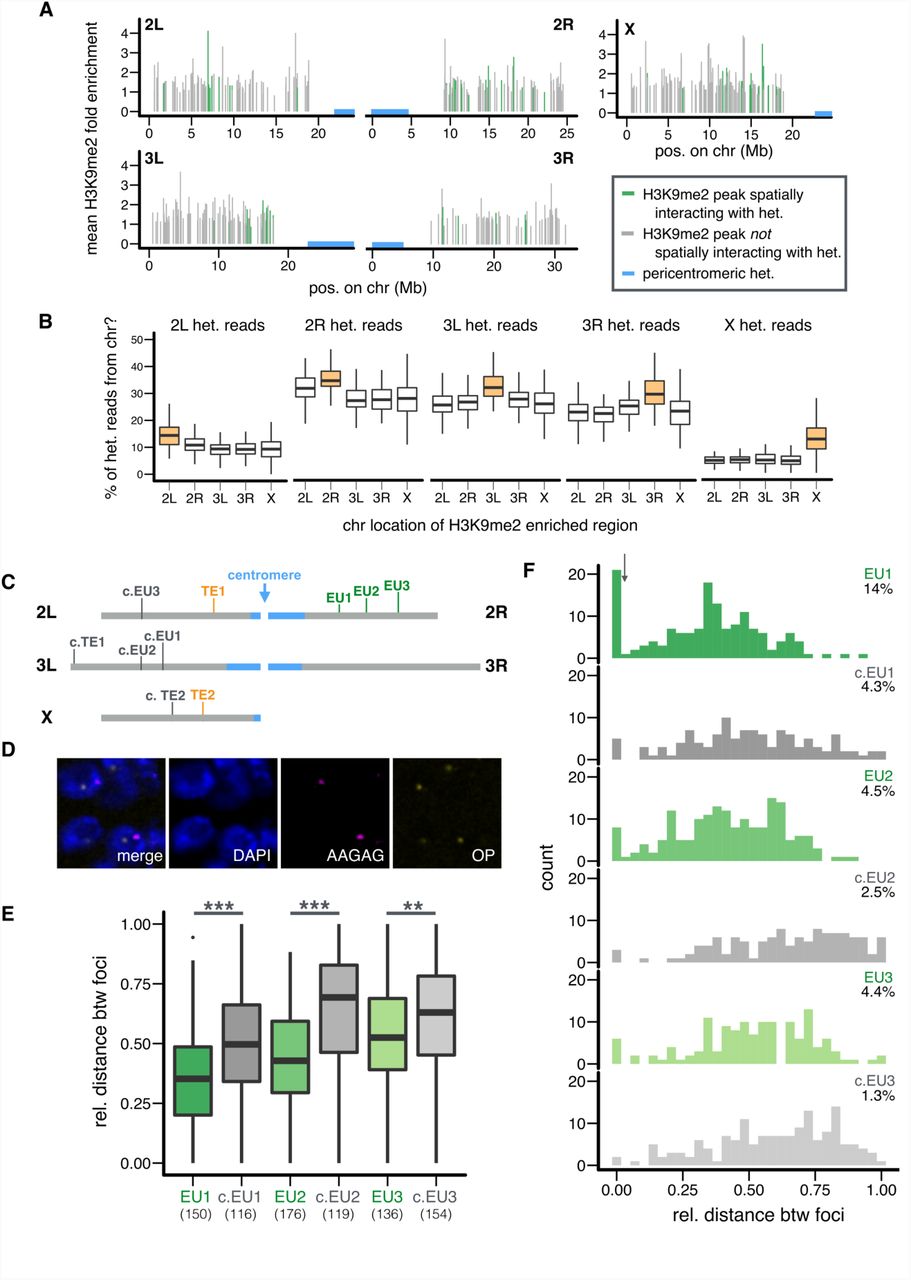
(A) Genomic distribution and average H3K9me2 enrichment level of euchromatic H3K9me2-enriched regions with (green) or without (gray) 3D interactions with PCH (blue). (B) The percentage of Hi-C reads coming from PCH regions on a particular chromosome (y-axis) is compared between euchromatic H3K9me2-enriched regions on the same (orange) or other (white) chromosomes. Replicate 1 is shown and see Figure S6 for replicate 2. (C) Locations of euchromatic H3K9me2-enriched regions and TEs chosen for FISH analysis. Euchromatin (gray), PCH (blue). (D) Representative image of nuclei stained with DAPI (DNA, blue) and FISH probes for EU1 (OP=Oligopaint probe, yellow) and PCH (AAGAG, pink). Also see Figure S8. (E,F) Boxplot (E) and histogram (F) showing the relative 3D distance between PCH and indicated euchromatic regions (with PCH interaction = green, without = gray). In (E), numbers of nuclei counted are in parentheses. In (F), threshold for nuclei with overlapping foci is denoted with arrow, and the percentages denote nuclei with overlapping foci. FISH analysis based on absolute distance led to the same conclusions (Figure S9). ** p < 0.01, *** p < 0.001.
We found that euchromatic H3K9me2-enriched regions with PCH interactions have shorter linear distance to PCH regions along the chromosome compared to H3K9me2 regions that lacked PCH interactions (Mann-Whitney U test, p < 10-4, Figure S5), suggesting that proximity to PCH on a linear chromosome is a strong defining feature for the tendency to spatially interact with PCH. For each H3K9me2-enriched region, we calculated the percentage of unique PCH reads from each chromosome arm (e.g. percentage of EU-2L PCH read pairs). For PCH region on a particular arm, H3K9me2-enriched regions on the very same arm always have the highest such percentage (e.g. 2L euchromatic regions have the highest percentage of EU-2L PCH read pairs), followed by those on the other arm of the same chromosome (Figure 3B and Figure S6). This echoes the observed strong tendency of “intra-arm” PCH-PCH interactions, followed by “inter-arm” PCH-PCH interactions (Figure 2A and 2B).
Interestingly, euchromatic H3K9me2-enriched regions that show spatial interactions with PCH have higher fractions of coding sequences when compared to H3K9me2-enriched regions without PCH interactions (Mann-Whitney U test, p = 0.0015, median: 70.1% (with) and 30.4% (without)). In addition, these regions are more likely located within active Topologically Associated Domains (TADs) identified at the same embryonic stage (8) than H3K9me2-enriched regions without PCH interactions (Fisher’s Exact Test, p = 0.0078, Table S3). Using previously reported segmentations of the D. melanogaster genome into combinatorial chromatin states (45, 46), we also found that significant EU-PCH contacts are more likely to involve euchromatic regions in active states: Red or Yellow chromatin (Fisher’s Exact test, p = 0.021), or modEncode State 1-4 (p < 10-4 (S2) and =0.011 (BG3), Table S3). These regions are also depleted for chromatin states that lack obvious enrichment for histone modifications and/or protein binding: “null” TADS (Fisher’s Exact test, p = 0.03), black chromatin (p < 10-3), and modEncode State 9 (p = 0.008 (S2), Table S3). It is currently unclear why PCH associations would be enhanced for H3K9me2 regions containing coding genes or active chromatin marks. It is worth noting that PCH associations were not correlated with the following properties of euchromatic H3K9me2-enriched regions: autosome or sex chromosome linkage (Fisher’s Exact test, p = 0.27), size of the enriched region (Mann-Whitney U test, p = 0.31), or the average level of H3K9me2 enrichment (Mann-Whitney U test, p = 0.91). Analysis of significant EU-PCH interactions in either replicate reached the same conclusions (Table S4).
To validate the EU-PCH 3D interactions identified by Hi-C analysis, we performed FISH using Oligopaint probes (47–49) targeting 30.5-42.9kb euchromatic regions (Table S5) and probes that broadly mark PCH (AAGAG, a satellite enriched in PCH regions of all chromosomes, (50, 51)). We focused on three 2R windows covering euchromatic H3K9me2-enriched regions that spatially interact with PCH (EU1-3) and, for each of them, a matching “control” window without H3K9me2enrichment at a similar linear distance from PCH genomic regions (c.EU1-3, see Figure 3C for genomic locations of chosen regions, Figure S7 for their H3K9me2 enrichment level, and Figure 3D and Figure S8 for representative cell images). Consistently, we observed that H3K9me2-enriched regions displaying PCH interactions in the Hi-C analysis are closer to PCH in 3D space than linearly equidistant regions that lack H3K9me2 enrichment (Mann-Whitney U test, p < 10-6 (EU1 vs c.EU1), < 10-13 (EU2 vs c.EU2), and 0.0025 (EU3 vs c.EU3), Figure 3E). This is also reflected in the proportion of cells in which the two foci overlap, though the comparison is only statistically significant for one of them (Figure 3F, Fisher’s Exact test, p = 0.007 (EU1 vs c.EU1), 0.37 (EU2 vs c.EU2), and 0.15 (EU3 vs c.EU3)). Together, the Hi-C and FISH analyses reveal that even short stretches of H3K9me2-enrichment in euchromatic genome can coalescence with the main PCH domains.
In addition, naturally occurring TE insertions in the euchromatic genome can acquire H3K9me2/3 marks that often extend into flanking regions, including genes (33, 34, 52, 53), and we predict that these could also spatially contact the main PCH domains. While non-TE induced H3K9me2/3 enriched regions in euchromatic genome are commonly shared between individuals (e.g. Figure S7), most TE insertions are polymorphic (i.e. not present in all individuals) in the Drosophila population (54–56), leading to varying H3K9me2 enrichment between individuals and strains (e.g. Figure S10, (34)). Accordingly, we compared the H3K9me2 enrichment level around TE insertions in the strain used for Hi-C (ORw1118) with that of homologous sequences in strains without the respective TEs (wildtype) to identify TE-induced H3K9me2-enriched euchromatic regions, as performed previously (34). This approach identifies H3K9me2 enrichments that are broad and/or low in enrichment level, and therefore often missed by custom pipelines that rely on identifying “sharp peaks” (reviewed in (57, 58)). Our analyses were restricted to 106 TEs that displayed H3K9me2 spreading into at least 1kb of flanking DNA (65% of identified TEs in strain ORw1118, see Materials and Methods), with an average of 4kb and maximum of 18kb of H3K9me2 spread. Among these TEs, 13.21% (n = 14) and 7.55% (n = 8) displayed significant spatial interactions with PCH (p < 0.05) in either or both Hi-C replicates respectively (Figure S11), which is significantly more than expected (binomial test, p = 8.38×10⁻⁴ (either) and 0.26 (both)). As a contrast, only 1.75% of TEs without H3K9me2 enrichment (n = 1) display PCH interactions. We focused on analyzing the 14 TEs showing significant PCH-contact in either replicate, while analyses restricted to eight TEs significant for both replicates was qualitatively similar (Table S6). Similar to non-TE induced H3K9me2-enriched regions in euchromatin, TEs spatially interacting with PCH are closer to PCH genomic regions on the linear chromosome than those that do not interact with PCH (Mann-Whitney U test, p = 0.037, Figure S12). PCH-interacting TEs include those from roo, pogo, 17.6, mdg3, FB, and S families. However, they were not significantly enriched for any specific TE family (Fisher’s Exact Test for individual TE family, p > 0.26), class, type, or sex-chromosome linkage (Table S6).
The polymorphic nature of TEs offers a rare opportunity to compare the 3D conformations of homologous sequences with and without TE-induced H3K9me2/3 enrichment. To validate the Hi-C results, we performed FISH analysis focusing on two TEs that are present in the Hi-C strain (ORw1118) but absent in another wildtype strain. These two TEs also induced ORw1118-specific enrichment of H3K9me2 (Figure S10) and spatially interact with PCH (TE1-2, Figure 3C). As controls, we included two additional ORw1118-specific TEs that did not interact with PCH (c.TE1-2, Figure 3C). Our FISH used Oligopaint probes that target unique regions flanking the selected euchromatic TE insertions (Table S5) and probes that broadly mark PCH (see Figure S8 for representative cell images). For TE1 and TE2, the relative 3D distance to PCH signals is shorter in ORw1118 than in wildtype (Mann-Whitney U test, p = 0.0004 (TE1) and p = 0.015 (TE2), Figure 4A). Interestingly, the distribution of relative distance between TE1/TE2 and PCH is bimodal for ORw1118 nuclei but unimodal for wildtype, which lacks the peaks around zero, or nuclei with overlapping foci (Figure 4B). Indeed, there are more nuclei with overlapping foci in ORw1118 than in the wildtype (Fisher’s Exact Test, p = 0.0003 (TE1) and 0.070 (TE2)). Importantly, these between-strain differences were not observed for control TEs that lacked PCH interactions (Mann-Whitney U test, p = 0.55 (c.TE1) and 0.91 (c.TE2), Fisher’s Exact test, p = 0.49 (c.TE1) and 1 (c.TE2), Figure 4A and 4B). This comparison of homologous regions with and without euchromatic TEs suggests that H3K9me2 enrichment is required for spatial interactions between euchromatic regions and PCH domains.

(A, B) Boxplot (A) and histogram (B) showing the relative distance between euchromatic TE neighborhood and PCH. Relative distance was estimated for ORw1118 (ORw, orange, TE present) and wild type (WT, green, no TE present) embryonic cells. (C, D) Boxplot (C) and (D) histogram comparing TE1-PCH relative distance between genotypes and between treatments. Relative distance was estimated for permeabilized ORw and WT embryos (EPS, see Materials and Methods) and permeabilized ORw and WT embryos with 1,6-hexanediol treatments (EPS+HD). In (A, C), numbers of nuclei counted are in parentheses. In (B, D), threshold for nuclei with overlapping foci is denoted with arrow, and the percentages denote nuclei with overlapping foci. FISH analysis based on absolute distance led to the same conclusions (Figure S13, S14). (E) Population frequencies of TEs with and without PCH interaction. Note that high frequency TE insertions (population frequency > 0.05, arrows) all show no PCH interactions. * p < 0.05, ** p < 0.01, *** p < 0.001, n.s p > 0.05.
The coalescence of PCH regions located on different chromosomes into 3D PCH domains in Drosophila exhibits properties characteristic of liquid-liquid phase separation, including sensitivity to 1,6-hexanediol (23), a mild perturbant of hydrophobic interactions (59). To investigate if the 3D contacts between euchromatic H3K9me2-enriched regions and PCH domains is mediated by similar biophysical interactions, we used FISH to compare the 3D distance between PCH and euchromatic H3K9me2-enriched regions that displayed significant PCH interactions (see above) in permeabilized embryos with and without 1,6-hexanediol treatment (see Materials and Methods). We focused on TE1 because it is ORw1118-specific and leads to strain-specific H3K9me2 enrichment. This allows comparisons between genotypes with and without TEs to investigate whether the sensitivity to 1,6-hexandiol treatment is H3K9me2-enrichment dependent (Figure 4A and 4B). We observed significantly longer TE1-PCH relative 3D distance (orange in Figure 4C, Mann-Whitney test, p < 10-4) and fewer nuclei with overlapping foci (orange in Figure 4D, Fisher’s Exact test, p = 0.02) in ORw1118 embryos treated with 1,6-hexanediol compared to untreated controls. In contrast, no such difference was observed in wildtype embryos, which do not have the TE insertion and thus no frequent TE1-PCH 3D contacts (green in Figure 4C and 4D, Mann-Whitney test, p = 0.74, and Fisher’s Exact test, p = 1). Importantly, the significant difference in TE1-PCH 3D distance between genotypes with and without TE insertion is only observed for embryos without 1,6-hexanediol treatments (Mann-Whitney test, p = 0.0037, Fisher’s Exact test, p = 0.057), but not for those with the treatment (Mann-Whitney test, p = 0.77 and Fisher’s Exact test, p = 0.55, Figure 4C and 4D). The sensitivity of TE-PCH 3D contacts to 1,6-hexanediol is consistent with the spatial interactions between euchromatic H3K9me2-enriched regions and PCH domains being mediated by liquid fusions, an emergent property of liquid-liquid phase separation.
Overall, the Hi-C and FISH analyses reveal a previously unknown picture of the 3D architecture of the PCH domains (Figure 5): the spatial interactions within the domains, instead of being random, are hierarchical. In addition, despite the separation of euchromatic and PCH territories on the same chromosome arm (60), ∼13% of the euchromatic loci enriched with H3K9me2 (with and without TEs) also dynamically interact with the main PCH domains. Both PCH-PCH and EU-PCH interactions happen most often within chromosome arms, which is consistent with the predictions of polymer physics on chromosome folding (61, 62). Specific spatial contacts between PCH regions located on different chromosomes are surprising, but nevertheless consistent with the observed coalescence of PCH of all chromosomes into chromocenters. The varying frequencies of inter-chromosomal interactions could result from non-random positioning of PCH regions upon mitotic exit (31). Alternatively, variation in biophysical properties (e.g. viscosity or varying protein compositions (63)) among PCH domains arising from specific chromosomes could result in different frequencies of liquid-liquid fusion. Finally, the tendency of H3K9me2-enriched regions in euchromatic genome to interact with PCH strongly depends on the distance to PCH on a linear chromosome. This suggests that euchromatic regions and PCH could be in transient proximities with a frequency that largely follows polymer physics of chromosome folding. The enrichment of H3K9me2/3 and the reader protein HP1a at specific euchromatic loci would then allow their liquid-like fusion with HP1a-enriched PCH, resulting in frequent and/or maintained EU-PCH 3D interactions.

PCH genomic regions located on different chromosomes coalesce to form the 3D PCH domains, or chromocenters. PCH regions (darker color) and euchromatic genome (lighter color) form their own separate territories. PCH regions on different chromosomes interact, with inter-arm (2L-2R, 3L-3R) and inter-chromosomal 3rd-4th chromosome 3D interactions being more frequent than random expectations. 3D contacts between polymorphic H3K9me2/3-enriched regions in euchromatic genome (gray bar) lead to varying 3D genome conformations between individuals (arrows). 3D structures of the euchromatic genomes were based on (60).
A dominant factor governing the population frequencies of TEs (presence/absence in a population) is natural selection against their deleterious fitness impacts (54, 64, 65). We estimated the population frequencies of studied TE insertions (in ORw1118 genome) in a large panmictic African population (see Materials and Methods). TEs with PCH interactions have significantly lower mean population frequencies than TEs without (t-test, p = 0.0042, mean frequency 9.7×10⁻⁴ (with spatial interaction) and 9.6×10⁻³(without)) and their frequency spectrum is more skewed towards rare variants (Figure 4E). Both of these observations support stronger selection against TEs with PCH interactions than other TEs (54, 64, 65), which could result from selection against the functional consequences of TE-PCH 3D interactions. It is worth noting that even 0.01% variation in fitness, which could be rarely detected in a laboratory, can result in large differences in population frequencies in nature.
What are the potential functional consequences of TE-PCH interactions that could influence individual fitness? TE-PCH interactions could lead to increased TE-induced silencing of neighboring sequences/genes. However, we found no difference in the extent or the magnitude of H3K9me2 spread around TEs with and without PCH interactions (Mann-Whitney U test, p = 0.30 (extent) and 0.53 (magnitude), Figure S15), suggesting that TE-PCH interactions influence other aspects of nuclear organization critical for gene regulation and/or other genome functions. For instance, 3D interactions between PCH and TEs could bring neighboring euchromatic genes into the PCH domains and result in aberrant silencing. On the other hand, the enrichment of HP1a, and likely spatial localization in the PCH domains, can play positive roles for the expression of genes in both PCH genomic regions (24, 66, 67) and euchromatic genome (68–70). Still another possibility is that the spatial contact with PCH on one chromosome may “drag” its homolog to the same nuclear compartment due to somatic homolog pairing (reviewed in (71)), resulting in trans-silencing (72). A preliminary analysis found that ∼15% of heterozygous TEs induced H3K9me2 enrichment not only in cis, but also in trans on the homologous chromosome without the TE insertion (i.e. trans-epigenetic effects, Stext). Accordingly, the fitness consequences of TE-PCH spatial interactions could potentially result from their positive as well as negative impacts on the expression of genes in cis or in trans to TEs, or from influencing other genome functions, such as replication and repair.
It is important to note that TEs comprise an appreciable fraction of the euchromatic genomes of virtually all eukaryotes (73). For instance, more than 50% of the assembled human euchromatic genome contains TEs or TE-derived sequences (74, 75), many of which are interspersed with actively transcribed genes and can influence gene expression through H3K9me2/3 spreading (52). Moreover, the presence of many TE insertions at specific locations are polymorphic between individuals in natural populations (e.g. human (76, 77), Caenorhabditis (78, 79), Drosophila (55, 56, 80), and Arabidopsis (81–83)). Spatial interactions between euchromatic TEs and PCH can thus generate polymorphic 3D organization of euchromatic genomes (Figure 5), leading to variation in critical biological functions that depend on chromosome conformations and even varying fitness between individuals. Our investigation of the spatial architecture of PCH domains could thus have strong implications for how such 3D organizations could influence gene regulation, genome function, and even genome evolution of both heterochromatin and the gene-rich euchromatin.
Materials and Methods
Fly strains and culture
Three D. melanogaster strains were used: Oregon-R w1118 (abbreviated ORw1118, (8)) and two wildtype strains, RAL315 (Bloomington Drosophila Stock Center (BDSC) 25181) and RAL360 (BDSC 25186). The latter two are part of a large collection of genomically sequenced natural D. melanogaster strains (84), whose TE insertion positions were previously identified (80). Flies were reared on standard medium at 25°C with 12hr light/12hr dark cycle.
Euchromatin-heterochromatin boundaries
To identify Hi-C reads coming from PCH genomic regions, we used epigenetically defined euchromatin-heterochromatin boundary in (30) and converted those to Release 6 coordinates using liftover (https://genome.ucsc.edu). For defining euchromatic H3K9me2-enriched regions and euchromatic TE insertions, we used 0.5 Mb inward (distal to PCH) of the epigenetically defined euchromatin-heterochromatin boundary to be conservative. The entirety of 4th and Y chromosomes are enriched with heterochromatic marks (30, 38) and are considered to be entirely heterochromatic.
Generation and analysis of H3K9me2 ChIP-seq data
We performed ChIP-seq using antibody targeting H3K9me2 (Abcam 1220) on 16-18hr embryos of ORw1118 and two wildtype strains (see above). Embryo collections and ChIP-seq experiments were performed following (34), except that sequencing libraries were prepared using NEBNext Ultra DNA Library Prep Kit for Illumina (NEB cat#E7370L) following manufacturer’s protocol and sequenced on Illumina Hi-Seq 4000 with 100bp paired-end reads. Each sample has two ChIP replicates with matching inputs.
Raw reads were processed with trim_galore (85) to remove adaptors, low quality bases, and single-end reads. Processed reads were mapped to release 6 D. melanogaster genome with bwa mem with default parameters. Reads with mapping quality lower than 30 were removed using samtools (86). We ran Macs2 (87) using broad-peak and pair-end mode, and a liberal p-value threshold (0.5). This was followed by performing Irreproducible Rate (IDR) analysis (88) to identify H3K9me2 enriched regions that are consistent between replicates. We defined H3K9me2-enriched regions as those with low IDR (IDR < 0.01). IDR plots for replicates for three ChIP-seq samples can be found in Figure S16-18.
Identification and analysis of TE insertions
Genomic DNA was prepared from 100 ORw1118 adult female flies for each biological replicate with Gentra Puregene Cell kit (Qiagen cat#158388) according to the manufacturer’s instructions. Whole genome sequencing was done with overlapping 165bp pair-end sequencing on 230-240bp size genomic fragments. We combined all three replicates to call TEs and quality filtered reads with Trim_galore. We used TIDAL (80), which calls TEs with split-read methods and requires input reads to have the same length. Accordingly, we used two approaches to generate single-end reads from the original pair-end data (1) treating pair-end reads as single-end and (2) use SeqPrep (https://github.com/jstjohn/SeqPrep) to merge overlapping reads and trimmed reads to 200bp. 249 called TEs (with at least three coverage ratio (i.e. read number supporting TE presence/TE absence)) overlap between the two approaches (89.2% and 89.9% of the called TEs respectively). We further removed TEs in shared euchromatic H3K9me2 enriched regions of wildtype strains (RAL315 and RAL360), with the idea that local enrichment of H3K9me2 in ORw1118 cannot be unambiguously attributed to the presence of TE insertions. In total, 166 euchromatic TEs were identified with these criteria.
To identify TE-induced local enrichment of H3K9me2, we used methods described in (34), which leverages between strain differences to identify TE-induced H3K9me2 enrichment regions with any shape, which oftentimes do not resemble peaks (e.g. Figure S10). This approach is more sensitive than other custom pipelines, which look for enrichment with “peak” shape, followed by ad hoc merging of sharp peaks to generate “broad peak” calls (reviewed in (57, 58)). We compared the enrichment of H3K9me2 in euchromatic TE neighborhoods in ORw1118 against wildtypes strains to estimate (1) the extent of TE-induced H3K9me2 enrichment (in kb) and (2) % of increase of H3K9me2 enrichment. We identified 106 ORw1118 TEs leading to at least 1kb spread of H3K9me2, with only 13 of them overlap with H3K9me2 enriched regions identified by Macs2.
We used the same approach as in (34) to estimate the population frequencies of ORw1118 TEs in an African population (89). Similar to previously reported low population frequencies of TEs in Drosophila (54–56), only 36.36% of the 106 euchromatic TEs that induced H3K9me2 enrichment are present in a large African population (89) (i.e. 63.64% of those TEs are unique to ORw1118). This generally low population frequency of TEs is expected to limit the statistical power of comparison between TEs with and without PCH interactions. Indeed, we found that the median population frequencies for both TEs with and without PCH interactions are zero and not significantly different (Mann-Whitney U test, p = 0.10). Accordingly, we instead investigated whether the mean of their population frequencies differ (see main text).
Analysis of Hi-C data
Raw Hi-C reads from (37) were downloaded from GEO and quality filtered with trim_galore. TEs are abundant in both euchromatin and heterochromatin in Drosophila (36, 90), and we were unable to unambiguously define which genomic compartment a TE-mapping read is from. Accordingly, we filtered reads that mapped to canonical TEs using bwa (91) and samtools (86). Filtered reads were then mapped to release 6 D. melanogaster reference genome using bwa mem with default parameters. Three types of reads are defined as from heterochromatin. (1) Reads that uniquely mapped (mapping quality at least 30) within epigenetically defined PCH regions. (2) Reads mapped to known heterochromatic repeats (Table S1). (3) Reads that mapped to epigenetically defined PCH but have mapping quality equals zero, which bwa assigns to multiple-mapped reads. All the reads parsing were done with samtools. Figure S1 shows the flow chart for the filtering and mapping of the Hi-C reads, and the number of reads at each step.
Spatial interaction between PCH regions
Hi-C read pairs whose both ends mapped uniquely to epigenetically defined PCH were included in the analysis. Read pairs whose mapping locations are within 10kb to each other were removed, as our analysis focuses on long-range spatial interactions. We performed three sequential analyses (all read pairs, excluding intra-arm read pairs, excluding intra-chromosome read pairs) to identify three types of PCH-PCH interactions: within arm, within chromosome between arms (e.g. 2L-2R, 3L-3R), and between chromosomes. It is worth noting that not enough sequences have been assembled on the short arms of X, Y and 4th chromosomes, thus precluding within chromosome, between arms analysis for these chromosomes. Theoretical percentage of each pairwise interaction among PCH regions on different chromosomes was estimated based on the mappability track of D. melanogaster Release 6 genome, which was generated using GEM mappability tool (using read length 50 and other default parameters, (42)). We then counted the number of bases with mappability one (i.e. can be unambiguously mapped in the genome) in the PCH regions of each chromosome. Empirical expected percentage of each pairwise interaction was estimated from the percentage of reads mapping uniquely to the PCH on each chromosome arm, ignoring read pair information. Because the Hi-C data were generated using unsexed embryos, we assumed equal sex ratio when estimating expectations. To assess whether the observed percentage is more than the empirical expectation, we randomly permuted 10,000 times read pair labels, generated an empirical distribution of the percentage, and calculated p-values.
Spatial interaction between euchromatic regions and heterochromatin
We used samtools to parse out read pairs whose one end mapped uniquely (with mapping quality at least 30) within the focused euchromatin regions, and estimated the percentage of PCH reads at the other end. All three categories of heterochromatic reads were included. Regions with less than 1,000 Hi-C read pairs were excluded from the analysis. We found strong correlations between replicates for both the percentage of euchromatin-PCH reads and the associated p-values (see below) for H3K9me2-enriched regions and TEs (Spearman rank ρ > 88%, p < 10-16, Figure S19, 20). To assess whether the percentage of euchromatin-PCH read pairs is significant, we randomly selected euchromatic regions without H3K9me2 enrichment, performed the same analysis to get a null distribution of the percentage, and estimated the p-values. We simulated 200 sets of non-H3K9me2 enriched random euchromatic regions that are of the same sample size, on the same chromosome and, for H3K9me2 enriched regions, of the same size as the focused set. This was done separately for H3K9me2 enriched regions and TEs, and separately for the two replicates. Because of the tendency of within chromosome interactions (see main text) and the difference in the PCH sizes among chromosomes (35, 36), the percentage of euchromatin-PCH read pairs varies between randomly selected regions on different chromosomes (Figure S21). Also, smaller euchromatic regions have fewer Hi-C read pairs included in the analysis, which translates into smaller sample size and thus larger variance of the estimated percentage (Figure S22), leading to the estimates more likely to hit the boundary condition (i.e. no euchromatin-PCH read pairs, Figure S22, red circles). Accordingly, for each euchromatic region, the p-value is estimated using random regions that are on the same chromosome and of the same size quantile. For euchromatic H3K9me2 enriched regions, we used +/-1kb of the enriched region as the defined window. Because, unlike H3K9me2 enriched regions, euchromatic TEs were identified as a small interval with possible insertions within (80), we used +/-2kb of the TE insertion site/interval as the defined window.
Generation of FISH probes
Heterochromatic repeat probes
LNA probes (92) targeting AAGAG (bulk heterochromatin), AACAC (2R PCH), dodeca (3R PCH), AATAT (4th and Y), and AATAGAC (Y) were ordered from Integrated DNA Technologies (IDT).
Oligopaint FISH probes
We designed Oligopaint probes that target single copy genome regions, following (47, 93). Each targeted euchromatic region has at least 500 probes designed to label it, with at least 12 probes/kb (Table S6). For euchromatic TEs, designed Oligopaint probes target the “flanking” unique sequences instead of the TE itself. Within the total oligo library, each pool of probes targeting a genomic region was designed with an appended specific barcode (https://github.com/gnir/OligoLego, (94)), and an additional Universal barcodes that were appended to the very 5’ and 3’ ends, both were used for PCR amplification of the specific/total library. Primary Oligopaint libraries were ordered from CustomArray (Bothell, WA), and amplified and synthesized into Oligopaint probes following (49). To label specific subsets of oligos within the library, complementary “bridge” oligos were hybridized against their barcodes, followed by hybridization with fluorophore-labeled secondary oligos complementary to an overhang of the bridge oligo. Bridge oligos and fluorescence labeled secondary Oligopaint probe were ordered from IDT.
Embryo collections, treatments, and fixations
Embryo collections
Flies laid eggs on fresh apple juice plate for 1hr (pre-lay), followed by 2hr egg-laying on new apple juice plates. Collected embryos were incubated at 25°C for 16hr to harvest 16-18hr embryos, which were then fixed immediately.
Embryo permealization and 1,6-hexanediol treatment
To allow effective permeabilization of 16-18hr late stage embryos for 1,6-hexanediol treatment, 0-2hr embryos were incubated at 18°C for 32hr, which equals to 16hr development at 25°C (95). Embryos were dechorionated in 50% bleach for 90s, washed with water for 1 min, and treated with EPS, a d-limonene based solvent with low toxicity (95, 96), for 2 min. Permeabilized embryos were either fixed immediately or incubated in 10% 1,6-hexanediol for 4 min, followed by a quick wash with PBS and fixed immediately.
Fixation of embryos
16-18hr embryos (without treatment) were dechorionated in 50% bleach for 90s, washed with water for 1 min. Dechorionated embryos, embryos with EPS treatment, or embryos with EPS and 1,6-hexanediol treatments were transferred to biphasic fixation solution with 4% formaldehyde (1.2mL Heptane, 75μL 16% formaldehyde, and 225 μL PBS), and shake for 20 min at room temperature. Embryos were then transferred to tubes with biphasic solution of equal volume of heptane and methanol, followed by vigorous shaking for 30-45s to crack the embryos, three washed with methanol, and stored in −20°C in methanol.
FISH
Repeat probes
Embryos (stored in methanol) were rehydrated sequentially into PBT (1xPBS, 0.1% Tween-20), incubated with 100 μg/mL RNAseA in PBT for two hours at room temperature, washed twice with PBT, post-fixed with 4% formaldehyde in PBT for 20min, washed three times with PBT, and then sequentially transitioned into hybridization buffer (50% formamide, 5x SSC, 100 μg/ml Heparin, 100 μg/ml sheared salmon sperm DNA, and 0.1% Tween-20). Before hybridization, embryos were incubated with pre-hybridization solution (hybridization buffer boiled at 100°C for 5 min, chilled on ice) at 56°C for at least two hours. Embryos were then incubated with 25 ng/μL of LNA repeat probes (denatured at 70°C for 3 min) at 80°C for 15 min and then 37°C with shaking overnight. For FISH with AATAT probe, embryos were incubated at 37°C for three hours, then 25°C overnight. Embryos were washed with hybridization buffer twice at 37/25°C, followed by sequential transition into PBT, two PBT washes at room temperature, DAPI staining, two PBS washes, resuspended in Prolong Gold Antifade (Life Technologies), and mounted on slides.
We used AATAT to mark 4th chromosome heterochromatin. Because this repeat is also abundant on the Y (43), embryos were also stained with Y-specific repeat, AATAGAC and female embryos were analyzed.
Oligopaint probes and AAGAG probe
Embryo FISH with both Oligopaint and AAGAG (for bulk heterochromatin) LNA probe followed (97), except for staining nuclei with DAPI and resuspension in Prolong Gold Antifade (Life Technologies).
Imaging and data analysis
Images of embryos were collected on Zeiss LSM710 confocal florescence microscope, using a 1.4NA 63X oil objective (Zeiss), and analyzed in Fiji (98). Distances between foci were measured by Fiji linetool, and divided by the radius of the nucleus to get relative distance. In cases where the nuclei are not perfectly round, we used radius on the longest axis. At least 70 nuclei were counted for each treatment/genotype.
Funding
YCGL: NIH K99 GM121868
YO: JSPS Overseas Research Fellowships (Japan Society for the Promotion of
Science)
BJB: Damon Runyon Cancer Research Fellowship (HHMI)
CTW: NIH DP1GM106412, RO1HD091797, and RO1GM123289
GC: European Research Council (ERC-2008-AdG no. 232947), the CNRS, the
European Union’s Horizon 2020 research and innovation program under grant agreement No. 676556 (MuG), and the Agence Nationale de la Recherche (N. ANR-15-CE12-006-01) GHK: NIH R01 GM117420
Acknowledgement
We thank Kyle Millis for technical help with FISH, members of the Karpen lab for many helpful discussions, and Aniek Janssen, Serafin Colmenares, and Sasha Langley for carefully reading the manuscript. We thank Charles Langley for providing computational resources. We appreciate Jumana AlHaj Abed and Jeleca Erceg for helpful discussions of the Oligopaint experimental design. We also thank Vincent J. Coates Genomics Sequencing Laboratory (GSL) at UC Berkeley, MGX sequencing and Drosophila facilities (BioCampus Montpellier, CNRS, INSERM, Université de Montpellier).
References
- 1.↵
- 2.
- 3.
- 4.↵
- 5.↵
- 6.↵
- 7.↵
- 8.↵
- 9.
- 10.↵
- 11.↵
- 12.↵
- 13.↵
- 14.↵
- 15.↵
- 16.
- 17.↵
- 18.↵
- 19.↵
- 20.↵
- 21.↵
- 22.↵
- 23.↵
- 24.↵
- 25.↵
- 26.
- 27.↵
- 28.↵
- 29.
- 30.↵
- 31.↵
- 32.↵
- 33.↵
- 34.↵
- 35.↵
- 36.↵
- 37.↵
- 38.↵
- 39.↵
- 40.
- 41.↵
- 42.↵
- 43.↵
- 44.↵
- 45.↵
- 46.↵
- 47.↵
- 48.
- 49.↵
- 50.↵
- 51.↵
- 52.↵
- 53.↵
- 54.↵
- 55.↵
- 56.↵
- 57.↵
- 58.↵
- 59.↵
- 60.↵
- 61.↵
- 62.↵
- 63.↵
- 64.↵
- 65.↵
- 66.↵
- 67.↵
- 68.↵
- 69.
- 70.↵
- 71.↵
- 72.↵
- 73.↵
- 74.↵
- 75.↵
- 76.↵
- 77.↵
- 78.↵
- 79.↵
- 80.↵
- 81.↵
- 82.
- 83.↵
- 84.↵
- 85.↵
- 86.↵
- 87.↵
- 88.↵
- 89.↵
- 90.↵
- 91.↵
- 92.↵
- 93.↵
- 94.↵
- 95.↵
- 96.↵
- 97.↵
- 98.↵


