

Abstract
Plant-insect interactions are ubiquitous, and have been studied intensely because of their relevance to damage and pollination in agricultural plants, and to the ecology and evolution of biodiversity. Variation within species can affect the outcome of these interactions, such as whether an insect successfully develops on a plant species. Whereas specific genes and chemicals that mediate these interactions have been identified, studies of genome-or metabolome-wide intraspecific variation might be necessary to better explain patterns of host-plant use and adaptation often observed in the wild. Here, we present such a study. Specifically, we assess the consequences of genome-wide genetic variation in the model plant Medicago truncatula for Lycaeides melissa caterpillar growth and survival (i.e., larval performance). Using a rearing experiment and a whole-genome SNP data set (>5 million SNPs), we show that polygenic variation in M. truncatula explains 9–41% of the observed variation in caterpillar growth and survival. We detect genetic correlations among caterpillar performance and other plant traits, such as structural defenses and some anonymous chemical features; these genetic correlations demonstrate that multiple M. truncatula alleles have pleiotropic effects on plant traits and caterpillar growth or survival (or that there is substantial linkage disequilibrium among loci affecting these traits). We further show that a moderate proportion of the genetic effect of M. truncatula alleles on L. melissa performance can be explained by the effect of these alleles on the plant traits we measured, especially leaf toughness. Taken together, our results show that intraspecific genetic variation in M. truncatula has a substantial effect on the successful development of L. melissa caterpillars (i.e., on a plant-insect interaction), and further point toward traits mediating this genetic effect.
Introduction
Organisms interact with members of other species in myriad ways, including competition for resources, predation, parasitism, herbivory, mutualism and pollination. Phenotypic and genetic variation within species can affect the outcome of these interspecific interactions (Bolnick et al., 2002; Crutsinger et al., 2006; Farkas et al., 2013; Thompson, 2013; Hendry, 2016). For example, a genetic polymorphism for cryptic color pattern affects the probability that Timema cristinae stick insects are predated by birds (Nosil, 2004; Nosil et al., 2018), and allelic variation in Daphnia magna and its bacterial microparasite, Pasteuria ramosa, alters infection rates (Carius et al., 2001; Luijckx et al., 2011, 2013). Intraspecific variation can also affect the establishment and evolution (or co-evolution) of new interactions, including those that form following species introductions (e.g., Cox, 2004; Strauss et al., 2006; Lankau, 2012; Mandeville et al., 2017).
Interactions between plants and herbivorous insects have received considerable scientific attention due to their ubiquity (Forister et al., 2015), their agricultural relevance (Via, 1990; Schoonhoven et al., 2010), and their hypothesized contribution to the extreme biodiversity of these taxonomic groups (via co-evolutionary diversification; Ehrlich & Raven, 1964; Mitter et al., 1988; Fordyce, 2010; Edger et al., 2015; Braga et al., 2018). These interactions are often affected by genetic variation within species, including variation in plant resistance to insects, and for insect acceptance of and performance on potential host plants (e.g., Rausher & Simms, 1989; Via, 1990; Berenbaum & Zangerl, 1998; Stowe, 1998; Dambroski et al., 2005; Ordas et al., 2009; Schoonhoven et al., 2010; Gompert et al., 2015; Mitchell et al., 2016; Nouhaud et al., 2018). Progress in explaining this variation has been made by identifying specific phytochemicals responsible for resistance to insects (e.g., fura-nocoumarins and glucosinolates), as well as the insect genes and pathways that detoxify these compounds (e.g., cytochrome P450 enzymes, nitrile specifier protein, etc.; Li et al., 2003; Wen et al., 2006; Wheat et al., 2007; Schoonhoven et al., 2010). Genomic and metabolomic approaches have begun to provide a more complete view of how within-species variation affects plant-insect interactions (e.g., Harrison et al., 2018; Nallu et al., 2018). As an example, a recent study of intraspecific variation across 770 traits (including 753 chemical features) in alfalfa showed that among-plant variation in insect herbivore communities was best explained by non-linear interactions among suites of plant traits (Harrison et al., 2018). Such findings highlight the need for quantitative, genome-, phenome-and metabolome-scale analyses of the ecological and evolutionary consequences of intraspecific variation in plant-insect systems. In fact, these approaches may be necessary to explain the geographic mosaic of host-plant use and plant-insect co-evolution found in nature (but see, e.g., Berenbaum & Zangerl, 1998), in other words, to address questions such as: (i) Why are certain plant species fed on by a species of insect in some places but not others?, and (ii) To what extent do different host-plant populations represent distinct adaptive landscapes?.
Here, we take an initial step towards this larger aim by quantifying the effect of genome-wide plant genetic variation on caterpillar performance (weight and survival) in the Melissa blue butterfly, Lycaeides melissa (Lepidoptera: Lycaenidae). Lycaeides melissa butterflies are found throughout western North America where they feed on various legume hosts, particularly from the genera Astragalus and Lupinus (Scott, 1986). Medicago sativa (alfalfa) is a legume native to Eurasia that was introduced to North America ~250 years ago as a forage crop (Michaud et al., 1988). Since then, L. melissa has repeatedly colonized M. sativa, and numerous L. melissa populations now use this plant as their primary host, especially where M. sativa has escaped from cultivation along roadsides and trails (Chaturvedi et al., 2018). Lycaeides melissa populations that use M. sativa show evidence of adaptation to this host, such as increased oviposition preference and larval performance (Forister et al., 2012; Gompert et al., 2015). However, M. sativa remains an inferior host in terms of laraval performance relative to other common hosts, and many M. sativa populations are not used by L. melissa within L. melissa’s range (Forister et al., 2009). Thus, host use in L. melissa comprises a mosaic of occupied and unoccupied patches of M. sativa and native legume hosts. Previous experiments documented genetic variation within L. melissa populations for larval performance on M. sativa (Gompert et al., 2015), and also showed that M. sativa populations vary in their suitability for L. melissa caterpillars (Harrison et al., 2016). However, past experiments were not designed to parse genetic versus environmental contributions to host-plant suitability (this distinction is critical for co-evolutionary dynamics), nor to identify specific plant traits (or plant genes) affecting L. melissa caterpillar performance.
Our ultimate goal is to explain variation in the (relatively recently established) interaction between M. sativa and L. melissa across the landscape. This includes determining to what extent genetic differences among M. sativa plants affect whether a M. sativa population is colonized by L. melissa, and to what extent genetic differences among plant populations affect subsequent ecological and evolutionary dynamics and outcomes (e.g., L. melissa demographics, the degree of host adaptation, etc.). Despite its role in agriculture, genomic resources for M. sativa are limited. Consequently, in the present study we use the model plant Medicago truncatula as a proxy for M. sativa. Medicago truncatula is a close relative of M. sativa that occurs throughout the Mediterranean basin in Europe and is cultivated in Australia (Choi et al., 2004a, b). Because of its modest genome size (~500 million base pairs), simple diploid genetics, and short generation time (~10 weeks), M. truncatula has been developed as the model species for legumes (Young & Udvardi, 2009; Young et al., 2011). Resources for this species include a high-quality reference genome and hundreds of fully sequenced, inbred lines derived from natural accessions (Young et al., 2011; Stanton-Geddes et al., 2013). Unlike M. sativa, M. truncatula is not found in North America and thus is not available as a host for L. melissa (i.e., it is not part of L. melissa’s realized niche). However, both Medicago species could be used by other Lycaeides in Eurasia where most of the biodiversity in this genus is found (North American Lycaeides are descended from Eurasian ancestors that came across the Bering land bridge about two million years ago; Gompert et al., 2008; Vila et al., 2011). Thus, while our results do not directly assess variation in M. sativa, they can show the potential for intraspecific plant genetic variation to affect plant-insect interactions in this system; further, we hypothesize that the M. trunatula genes and traits affecting caterpillar performance will function similarly in M. sativa.
In this study, we combine statistical genomic methods with a caterpillar rearing experiment to assess the effect of M. truncatula phenotypic and genetic variation on L. melissa caterpillar performance. We address the following specific questions: (i) How much of the variation in L. melissa growth and survival can be explained by genetic variation in M. truncatula?, (ii) Do genetic loci that affect a set of measured plant traits (some putatively associated with plant vigor or defense) have pleiotropic effects on caterpillar performance?, and (iii) How well do the effects of M. truncatula alleles on the measured plant traits explain their effects on caterpillar performance. Thus, we quantify the direct effect of M. truncatula genetic variation on caterpillar performance, and its effect through a set of plant traits. We think that this combination of approaches has the potential to (a) provide a more mechanistic understanding of this plant-insect interaction by connecting genetic patterns with plant traits, and (b) discover previously unhypothesized sources of variation in caterpillar performance by identifying alleles associated with caterpillar performance that are not associated with any of the plant traits we measured. Moreover, the methods and approaches we use allow us to generate statistical and functional information about the genetic basis of this interaction even if it is polygenic (see Methods and Results for details).
Methods
Plant propagation and trait measurements
We obtained seeds from 100 M. truncatula lines, which are part of the Medicago HapMap project (http://www.medicagohapmap.org). Seeds (i.e., germplasm) were obtained from INRA-Montpellier (Montpellier, France), and from the USDA Agricultural Research Station at Washington State University (Pullman, WA, USA; Table S1). Each line was derived from a natural accession, but has since been inbred to near complete homozygosity. Whole genome sequences are available for each line (Branca et al., 2011; Stanton-Geddes et al., 2013), and the lines have been used in other genome-wide association mapping studies (GWAS), including GWAS on biomass, drought-related traits, plant defenses, flowering time, and nodulation (e.g., Stanton-Geddes et al., 2013; Kang et al., 2015).
Plant traits along with our predictions about their primary functional roles and relationships with caterpillar performance. We are presenting simplified predictions to guide interpretation, but are aware that the traits potentially have multifaceted relationships to growth and defense. ↗ denotes a positive correlation with caterpillar performance, whereas ↘ denotes a negative relationship with caterpillar performance. Our classification of SLA is based on its general association with mechanical properties of leaves, including work to shear, tear and penetrate (reviewed in Hanley et al., 2007). All 19 IR chemical features are treated together here, and thus we predict that they include a mixture of features associated with vigor (↗) and defense (↘). Leaf shape is not included in the table, as its putative function and effects are not known.
We planted five replicate pots with seeds from each of the 100 M. truncatula lines on May 4th and 5th, 2017 (see “Planting and tending Medicago truncatula” in the online supplemental material [OSM] for additional details). Medicago truncatula plants were grown in a greenhouse under ambient light (~14–15 hours of daylight) at approximately 18–27°C (with variable humidity), and were watered daily or every other day as needed. We thinned the M. truncatula seedlings on May 26th (i.e., after germination was complete) to ensure that no pots had more than two plants. This was done to minimize competition among plants, while still providing sufficient plant biomass for the caterpillar rearing experiments. A few plant lines had low germination rates and were dropped from the experiment leaving us with 94 lines, each with five replicate pots.
We measured a series of morphological traits potentially associated with plant vigor or resistance to insects (e.g., putative structural plant defenses; Table 1; Levin, 1973; Hanley et al., 2007; Malishev & Sanson, 2015). First, 20 days after planting, we measured leaf size (length, width and area), leaf shape (length/width), trichome density, dry leaf weight and specific leaf area (SLA) for each plant line and replicate (pot) (we haphazardly selected one of the two plants in each pot for taking measurements). We chose the second true leaf for these measurements (that is leaf 1 from branch B0, see Figs. 1 & 2 from Moreau, 2006). We measured the width (at the widest point) and length (along the midvein) of the middle leaflet with calipers (each leaf comprises three leaflets; measurements were taken to the nearest 1 mm). Next, we calculated leaf area (length × width) and shape (length/width) from these measurements. We then counted the number of trichomes in a 2.5 mm diameter circle directly adjacent to the midvein under a stereoscope (35× magnification). The three leaflets from each plant were then placed in a coin envelope in a bin with desiccant. The dry weight of the middle leaflet from each of these leaves was measured on a Mettler Toledo XPE105 analytical microbalance (Mettler Toledo) to the nearest 0.01 mg. Leaf area and dry weight were used to calculate SLA (SLA is the ratio of leaf area to dry mass and is often correlated with leaf mechanical properties, such as work to tear, shear or punch; Hanley et al., 2007).

Plant (M. truncatula) and caterpillar (L. melissa) phenotypic data. Panel (a) provides the coefficient of variation (CV) for each of the nine plant growth/defense traits. Panel (b) presents pairwise phenotypic correlations for the same nine traits (roman numerals denote the trait numbers ordered as in panel a). Pearson correlations are shown in the upper triangle of the correlation matrix, and depicted graphically in the lower triangle of the correlation matrix, with darker shading denoting higher correlations. Panel (c) shows the infrared (IR) absorbance spectra for each plant (one line per plant) (see Fig. S2 for phenotypic correlations for the IR traits). Panel (d) gives the number of caterpillars, pupa, and adults (and thus the total number of L. melissa) alive at 0 to 35 days of age.

Graphical summary of plant (M. truncatula) and caterpillar (L. melissa) trait variation explained by M. truncatula genetics. Bars denote the posterior median for the proportion of trait variation explained by plant genetics (PVE); vertical lines denote the 90% equal-tail probability intervals (ETPIs). Darker shaded regions of the bars provide point estimates (posterior median) for the subset of the PVE attributed to genetic variants with measurable effects (as opposed to infinitesimal effects). Numbers along the top of the plot give point estimates (posterior median) for the number of causal variants affecting each trait (i.e., total number of distinct QTL). See Table S2 for detailed quantitative summaries of these parameter estimates, including measures of uncertainty in each parameter.
REML estimates for each trait of the proportion of phenotypic variation found among M. truncatula lines (‘Prop. var.’). Test statistics (LR = likelihood ratios) and P-values from the null hypothesis test of no line effect are reported.
We measured plant height, from the cotyledons to the tip of the longest branch, 31 days after planting (again, we haphazardly selected one of the two plants in each pot for taking this measurement). Leaf toughness was measured 33 days after planting using a penetrometer. We selected the main leaf from the second primary branch for this assay. The force required to penetrate each of the three leaflets along the midvein was recorded. We took the mean of these three measures as a metric of leaf toughness.
Plant chemistry was quantified with attenuated total reflectance infrared (ATR-IR) spectroscopy. ATR-IR spectroscopy constitutes a quick, cost-effective method to analyze a range of organic chemical compounds in plant and animal tissues. Although the absorbance is directly related to the concentration of specific chemical signatures, there is not a simple one-to-one relationship between IR spectral patterns and specific chemical compounds of interest. Moreover, spectral features are the summation of similar overlapping IR transitions, representative of various compounds within a tissue. Consequently, IR data are often combined with more specific compositional analyses (e.g., HPLC-MS). The combined data can be used to construct a multivariate model linking IR spectral data to chemical compounds (e.g., Foley et al., 1998; Ramirez et al., 2015; Costa et al., 2018). This was not our goal here. We instead used IR spectral features as anonymous chemical markers (akin to AFLPs for genetic analyses) which could be connected to the presence of specific molecules in future work using compositional methods such as liquid chromatography–mass spectrometry.
Infrared spectra were collected using a Thermo Nicolet 6700 FTIR (a high-resolution instrument with a diamond crystal ATR), which was used to scan 4000-600 cm−1 of the infrared spectrum. Leaves were placed in direct contact with the diamond crystal, and the average of 32 scans was recorded for each leaf surface with 4 cm−1 resolution. A Norris-Williams second derivative spectrum was calculated for each transmittance measurement using 5-point smoothing and a gap size of 5 segments (absorbance is directly proportional to concentration [Beer’s Law], and absorbance =-log(transmittance)). We focused on the subset of IR features between ~750 and 1100 cm−1 and with >10% of the phenotypic variation partitioned among plant lines (see Fig. S1).
Caterpillar husbandry and performance assays
We obtained neonate L. melissa caterpillars for larval performance assays on the M. truncat-ula accessions. First, 26 female L. melissa butterflies were collected on June 5th (2017) from a site along the Bonneville shoreline trail in northern Utah, USA (41.725°N, 111.794°W, 1513 m elevation). As in past work (e.g., Forister et al., 2013; Gompert et al., 2015), these butterflies were caged individually in plastic oviposition chambers along with a few sprigs of their host plant (Medicago sativa). After 48 hours, L. melissa eggs were collected from the host-plant material and placed in unvented Petri dishes in a Percival incubator (model no. 136VL; 27°C; 14 hrs. light:10 hrs. dark) until they hatched.
Caterpillars began to emerge on June 9th, and were then placed in individual unvented Petri dishes with a leaf from one of the 94 M. truncatula accessions (i.e., on one of the 94 plant lines). We inspected caterpillars daily, adding new leaf material from the same plant line as needed (as in Gompert et al., 2015). We rotated the replicate/pot used for each plant line each day. Thus, caterpillars only ate leaves from a single plant line (genotype), but fed on all five replicate pots. Caterpillars were maintained in a Percival incubator at 27°C with 14 hour days (10 hours of dark). We reared 486 caterpillars total (~5 per plant line). We checked all caterpillars daily for survival and recorded survival to pupation and survival to eclosion as adults. As an additional metric of performance, we measured 8-and 16-day caterpillar weight (L. melissa caterpillars generally spend 20 to 30 days as larvae) on a Mettler Toledo XPE105 analytical microbalance (Mettler Toledo; weights were recorded to the nearest 0.01 mg). Weight and lifetime fecundity are highly correlated in L. melissa (Forister et al., 2009).
Variance partitioning
Our analyses focus on the 9 plant morphological traits (leaf length, leaf width, leaf area, leaf shape, leaf dry weight, SLA, trichome density, leaf toughness and plant height), 19 IR traits (i.e., anonymous chemical features), and four caterpillar performance traits (weight at 8 days, weight at 16 days, survival to pupation, and survival to eclosion; survival is a binary trait; Table 1). Prior to genetic mapping and genomic prediction, we first quantified the proportion of trait variation found among plant lines (i.e., genotypes) for each of these 32 traits. As we are working with replicated, inbred lines, these are estimates of the broad-sense heritability for each of the traits (with respect to plant not caterpillar genotypes; because caterpillars fed across plants of a genotype, these estimates are upper bounds for the broad-sense heritabilities of the caterpillar performance traits).
We estimated the among-line variance for each trait by fitting linear mixed-effect models via restricted maximum likelihood (REML). This was done with the lmer function in lme4 R package (package version 1.1.19, R version 3.4.4; Bates et al., 2015). We then tested the null hypothesis that the among-line variance was 0 using an exact restricted likelihood ratio test, which was based on 10,000 simulated values to approximate the null distribution (Crainiceanu & Ruppert, 2004; Greven et al., 2008). This was done with the exactRLRT function in the RLRsim package in R (version 3.1.3; Scheipl et al., 2008).
Medicago truncatula genomic data
Whole-genome SNP data for the M. truncatula accessions were obtained from the M. truncat-ula HapMap project (http://www.medicagohapmap.org/; version Mt4.01; Stanton-Geddes et al., 2013). These data comprised 40 million SNPs, which were mapped to the M. truncatula reference genome v4.0 (we used the quality-filtered SNP bcf files; Young et al., 2011). We applied additional quality filters to these data with vcftools (version 0.1.15; Danecek et al., 2011) such that we only retained bi-allelic SNPs with minor allele frequencies > 0.01, and with a minimum sequencing depth of 2× per individual, no more than 20% missing data (across the 94 lines analyzed in this study), and a phred-scaled quality score of ≥ 30. We only considered SNPs mapped to the eight M. truncatula chromosomes. Approximately 13 million SNPs passed these filters. We then used plink (version 1.09; Purcell et al., 2007) to remove redundant SNPs, that is SNPs that were in very high linkage disequilibrium (LD) with each other. Specifically, using the indep-pairwise command, one of each pair of high-LD SNPs, defined as r2 ≥ 0.8 in a 10 kilobase (kb) window, was pruned. After this step, we retained 5,648,722 SNPs for downstream analyses.
The M. truncatula HapMap data set included SNP genotype calls and relative genotype likelihoods generated by GATK (McKenna et al., 2010). Rather than use the raw genotype calls (which ignore uncertainty in genotypes and information from population allele frequencies), we used an empirical Bayesian approach to obtain estimates of genotypes based on the genotype likelihoods and a prior defined by the allele frequencies at each locus. As in past work (e.g., Gompert et al., 2015), we first used an expectation-maximization algorithm to obtain maximum likelihood estimates of the allele frequencies for each SNP. This was done with the computer program estpEM (in Dryad repository, doi:https://doi.org/10.5061/dryad.nq67q; Soria-Carrasco et al., 2014; Riesch et al., 2017). This program implements the EM algorithm from Li et al. (2009) and provides allele frequency estimates that account for genotype uncertainty. Prior probabilities for each genotype were then specified based on the allele frequencies, such that Pr(gij|pi) ~ binomial(pi, n = 2), where gij denotes the genotype at locus i for individual j, and pi denotes the non-reference allele frequency. Next, we computed the posterior probability of each genotype according to Bayes theorem, and obtained point estimates (posterior means) for genotypes  , where L(gj = k) is the relative genotype likelihood based on the sequence data and associated quality scores. These genotype estimates take on values between 0 (reference-allele homozygote) and 2 (non-reference-allele homozygote), but are not constrained to be integer values.
Genome-wide association mapping and genomic prediction
We fit Bayesian sparse linear mixed models (BSLMMs; Zhou et al., 2013) with gemma (version 0.94.1) to quantify the contribution of M. truncatula (i.e., plant) genetic variation to phenotypic variation in the plant traits and L. melissa caterpillar performance. Unlike traditional genome-wide association mapping methods, BSLMMs fit a single model with all SNPs simultaneously and thus mostly avoid issues related to testing large numbers of null hypotheses. In particular, trait values are modeled as a function of a polygenic term and a vector of the (possible) measurable effects (associations) of each SNP on the trait (β; Zhou et al., 2013). Variable selection is used to estimate the SNP effects; SNPs can be assigned an effect of 0 (not in the model) or a non-zero effect (in the model) (Guan & Stephens, 2011). A Markov chain Monte Carlo (MCMC) algorithm is used to infer the posterior inclusion probability (PIP) for each SNP, that is, the probability that each SNP has a non-zero effect. The polygenic term defines an individual’s expected deviation from the grand phenotypic mean based on all of the SNPs. It accounts for phenotypic covariances among individuals caused by their relatedness or overall genetic similarity (i.e., observed kinship; Zhou et al., 2013). The kinship matrix also serves to control for population structure and relatedness when estimating the effects of individual SNPs (β) along with their PIPs. Likewise, SNPs in LD with the same causal variant effectively account for each other, such that only one or the other is needed in the model, and this is captured by the PIPs.
The hierarchical structure of the model provides a way to estimate additional parameters that describe aspects of a trait’s genetic architecture (Guan & Stephens, 2011; Zhou et al., 2013; Lucas et al., 2018). These include the proportion of the phenotypic variance explained (PVE) by additive genetic effects (this includes β and the polygenic term, and should approach the narrow-sense heritability), the proportion of the PVE due to SNPs with measurable effects or associations (this is called PGE and is based only on β), and the number of SNPs with measurable associations (n-γ). All of these metrics integrate (via MCMC) over uncertainty in the effects of individual SNPs, including whether these are non-zero. Likewise, BSLMMs can be used to obtain genomic estimated breeding values (GEBVs), that is, the expected trait value for an individual from the additive effects of their genes as captured by both β and the polygenic term (Lucas et al., 2018). Most other genomic prediction methods provide GEBVs based solely on a polygenic term (e.g., Meuwissen et al., 2001; Hayes et al., 2009; Ober et al., 2012).
We fit BSLMMs for each of 32 traits using gemma (version 0.94.1; Zhou et al., 2013) with 15 MCMC chains each with a 500,000 iteration burn-in followed by 2 million sampling iterations with a thinning interval of 20. GEBVs were obtained using the -predict 1 option, with predictions averaged over the 15 MCMC chains. GEBVs were used to estimate genetic correlations among traits (i.e., a standardized G-matrix). As a guard against statistical artifacts, we fit BSLMMs to 12 pseudo (randomized)-data sets derived from the caterpillar data (while these methods have been assessed in detail elsewhere, e.g., Zhou et al., 2013; Gompert et al., 2017, we were particularly concerned that the low number of survivors and binary data for survival could lead to spurious association; for details, see “BSLMMs fit to randomized data” in the OSM).
Connecting plant trait genetics with caterpillar performance
Genetic covariances (correlations) among plant and caterpillar traits (as captured by the G-matrix) can provide evidence of a shared genetic basis for these traits. However, these treat pairs of traits independently and do not formally quantify the total contribution of alleles affecting the measured plant traits to the alleles affecting caterpillar performance. Thus, we next assessed the extent to which we could explain variation in the caterpillar performance GEBVs based on the GEBVs for the plant morphology and chemistry traits, as well as which plant trait GEBVs were most important for this. In other words, we wanted to know how well we could explain (or predict) the caterpillar performance GEBVs (that is, the expected performance trait values based on plant genetics) from the subset of genetic variants associated with phenotyped plant traits (as captured by the plant trait GEBVs, and thus weighted by their effects on the plant traits). High explanatory (or predictive) power would imply that most of the M. truncatula genetic variants affecting caterpillar performance either had pleiotropic effects on some of the plant traits we measured or were tightly linked to genetic variants that affected these traits. This should also allow us to identify specific plant traits that share a common genetic basis with (and thus potential causal link to) caterpillar performance. We used two complementary approaches to answer this question: (i) multiple regression with Bayesian model averaging, and (ii) random forest regression. A key distinction between these methods is whether they assume linear (multiple regression) or non-linear (random forest regression) relationships between predictors and response variables. Note that for each plant and caterpillar trait, there was a single GEBV estimate per plant line, and thus the sample size for these analyses was N = 94 plant lines.
We used multiple regression with Bayesian model averaging to identify the subset of predictors (plant GEBVs) that best explained variation in caterpillar performance GEBVs, while accounting for uncertainty in the effects of each covariate including which covariates have non-zero effects. The multiple regression models were fit with the BMS R package (package version 0.3.4, R version 3.4.2; Zeugner & Feldkircher, 2015). Zellner’s g-prior was used for the regression coefficients with g = N, where N is the number of observations (N = 94; Zellner, 1986), and a uniform prior was used for the different models (i.e., sets of covariates with non-zero effects; Zeugner & Feldkircher, 2015). Parameter estimates were obtained using MCMC with a 5000 iteration burnin-in and 100,000 sampling iterations, and using the birth-death sampler for exploring model space. We then used 10-fold cross-validation to assess the predictive power of these models (that is, the power of the model to explain observations not used in fitting the model). Predictive power necessarily averages over uncertainty in covariate effects (including which covariates have non-zero effects), and was measured as the Pearson correlation (and squared Pearson correlation) between the observed and predicted caterpillar performance GEBVs. As a simpler metric of explanatory power (not predictive power), we estimated the coefficient of determination (r2) from a standard linear model that included only the subset of predictors (i.e., plant trait GEBVs) with posterior inclusions probabilities (PIPs) greater than 0.5 in the Bayesian model averaging analysis (importantly, here the same data were used to fit the model and assess its explanatory power). This was done with the lm function in R.
The random forest regression algorithm was similarly used to determine the influence of the plant trait GEBVs on the caterpillar performance GEBVs, while allowing for non-linear interactions among variables (Breiman, 2001). Random forest creates multiple regression trees and then outputs the importance of each predictor. The number of trees created was left at the default of 500, after determining that changing the number of trees from this number did not significantly reduce error. The number of variables randomly sampled at each split (mtry) and the number of terminal nodes (nodesize) were chosen to minimize OOB error by manually varying these parameters from one to 20 (all possible combinations were considered). To determine variable importance, the predictor of interest was varied and the percent change mean-squared error (%MSE) in predicting the out-of-bag (OOB) data was determined for each. Those with the greatest effect on %MSE are the most important predictor variables. Random Forest was run using randomForest package (version 4.6-12) in R (Liaw & Wiener, 2002). Random forest regression was run separately with each of the caterpillar performance GEBVs as the response and the GEBVs for plant traits as predictors.
Results
Variation in plant traits and caterpillar performance
We documented substantial phenotypic variation for all 32 traits assayed (e.g., Fig. 1a,c). Phenotypic correlations among traits were evident, particularly among leaf morphology traits (some of which are functions of each other; Fig. 1b) and among some IR chemical traits (Fig. S2). Caterpillar survival rates were initially high, with only nine of the 486 caterpillars (1.9%) dying within the first eight days; the mean survival time was 22.3 days (excluding caterpillars that pupated; Fig. 1d). But most caterpillars failed to pupate (448, or 92.2%), such that high mortality rates were observed between 20 and 30 days of larval development. Of the 38 caterpillars that did pupate, 11 eclosed as adults (29%) (several of the adults were deformed). Mean caterpillar weight at 8 and 16 days were 5.1 mg (s.d. = 2.5 mg, min. = 0.04 mg, max. = 12.9 mg) and 17.7 mg (s.d. = 7.7 mg, min. = 3.02 mg, max. = 82.7 mg), respectively.
The 32 traits exhibited significant among-line variation, with the possible exception of survival to eclosion as adults (Table 2). The proportion of variation among lines ranged from 0.15 (SLA) to 0.59 (plant height) for the plant morphology traits, from 0.09 to 0.36 for the plant IR traits, and from 0.05 (survival to eclosion) to 0.41 (16 day weight) for the caterpillar performance traits (Fig. S3). With the exception of survival to eclosion (restricted likelihood ratio test [RLRT], P = 0.059), the null model of no among-line variance could be confidently rejected for all traits (RLRT, all P < 0.05, most P < 0.001; Table 2).
Genetic architecture of plant and caterpillar traits
The M. truncatula SNP data explained a modest to substantial proportion of trait variation (Table S2, Fig. 2). On average, M. truncatula genetic variation accounted for a greater proportion of the variation in plant morphology traits (mean PVE = 0.40) than in IR traits (mean PVE = 0.17) or caterpillar performance (mean PVE = 0.24; recall that PVE is similar to narrow-sense heritability). However, M. truncatula genetics explained a particularly large amount of the variation in L. melissa caterpillar 16-day weight (PVE = 0.41, 90% equal-tail probability intervals [ETPIs] = 0.34–0.49; this trait also exhibited high among-line variance, Table 2). Estimates of PVE were generally precise, such that the average width of the 90% ETPIs for these parameters (mean across traits) was 0.13 (range = 0.11–0.15). In contrast, our estimates of the number of genetic loci with measurable effects on each trait (n-γ), and of the proportion of the PVE explained by those loci (PGE) were less certain; in particular, the average width of the 90% ETPIs for n-γ and PGE (a proportion) were 153.7 loci and 0.82, respectively (Table S2). Thus, uncertainty in these parameter estimates blurs differences in genetic architectures among traits suggested by the differences in parameter point estimates (compare Fig. 2 with Table S2). Genetic architecture parameter estimates for permuted (randomized) caterpillar performance data differed markedly from those for the actual data, most notably in terms of PVE. Whereas permutations of the survival to eclosion data did sometimes give modest estimates of PVE (the maximum was 0.12, 90% ETPIs = 0.06–0.19), these were still lower than the PVE estimate for the least heritable trait, namely survival to eclosion (PVE = 0.15, 90% ETPIs = 0.09–0.22), and most PVE estimates from permuted data were less than 0.05 (Fig. S4).
Consistent with the high (but uncertain) estimates of n-γ for most traits, many SNPs had small but non-zero posterior inclusion probabilities (PIPs) in the BSLMMs (Fig. S5). In other words, we were better able to detect than confidently isolate and localize the effects of individual genetic loci on the traits. There were a few exceptions to this pattern, most notably plant height and survival to eclosion. For plant height, one SNP each on chromosomes 5 and 7 had very high PIPs, ~ 1.0 (Fig. S6). Two nearby SNPs on chromosome 6 were confidently associated with survival to eclosion, but given the unbalanced design (most caterpillars did not survive to eclosion) and the modest difference between PGE (and to a lesser extent PVE) estimates for this trait and permutations of this trait, we do not interpret or discuss these associations with survival further. We next summarized the genomic distribution of genetic variants affecting each trait by estimating the number of QTL (or QTN) for each trait on each of the eight M. truncatula chromosomes (as in Santure et al., 2015; Lucas et al., 2018). This was done by summing the PIPs across all SNPs on each chromosome, and thus is analogous to the parameter n-γ, except that it is refers to specific chromosomes rather than the whole genome (Guan & Stephens, 2011; Riesch et al., 2017; Lucas et al., 2018). As these chromosomes vary little in size (~35 to 55 megabases), the number of QTL per chromosome should be similar across chromosomes if the traits are highly polygenic. Consistent with this prediction, evidence of putative QTL for most traits was not restricted to specific chromosomes but distributed relatively evenly among chromosomes (Figs. 3, S7).

Heatmap image showing the proportion of QTL estimated for each trait on each of the eight M. truncatula chromosomes. The number of QTL per chromosome was estimated as the sum of the posterior inclusions probabilities across all SNPs on each chromosome. This was then divided by the total (sum) across chromosomes to obtain the proportions. For most traits, the genetic signal (i.e., QTL) were spread uniformly across chromosomes (also see Fig. S5), but for a few traits, especially plant height and survival to eclosion, QTL were clustered on one or a few chromosomes (also see Fig. S6). Note that chromosome 3 is slightly larger than the other chromosomes and thus harbors a slight excess of QTL for most traits. See Fig. S7 for numbers of QTL on each chromosome.
Relationship between plant trait genetics and caterpillar performance
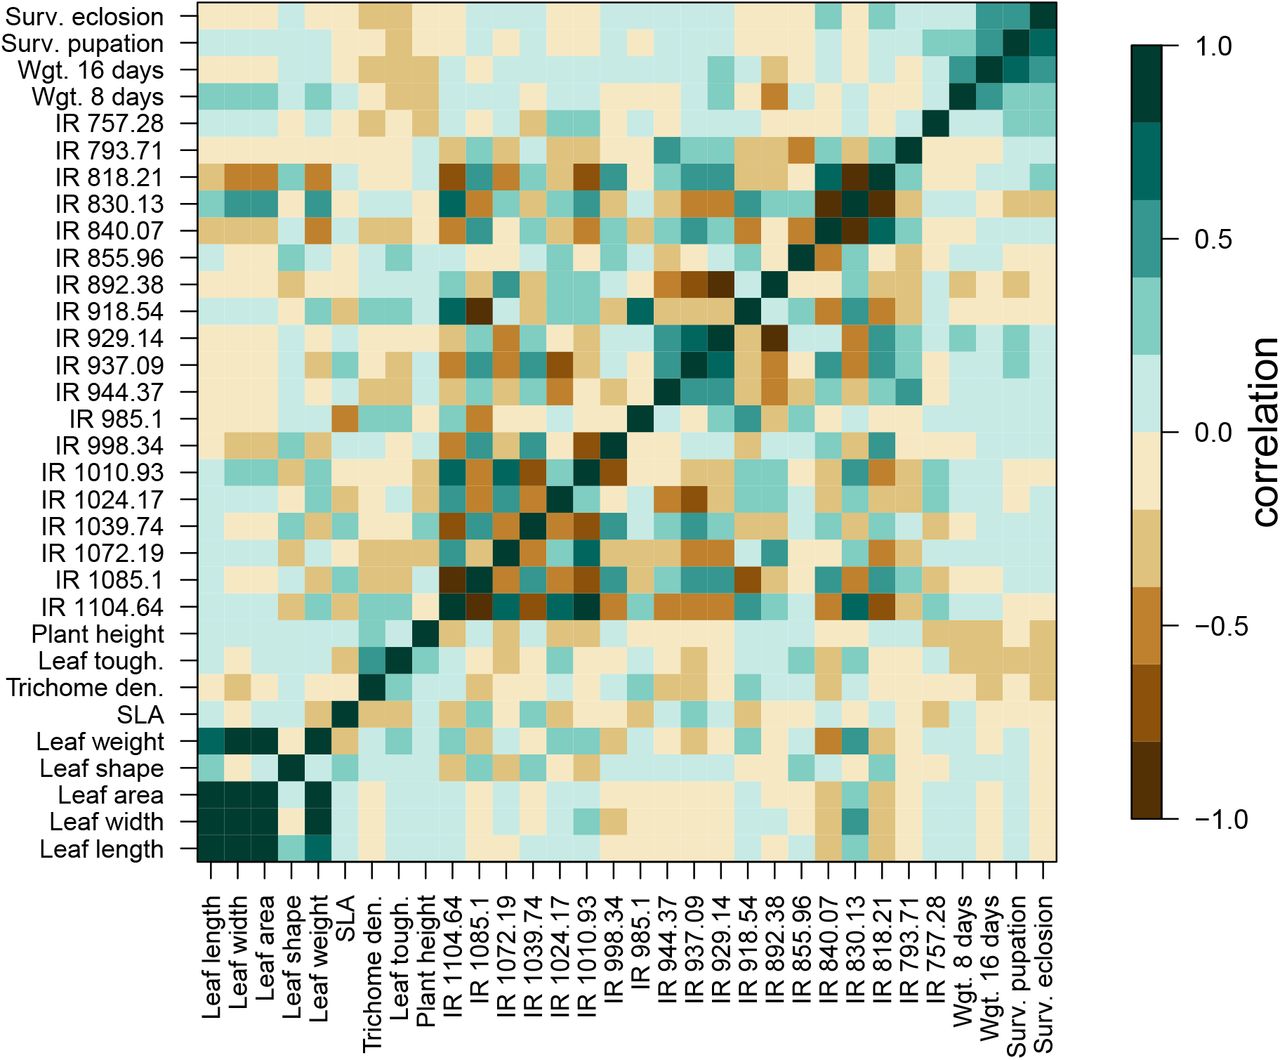
Trait genetic covariances and correlations were high for some pairs or sets of traits (high genetic correlations imply pleiotropy or tight linkage of causal variants; Fig. 4). For example, genetic correlations among leaf length, width, area and dry weight were all r ≥0.8. High, positive genetic correlations were also observed among the caterpillar performance traits, particularly 16-day weight, survival to pupation and survival to eclosion (r = 0.47 to 0.60). Caterpillar performance traits also exhibited non-trivial genetic correlations with several plant traits, most notably with leaf toughness where genetic correlations ranged from −0.25 for 8 day weight (95% confidence intervals [CIs] = −0.43 to −0.05, P = 0.016) to −0.39 for 16 day weight (95% CIs = −0.55 to −0.21, P < 0.001; Fig. 4). Weaker, but still consistently negative genetic correlations were observed between caterpillar performance traits and both trichome density and plant height (Fig. S8). More generally, hierarchical clustering revealed sets or modules of traits with high (positive or negative) genetic correlations, particularly for suites of IR spectra traits (Fig. S9).

Heat map of (additive) genetic (upper triangle) and mean phenotype (lower triangle) Pearson correlation coefficients for pairs of plant and caterpillar traits. Genetic correlations were computed from genomic estimated breeding values (GEBVs) and mean phenotype correlations were computed using the phenotypic means of each trait for each plant line. Genetic and mean phenotype correlations were highly correlated with one another (r = 0.98).
Multiple regression models with Bayesian model averaging had some (albeit modest) predictive power, with correlations between observed and predicted caterpillar performance GEBVs ranging from r = 0.12 for survival to pupation (i.e., r2 = 1.4% of the variation in observed GEBVs explained by predictions) to r = 0.42 for 8-day weight (r2 = 17.6% of the variation in the observed GEBVs explained by predictions; Fig. 5). The most important predictor for 8-day caterpillar weight was IR 892.38, followed by IR 1072.19 (IR traits are labeled by their wavelength in cm−1; Figs. 5, S10). In contrast, leaf toughness was the best predictor of the GEBVs for 16-day weight, survival to pupation and survival to eclosion; higher GEBVs for leaf toughness consistently and credibly predicted lower GEBVs for caterpillar performance metrics. Leaf toughness was the only credible predictor of caterpillar survival (all other traits had PIPs < 0.5), whereas leaf toughness and several IR traits (or more precisely the GEBVs for these traits) had credible effects on 16 day weight GEBVS (i.e., IR 998.34, IR 1104.64 and IR 892.38; Figs. 5, S10). Standard multiple regression models that included the most credible covariates (those with PIP > 0.5; Fig. S10) explained 40.4% (8-day weight; covariates = IR 892.38 and IR 1072.19), 34.9% (16-day weight; covariates = leaf toughness, IR 998.34, IR 1004.64 and IR 892.38), 8.5% (survival to pupation; covariate = leaf toughness) and 12.1% (survival to eclosion; covariate = leaf toughness) of the variation in caterpillar performance GEBVs, with all included covariates having significant effects (all P < 0.01). Thus, models with the most important covariates explained a moderate amount of the variation in caterpillar performance GEBVs, but still less than 50% in all cases.

Barplots showing the effect of the genetic component of plant traits on the genetic component of caterpillar performance, specifically (a) weight at 8 days, (b) weight at 16 days, (c) survival to pupation, and (d) survival to eclosion. Bars denote Bayesian model-averaged estimates (posterior means) of standardized regression coefficients for the effect of the genomic estimated breeding values (GEBVs) for each plant trait on the GEBVs for the caterpillar performance traits. Traits are sorted by the absolute magnitude of these estimates. Vertical bars denote ± one standard deviation of the posterior (analogous to a standard error). Colors distinguish between plant growth and defense traits (green) and IR traits (pink). Pearson correlations between the caterpillar performance GEBVs and estimates of these from 10-fold cross-validation are given in the panel headers (see the main text for corresponding r2 values). See Fig. S10 for covariate posterior inclusion probabilities.
For 8-day caterpillar weight GEBVs, predictions from random forest regression accounted for 31.9% of out-of-bag (OOB) variance (OOB variance measures predictive performance) (mtry = 18, nodesize = 2). The most important predictor variables were IR 892.38, IR 985.1, and plant height (Fig. 6a). For 16-day caterpillar weight GEBVs, random forest explained 14.4% of the OOB variance (mtry = 12, nodesize = 9). The most important predictor variables in this case were leaf toughness, IR 1104.64, and IR 830.13 (Fig. 6b). Only 5.3% of the OOB variance was explained for survival to eclosion, with leaf toughness and IR 830.13 being the most important traits (Fig. 6c). Graphical analyses of the random forest regression results suggested non-linear relationships between GEBVs for many of the top plant and caterpillar traits (Figs. 6d-f, S11 and S12). For example, the effects of IR 892.38 and IR 985.1 on 8-day weight exhibited a strong interaction (a similar pattern held for many of the IR chemical features). In contrast, the effect of leaf toughness on 16-day weight was negative and nearly linear (tougher leaves were associated with lower weights), although there was evidence of an asymptote at higher values of leaf toughness. We failed to explain a non-zero proportion of the OOB variance in caterpillar survival to pupation with random forest regression, and thus results for this trait are not shown.

Summary of random forest analysis for predicting caterpillar GEBVs from plant trait GEBVs. Panels (a-c) show the importance of each covariate (plant trait GEBV), and panels (d-f) depict the relationships between the two most important covariates and GEBVs for caterpillar weight at 8 (d) or 16 (e) days and survival to eclosion (f). Plots in d-f were completed with plotmo (Milborrow, 2018) and illustrate interactions between the top two predictor variables. See Figs. S11 and S12 for additional interactions.
Discussion
Because the world is full of newly-formed host-parasite interactions (including plant-insect interactions involving consumputive herbvory; Nylin et al., 2018), and because most novel host plants are relatively sub-optimal hosts (Yoon & Read, 2016), the results reported here are of interest not only as a step towards understanding the interaction between L. melissa and M. sativa (discussed further below), but also as a more general model for the formation of host-parasite interactions. In addition, genetic dissections of plant-insect interactions are important not only for understanding the complexity underlying the formation and persistence of new associations, but also for understanding the evolution of plant defensive traits and phytochemical diversity in terrestrial ecosytems. In our study, genetic variation within M. truncatula explained a non-trivial proportion of the variation in L. melissa caterpillar performance traits, especially 16-day weight (PVE = 0.41) and survival to pupation (PVE = 0.31). Estimates of the variance in plant and caterpillar traits explained (PVE) by plant genetic variation were similar, meaning the two sets of traits were (on average) similarly heritable with respect to M. truncatula (this suggests these caterpillar performance traits can meaningfully be viewed as extended phenotypes of M. truncatula, sensu Dawkins, 1982; see also, e.g., Whitham et al., 2006).
Genomic estimated breeding values (GEBVs) for caterpillar performance traits were most consistently and strongly associated with GEBVs for leaf toughness, with more modest or idiosyncratic correlations with several IR chemical features (e.g., IR 892.38 and IR 1104.64), trichome density, and plant height. These genetic correlations suggest either that caterpillar performance and several of these plant traits are affected by some of the same segregating genetic variants (i.e., pleiotropy), or that modest to high LD exists among genetic variants affecting the plant traits and caterpillar performance. Such high LD would imply tight linkage among many genetic variants, or some alternative process or mechanism for suppressed recombination among genotypes (this could include low rates of gene flow among the natural source populations from which these lines were derived). However, LD is modest and decays with a few kbs to background levels in this mapping population (i.e., mean LD, measured by r2 drops below 0.2 within 20 kbs; Branca et al., 2011). Interestingly, the additive effects of alleles on the measured plant traits (as captured by the trait GEBVs) were able to explain or account for the additive effects of M. truncatula alleles on caterpillar performance, at least to a modest extent (as expected, explanatory power was lower for cross-validation than in simple linear models). Nonetheless, much of the variation in caterpillar performance GEBVs was not accounted for by the plant trait GEBVs. This implies additional plant traits (and underlying genes) likely contribute to the total variation in caterpillar performance explained by plant genetics. We discuss these results in more detail below.
The genetic architecture of traits associated with a plant-insect interaction
Our results were consistent with standing genetic variation at many loci in M. truncatula for L. melissa caterpillar performance on M. truncatula. Specifically, estimates of PVE from the BSLMMs and REML estimates of the among plant-line genetic variances provide direct evidence of standing polygenic variation in M. truncatula for L. melissa caterpillar performance. Furthermore, results from the BSLMMs suggest multiple QTL for caterpillar performance are dispersed across the eight M. truncatula chromosomes rather than localized in one or a few regions of the genome. A polygenic basis for caterpillar performance (as a plant trait) was also detected in a recent genomic study of Pieris rapae caterpillars reared on Arabidopsis thaliana (Nallu et al., 2018). In this study, Nallu et al. (2018) identified 12 A. thaliana genes associated with variation in P. rapae performance (weight gain over 72 hours), which included CYP79B2, a cytochrome P450 gene known to affect plant resistance to insects. A genome-wide transcriptomic response to herbivory (and even to oviposition) was detected as well.
More generally, genetic variation for resistance to insects has been documented in numerous other plant species, especially crops (Via, 1990; Schoonhoven et al., 2010), although mostly without genome-scale data and without explicit links to plant traits. Still, these studies show that intraspecific variation in plant resistance to insects is often highly heritable, and that it can involve one or many genes (reviewed in Schoonhoven et al., 2010). The same plant species can even exhibit polygenic resistance variation with respect to one insect species and monogenic resistance variation with respect to another (Kennedy & Barbour, 1992). Thus, while our finding of a polygenic architecture is not unexpected given the complex, multifaceted nature of caterpillar performance (Allen et al., 2010; Rockman, 2012), additional genomic studies are needed for a more robust assessment of the prevalence and consistency of this pattern (especially in natural systems).
The full set of plant and caterpillar traits we measured exhibited a range of heritabil-ities, yet, with the possible exception of plant height, we found little evidence of major effect loci. Instead the traits appeared to be controlled by many loci. Genome-wide association mapping methods (and to a lesser extent genomic prediction methods) are known to suffer from a failure to detect many small effect variants (Eichler et al., 2010; Yang et al., 2010), and from overestimating the effects of large effect variants (i.e., the Beavis effect; Beavis, 1998). However, major-effect loci are less likely to be missed. This is true in general as such loci are easier to detect even with small sample sizes, but especially true here given the high-density genome-wide SNP data set we used (>five million SNPs, or about one per 100 bps) and thus the high likelihood of LD between at least one of our SNPs and most causal variants. Moreover, two of the plant traits we analyzed, plant height and trichome density, were independently mapped and analyzed in an earlier study of the M. truncat-ula HapMap mapping population (albeit with a different subset of lines) (Stanton-Geddes et al., 2013). Results from Stanton-Geddes et al. (2013) and our results were remarkably consistent, with, for example, 58% versus 59% (plant height) and 45% versus 49% (trichome density) of the trait variation partitioned among lines in Stanton-Geddes et al. (2013) versus our study, respectively. This is reassuring, particularly given the variability frequently observed in genetic mapping and quantitative genetic results among mapping populations and environments (e.g., Weinig et al., 2002, 2003; Weiss, 2008). However, the use of inbred lines sampled from many localities necessarily distorts the frequencies and possibly average effects of genetic variants on traits, thus our results do not rule out major-effect loci for these traits in natural populations.
Evidence of pleiotropic effects across species, and of variance left unexplained
The estimated genetic correlations are consistent with either pleiotropic effects of M. trun-catula alleles on plant traits and caterpillar performance, or with LD among variants that independently affect subsets of these traits (parsing these two possibilities is very difficult, and at the extreme, very tight linkage can be functionally equivalent to pleiotropy). Leaf toughness, and to a lesser extent, trichome density and plant height, exhibited some of the greatest and most consistent negative genetic correlations with L. melissa performance. Leaf toughness and trichome density constitute structural (physical) plant defenses (Levin, 1973; Schoonhoven et al., 2010), and our results thus support recent calls for greater attention to structural (as opposed to chemical) plant defenses (Hanley et al., 2007; Carmona et al., 2011; Malishev & Sanson, 2015). However, some IR chemical features exhibited high genetic correlations with some or many of the caterpillar performance traits. This is consistent with a role for intraspecific variation in phytochemical defenses in M. truncatula as well, although the IR chemical features could also reflect variation in plant nutritional composition rather than chemical defenses per se. Future work should identify the molecules underlying variation at the leading IR chemical features (e.g., IR 892.38 and IR 1104.64).
Plant trait GEBVs accounted for a moderate amount of the variation in caterpillar weight GEBVs, but relatively little of the variation in caterpillar survival GEBVs. In other words, our results suggest that the alleles affecting the measured plant traits accounted for a greater proportion of the heritable variation in M. truncatula for caterpillar weight than caterpillar survival. Nonetheless, in no cases did the variance explained or predictive power of these models approach 100%. In fact, the highest percent variance explained was 40.8%, and predictive power never exceeded 17.6% for the Bayesian multiple regression or 31.9% for the random forest regression. This means that the effects of M. truncatula alleles on caterpillar performance are not fully accounted for by the effects of these alleles on the measured plant traits. Additional heritable plant traits not measured in this study must affect L. melissa performance, and additional work will be required to identify these. Obvious candidates include defensive phytochemicals or plant nutrients that were not captured by the IR assays. Still, even the modest predictive power of these models allows us to conclude, for example, that the genetic quality of a plant in terms of caterpillar performance can be predicted in part from the additive effects of plant alleles on leaf toughness.
As expected, the plant traits most important in these predictive models tended to be the ones with the largest genetic correlations with caterpillar performance. However, there were a few exceptions that arose because of correlations among the plant trait GEBVs, which rendered a subset of these traits (e.g., trichome density) unimportant in the predictive models. Moreover, the relative ranks of plant traits in terms of their importance (i.e., Bayesian model-averaged effect estimates or percent reduction in MSE) differed between the Bayesian multiple regression models and random forest regression. We think these differences were most evident in cases where random forest regression identified extreme interactions among plant trait GEBVs or non-linear relationships between GEBVs for the plant traits and caterpillar performance (e.g., IR 985.1 on 8-day caterpillar weight), as these would not be captured by the Bayesian multiple regression models.
Conclusions and future directions
We have shown that plant genetic variation can have a substantial effect on the outcome of a plant-insect interaction, specifically on whether L. melissa caterpillars can develop successfully on M. truncatula. Genetic variation among M. truncatula plants explained about as much of the variance in caterpillar performance in the current study (9-41%) as genetic variation among L. melissa caterpillars did in an earlier rearing experiment on M. sativa (7-57%) (Gompert et al., 2015). This suggests that caterpillar and plant genetic variation combined could explain a large proportion (i.e., over half) of the variation in larval performance, which is necessarily a key aspect of the interaction between plants and herbivorous insects. However, M. truncatula and M. sativa are not identical, and it remains to be seen whether similar levels of genetic variation for performance exist in this actual (rather than potential) L. melissa host plant. Moreover, gene by gene epistatic interactions between L. melissa alleles and M. sativa (or M. truncatula) alleles could modulate the total variance in performance explained for the pair of species (in other words, the trait heritabilities with respect to plant and insect genes are not necessarily additive).
Ultimately, we want to accurately predict the mosaic patterns of host use and host adaption in L. melissa from a mechanistic understanding of the factors affecting host use. We have reasons to be both optimistic and pessimistic about this aim. Past work on L. melissa has shown that genetic variants associated with performance in the lab covary significantly with host use in nature (Gompert et al., 2015; Chaturvedi et al., 2018). Thus, genetic variants affecting performance in the lab appear to also be associated with host-plant adaptation in nature. On the other hand, the lab environment is necessarily simplified and lacks interactions with predators, competitors and mutualists that could be important determinants of host use in the wild. For example, survival of L. melissa caterpillars on M. sativa in a field experiment depended on the presence of ants that defend the caterpillars from predators (this is a facultative relationship where the ants receive a sugar reward from the caterpillars; Forister et al., 2011). Even ignoring such complexities, the relevance of genetic and trait variation in M. truncatula for understanding genetic and trait variation in M. sativa is not certain. Leaf toughness, which was most strongly associated with performance in the current experiment, exhibits a similar range of variation in M. sativa and M. truncatula (albeit with somewhat tougher leaves in M. sativa on average; Harrison et al., 2018). This suggests variation in leaf toughness in M. sativa could have a similar affect on caterpillar performance. In the end, we may fail to generate reliable predictions about host use in nature from simple lab experiments, but nonetheless might advance scientific understanding of the importance of intraspecific variation for the evolution and ecology of plant-insect interactions by gaining a better understanding of how and why these predictions fail.
Data Accessibility
All original data and scripts will be deposited on Dryad.
Author Contributions
ZG, LKL and MB designed the study. ZG, LKL, MB, FZ, CP, MJT and MLF conducted the experiment. ZG, FC, CP and TS analyzed the data. ZG, CP and TS wrote the manuscript. All authors revised and edited the manuscript.
Acknowledgments
We thank Shaylen Fidel, Camden Treat, Marissa Kee and Kenneth Tache for their help with the caterpillar rearing experiment, and Marianne Harris for use of greenhouse space and help caring for the plants. Chris Nice, James Fordyce, Alex Buerkle and Amy Springer provided valuable comments on an earlier draft of this manuscript. This research was funded by the National Science Foundation (DEB-1638768 to ZG and DEB-1638793 to MLF), and by the Utah Agricultural Experiment Station (paper no. XXX). The support and resources from the Center for High Performance Computing at the University of Utah are also gratefully acknowledged.
References


