

Abstract
The uneven distribution of species in the tree of life is rooted in unequal speciation and extinction among groups. Yet the causes of differential diversification are little known despite their relevance for sustaining biodiversity into the future. Here we investigate rates of species diversification across extant Mammalia, a compelling system that includes our own closest relatives. We develop a new phylogeny of nearly all ~6000 species using a 31-gene supermatrix and fossil node- and tip-dating approaches to establish a robust evolutionary timescale for mammals. Our findings link the causes of uneven modern species richness with ecologically-driven variation in diversification rates, including 24 detected rate shifts. Speciation rates are a stronger predictor of among-clade richness than clade age, countering claims of clock-like speciation in large phylogenies. Surprisingly, rate heterogeneity in recent radiations shows limited association with latitude, despite the well-known richness increase toward the equator. Instead, we find a deeper-time association where clades of high-latitude species have the highest speciation rates, suggesting that species durations are shorter outside than inside the tropics. At shallower timescales (i.e., young clades), diurnality and low vagility are both linked to greater speciation rates and extant richness. High turnover among small-ranged allopatric species may erase the signal of vagility in older clades, while diurnality may adaptively reduce competition and extinction. These findings highlight the underappreciated joint roles of ephemeral (turnover-based) and adaptive (persistence-based) diversification processes, which manifest as speciation gradients in recent and more ancient radiations to explain the evolution of mammal diversity.
Significance statement The over 6000 living species in the mammalian tree of life are distributed unevenly among branches so that similarly aged groups sometimes differ many fold in species richness (e.g., ~2500 rodent species versus 8 pangolins). Why differential bursts of species diversification occur, and how long they persist, has implications for sustaining biodiversity. Here we develop a robust evolutionary timescale for most extant species, recovering signatures of rate-variable diversification linked to ecological factors. Mammals with low dispersal or that are day-active show the fastest recent diversification, consistent with mechanisms of allopatric speciation and ecological opportunity, respectively. Speciation rates are surprisingly faster in extra-tropical than tropical lineages, suggesting that longer species durations for tropical lineages underpin the latitudinal diversity gradient in mammals.
Introduction
Branches in the mammal tree of life range from mega-diverse rodents and bats to similarly old, yet species-poor, groups like treeshrews and pangolins (stem ages all ~60-70 million years ago [Ma]). Questioning why some evolutionary groups are more speciose than others traces to the classic ‘hollow curve’ observation of Willis (1), which was formalized for phylogenetic tree shape as unevenness (or imbalance) (2). Uneven species richness implies uneven net diversification (speciation – extinction), but whether speciose clades usually derive from faster rates or older ages is controversial (2–4). Similarly debated are the causal roles of environmental factors (3, 5–7) or intrinsic traits of species (8, 9) as determinants of rate-variable diversification. Recently, analytical advances in identifying macroevolutionary rate regimes (10) and species-level rate variation at the instantaneous present (e.g., the tip DR metric (11, 12)) have uncovered gradients of higher speciation rates with latitude (13–15) and elevation (7). Ephemeral speciation processes (16) appear to underlie these dynamics, where unstable environments produce many short-lived species via high turnover (speciation + extinction). In contrast, adaptive processes that involve accessing novel ecospace are expected to decrease extinction rates (6, 17, 18), so that species accumulate via persistence rather than turnover. If nascent allopatric species form regularly (19), then identifying which factors cause them to persist or go extinct (e.g., habitat seasonality, dispersal ability, niche adaptations; (7, 13, 14, 16, 19–21)) is central to understanding why evolutionary tree shapes and geographic diversity are uneven. The challenge to reconstructing species birth and death across Mammalia is that a robust evolutionary timescale is required for among-clade tests of rate variation to be meaningful.
Until now, the species-level phylogenies of mammals have been inadequate for the task of understanding macroevolutionary tree shape. Parsimony supertrees (22) were first implemented on large scales across Mammalia (Bininda-Emonds et al. (23) and its updates (24, 25)). However, supertree methods add artifacts of short branch lengths when merged source trees disagree (e.g., >50% of nodes in Bininda-Emonds et al. (23)), and are thus biased toward inferences of rapid radiation at regions of the tree with the greatest phylogenetic uncertainty. For example, a series of polytomies in rodents and bats were inferred as an ~30-Ma pulse of tree-wide diversification ((26); SI Appendix, Fig. S14 for a comparison of tree shapes). Despite this issue, supertrees continue to be a popular choice for large-scale phylogenetic inference and tests of diversification rate hypotheses (e.g., 27, 28). Herein, we abandon the supertree paradigm, using instead a single DNA supermatrix to improve upon the Bayesian backbone-and-patch approach developed in birds (11), squamates (29), and amphibians (30).
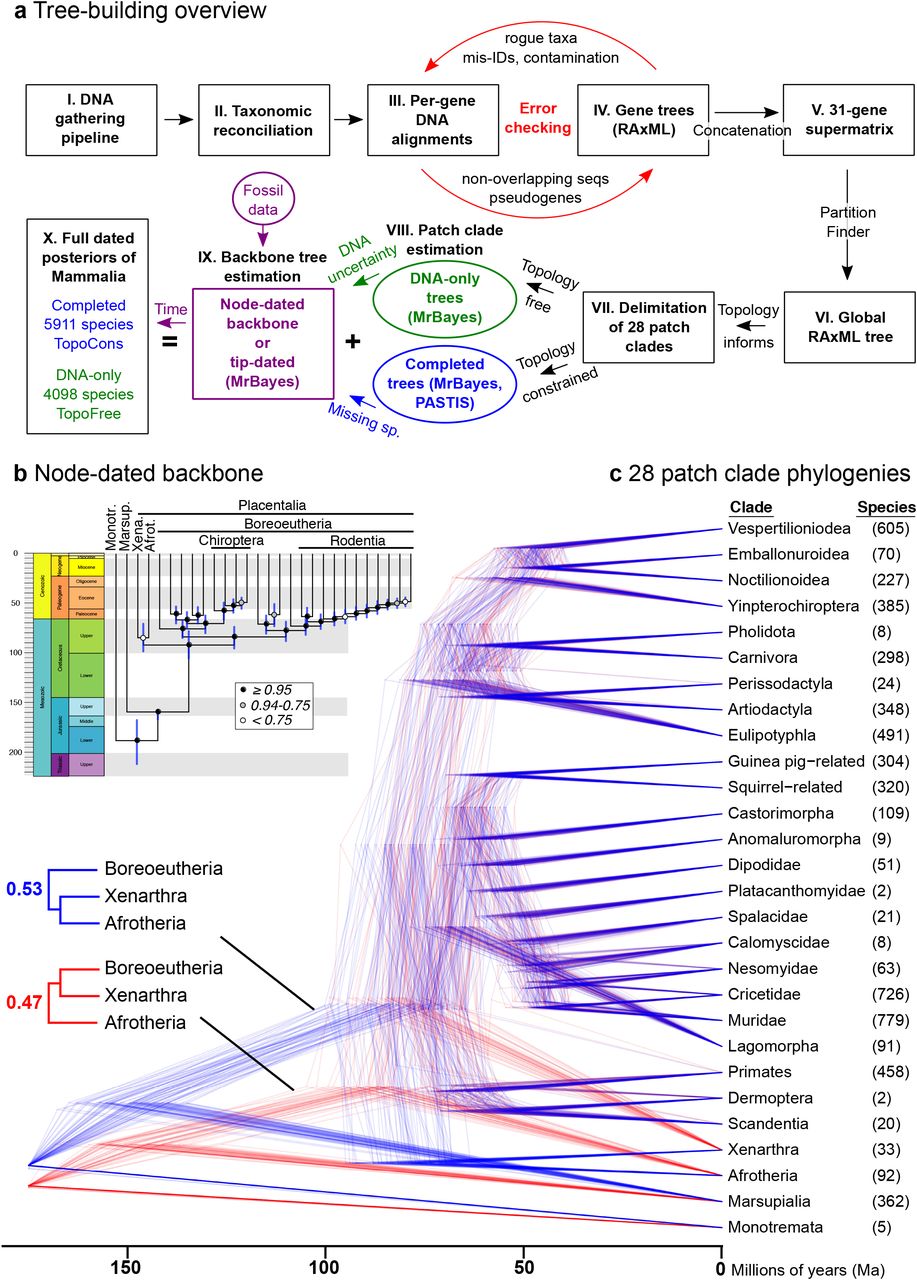
Our mammal tree (Fig. 1) includes 5,804 extant and 107 recently extinct species in a posterior distribution of 10,000 trees, integrates age and topological uncertainty, and incorporates 1,813 DNA-lacking species using probabilistic constraints. It thereby offers a species-level phylogeny with all branches estimated under a unified birth-death model (available at vertlife.org). Trees are built using: (i) an updated taxonomy; (ii) a newly assembled 31-gene supermatrix; and (iii) the backbone-and-patch framework, which estimates the phylogenies of 28 mammal subclades (identified in a global DNA tree) with relative branch lengths, re-scales the branches to corresponding divergence times in fossil-calibrated backbones, and grafts each subclade to the backbone (Fig. 2; Methods, SI Appendix, Datasets S1-S6). We developed four posterior sets of Mammalia-wide trees based on node- or tip-dated backbones (31, 32) and the inclusion or exclusion of DNA-lacking species. Analyzing samples of trees from each set yields some variation in node ages, but consistent results across all comparative analyses (SI Appendix, Fig. S9-11, S21-S22).
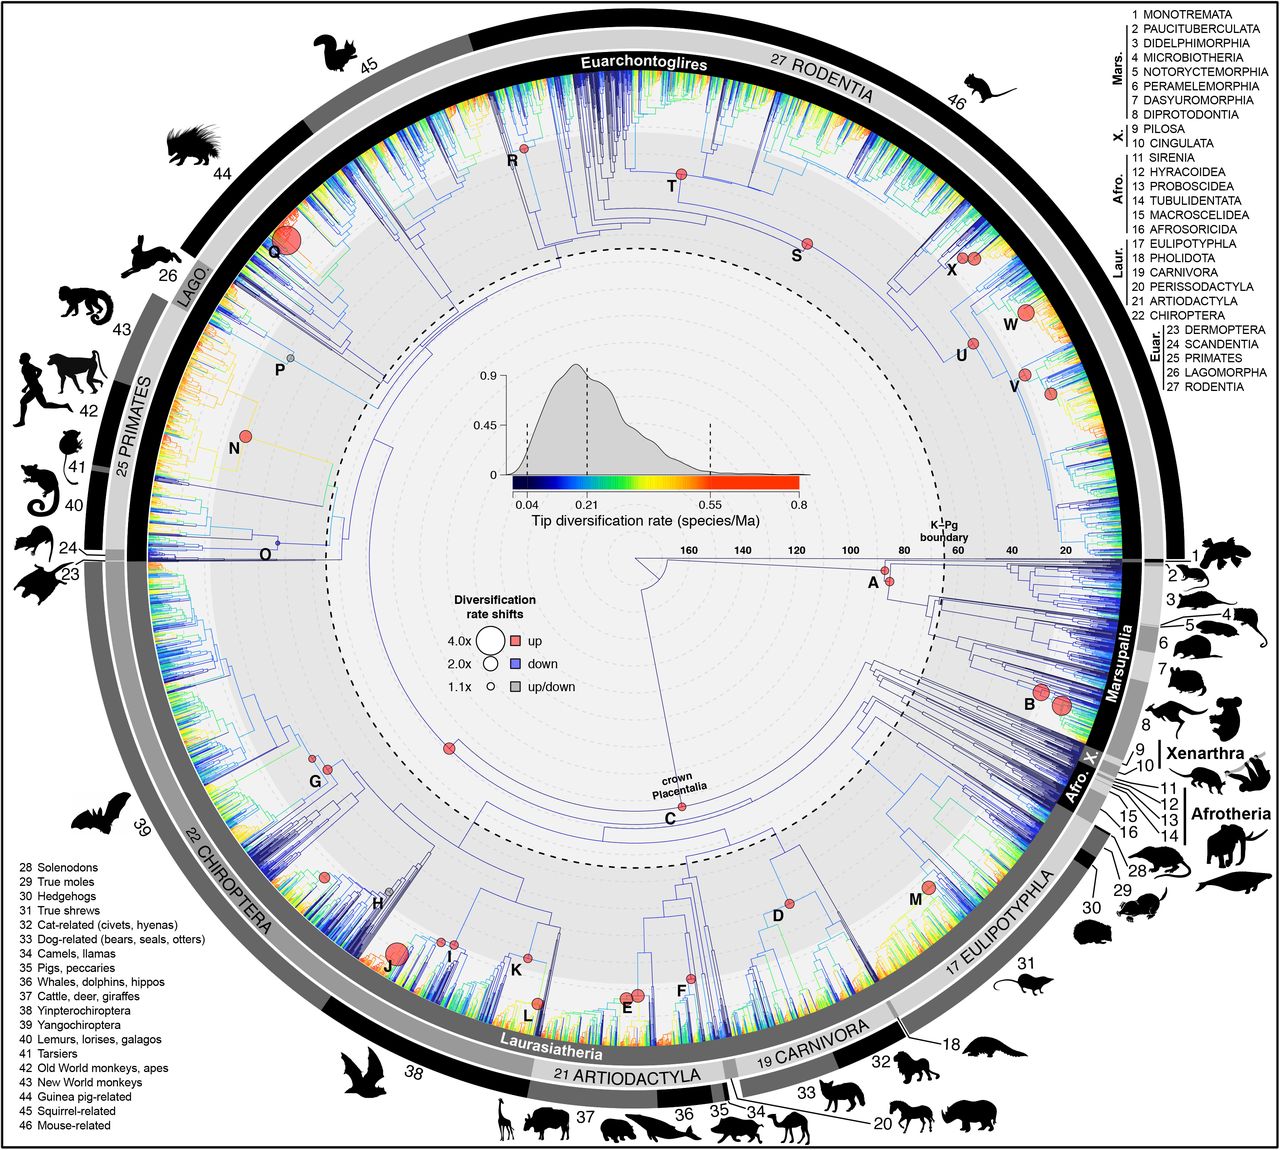
The node-dated analysis of 5911 species shows branches colored with tip-level diversification rates (tip DR) and marked with 24 shifts in lineage diversification rates (labels A-X; shifts with multiple circles occurred on either branch, not both; all shifts were detected in ≥ 5 of 10 trees analyzed in BAMM (43)). Maximum clade credibility topology of 10,000 trees. Numbered clade labels correspond to orders and subclades listed in the plot periphery: Mars, Marsupialia; X, Xenarthra; Afro, Afrotheria; Laur, Laurasiatheria; Euar, Euarchontoglires. Scale in millions of years, Ma.

(a) Schematic overview of DNA sequence gathering from NCBI, taxonomic matchup, iterative error checking, and estimating a global maximum-likelihood (ML) tree from the resulting supermatrix (31 genes by 4098 species (64)). Subclade (patch) phylogenies were then delimited, estimated using Bayesian inference (67), and joined to fossil-calibrated backbone trees (node- or tip-dated). The resulting posterior samples of 10,000 fully dated phylogenies either had the global ML tree topology constrained (completed trees of 5911 species, ‘TopoCons’) or no topology constraints (DNA-only trees, ‘TopoFree’). (b) Backbone trees contained topological and age uncertainty, including the unresolved base of Placentalia (e.g., (35)), slightly favoring the Atlantogenata hypothesis (blue) versus Exafroplacentalia (red). (c) Bayesian phylogenies of 28 patch clades were separately estimated in relative-time units for re-scaling to representative divergence times on the backbone. Combining sets of backbones and patch clades yielded four posterior distributions for analysis (see SI Appendix, Fig. S9-12).
Here we use this novel phylogenetic framework to investigate the potential extrinsic and intrinsic causes of uneven diversification in mammals, including whether evolutionary rate processes are recorded differently in recent radiations vs. older clades where extinction is more likely to have pruned lineages from trees of extant species (33, 34).
Results and Discussion
Tree-wide and among-clade tempo of lineage diversification
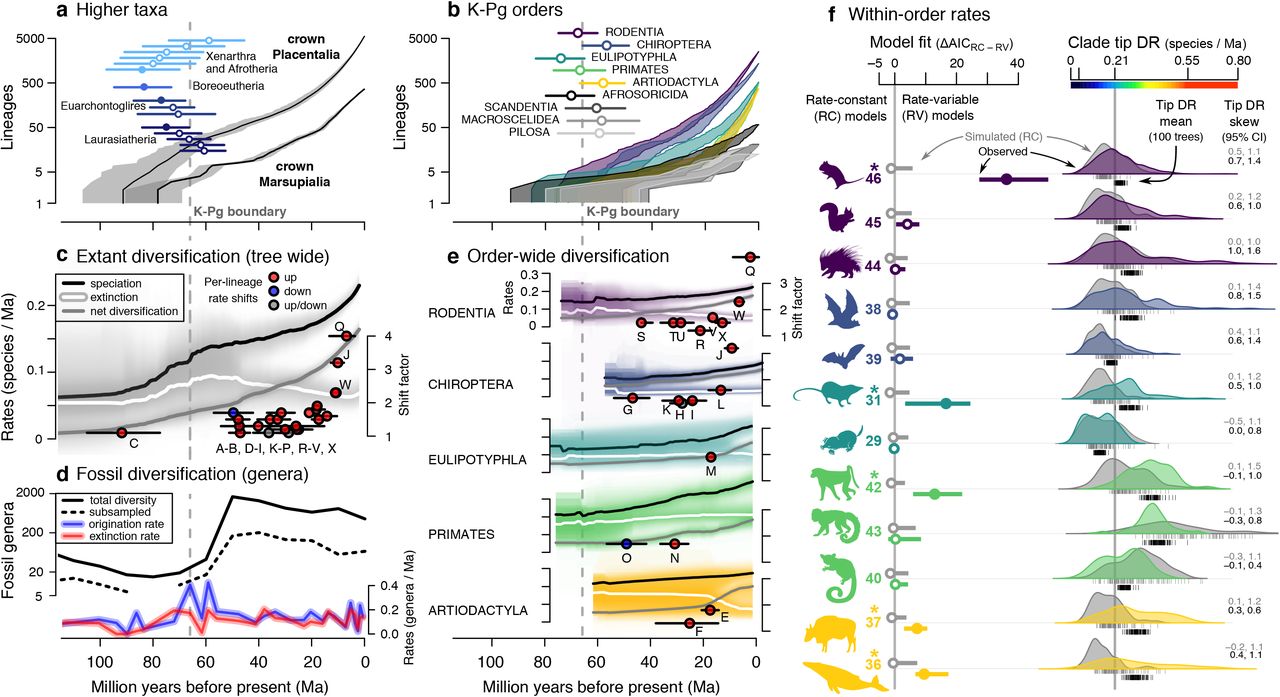
The absolute and relative timings of mammal diversification are debated (23, 35), with particular controversies around whether early placentals diverged before, after, or during the Cretaceous-Paleogene (K-Pg) mass extinction event, 66 Ma (short fuse, long fuse, or explosive models, respectively (36)). We estimate the age of crown Placentalia at 92 Ma (95% confidence interval [CI] of 77, 105 using node-dating; tip-dating yielded mostly similar results, SI Appendix, Fig. S9). The first four placental divergences unambiguously preceded the K-Pg (Fig. 3a; filled circles), followed by the next 21 divergences with CIs that overlap the K-Pg (Fig. 3a–b). We find a Cretaceous “fuse” of ~25-Ma between the radiation of crown Placentalia and nine of 18 crown orders (SI Appendix, Table S6), in line with some estimates (35, 37), but longer than others (e.g., (23)). The burst of tree-wide lineage turnover we recover near the K-Pg (visual anomalies in speciation and extinction rates; Fig. 3c) is remarkable for matching concurrent fossil evidence for pulses of origination and extinction (36, 38, 39) (Fig. 3d). Despite spatiotemporal biases in fossil preservation (40, 41) and extant phylogeny reconstruction (33), corroboration between these genetic and fossil data suggests they reflect genuine dynamics in mammalian evolution (42).

Lineage-through-time plots and estimated crown ages for (a) all superordinal divergences, and (b) placental orders with crown age estimates overlapping the Cretaceous-Paleogene extinction event (K-Pg, dashed gray line; means and 95% CIs; filled circle if statistically different). (c) Rate-through-time plots for speciation, extinction, and net diversification (summarized from Fig. 1 rate shifts; medians from 10 trees, 95% CIs in light gray). (d) Fossil genus diversity through time for all Mammalia, including subsampled genus richness (quorum 0.5) and per-capita rates of genus origination and extinction. (e) Extant rates and lineage-specific rate shifts for the five most speciose mammal orders (same symbols as in c). (f) Rate variation within subclades of these five orders as numbered from Fig. 1; left: difference in AIC between best-fit models of diversification for trees simulated under rate-constant birth-death (gray) versus observed mammal trees (color; filled circle and * if ΔAIC on 100 trees is statistically different); and, right: tip DR distributions of the same simulated and observed subclades (gray versus color, one tree), comparing variation in tip DR mean and skew across 100 trees. The last 2 Ma are removed from parts c-e for clarity.
We recover at least 24 lineage-specific shifts in net diversification rates (Fig. 1, 3c, e; SI Appendix, Table S8), the earliest of which occurs in either crown Placentalia (1.1x higher than the Mammalia-wide median rate of 0.138 species/lineage/Ma) or Boreoeutheria (1.6x, node C in Fig. 1). These shifts involve 18 different lineages and are all positive, except a rate decrease uncovered for the primate clade of lemurs, lorises, and galagos (Strepsirrhini; node O). The two largest rate increases (4.0x and 3.2x) occurred in the last 10 Ma: the gopher-like tuco-tucos of South America (Ctenomys, node Q), and the Indo-Pacific flying foxes (Pteropus, node J). Overall, rate increases near the present tend to be particularly high, with a 2.2x mean in the Miocene versus 1.3x in each the Oligocene and Eocene (Fig. 3c; df=2, F=7.772, P=0.003), which corroborates the expectation for extinctions deeper in the tree (e.g., (38)) to have reduced our ability to detect more ancient shifts (33, 43). Different to the explosive model (36), no lineage-specific rate shifts implicate the K-Pg in promoting radiations, either preceding the event (Placentalia) or occurring later (Fig. 3c, e). Notably, we record the highest probability of tree-wide rate increases ~15 Ma (SI Appendix, Fig. S15c and d), in contrast to previous results for rate decreases ~8 and ~3 Ma in mammals (23, 26).
Within-clade tempo of lineage diversification
The timings of radiation we recover emphasize that the majority of mammalian diversification in extant lineages occurred during the last ~50 Ma (Fig. 1, 3). Environmental changes during this period are posited to have broadly changed the biosphere (3, 44), with potential imprints on phylogenies as temporal variation in diversification rates (4–6, 42). We predicted that species-rich clades would display stronger signatures than depauperate clades of rate-variable (RV) diversification if RV processes were predominant, since the likelihood of rare events (within-clade shifts in speciation or extinction) and our statistical power to detect them should increase with clade size. We find that models of RV diversification (42) were favored over rate-constant (RC) models (33) for five out of 12 placental subclades tested (Fig. 3f; SI Appendix, Table S9). The strongest RV signal is in the speciose mouse-related clade of rodents, along with shrews and catarrhine primates and matching observed rate shifts (clades 46, 31, and 42; Fig 1, 3e–f). The cow- and whale-related clades of artiodactyls also have strong RV signatures (Fig. 3e), concordant with previous suggestions (e.g., (42, 43)).
As an additional, more sensitive, test we use clade-wide distributions of tip-level (i.e., species’) diversification rates (tip DR (11)) to capture the within-clade rate heterogeneity arising from RV processes (Fig. 3f). We find the overall-highest tip DRs in simian primates (clades 42–43), including the human genus Homo (80th percentile, median 0.321 species/lineage/Ma; H. sapiens and three extinct species) and Indomalayan lutung monkeys (95th percentile, 0.419, Trachypithecus), while the distinctive aardvark and platypus have the lowest tip DRs (clades 1, 14; Fig. 1). Broadly, we recognize substantial heterogeneity in tip DR across the mammal tree, sometimes with a few high-tip-DR species nested together with low-tip-DR species (Fig. 1), resulting in long right-side tails in the tip DR distributions (positive skew, e.g., clades 38 and 44 in Fig. 1, 3f). We find that tip DR skew measures aspects of within-clade rate variation otherwise uncaptured by birth-death models (SI Appendix, Table S10).
Time and ecology relative to clade species richness
The relative importance of clade ages (time) versus rates of speciation and extinction (whether stochastic or ecologically driven) as an explanation of extant diversity levels is a matter of intense debate in mammals (5, 6, 45, 8) and other taxa (19, 46, 28, 47). Past efforts to separate these hypotheses have focused on named clades (e.g., (4)), which are biased by subjective delineation and often vast age differences (mammal families range 3.8–59.0 Ma in mean crown ages; SI Appendix, Dataset S7). To avoid this bias, we sliced phylogenies at five-million-year intervals and took the tipward clades as objective units for analysis (Fig. 4a; SI Appendix, Fig. S5). Time-sliced clades thus account for the ‘pull of the present’ in modern trees (48) by analyzing successive levels of rootward covariance among clade crown age, species richness, tip DR mean and skew, and mean ecological traits. If time-constant rates predominate (28, 46, 49), crown ages will explain most of the among-clade variation in species richness. In contrast, if rate variation is strong, as we already recognized for some nodes and named clades (Fig. 3) and expect from varying ecological regimes (2, 5, 6, 19), diversification rates will have the greater explanatory power.

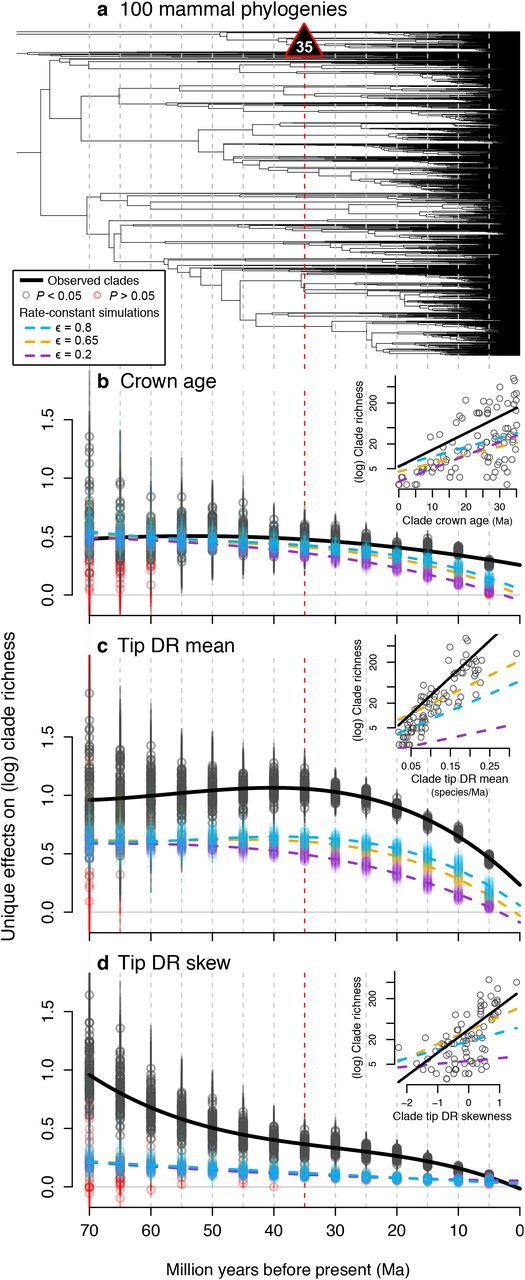
(a) The log species richness of clades tipward of each 5-Ma time slice (dotted lines from 5-70 Ma) across a sample of 100 phylogenies (maximum clade credibility tree shown) is best predicted jointly by (b) clade crown age, (c) clade tip DR mean, and (d) clade tip DR skew. Multivariate phylogenetic analyses of clade richness in observed trees (gray) is compared to trees simulated under rate-constant birth and death with different extinction fractions, ε (colors in legend; PGLS on standardized data with 95% confidence intervals [CIs] on parameter estimates). Solid black lines are the observed best-fitting models given random effects of time slice and tree. Insets (b to d) are examples from 35-Ma clades (red line) showing the bivariate plots underlying each multivariate PGLS slope per tree and time slice.
We find that clade age and richness are positively correlated—yet significantly less so than the unique effects of tip DR mean and skew on richness (Fig. 4, multivariate PGLS; SI Appendix, Fig. S18 for univariate and taxon-based results). Critically, clade tip DR mean has stronger effects on richness than expected from simulated RC trees containing only stochastic rate variation (Fig. 4c). Clade tip DR skew is also significant, especially so at deeper time slices (Fig. 4d), confirming that single speed-ups in diversification within a clade (e.g., due to ecological opportunity for one lineage (6, 17)) can drive much of its overall species richness today. These analyses support arguments that ecology is a greater macroevolutionary force than time (47), yet obviously both contribute to richness (adjusted-R2: 0.88 full model versus 0.26 with crown age only, means of 100-tree PGLS among 35-Ma clades). Jointly analyzing richness determinants in time-sliced clades offers an objective way to assess age and rate effects that, in turn, enables tests for ecological drivers of rate variation.
Linking ecology to uneven diversification and richness
Vagility, latitude, and diurnality are among the key purported causes of variation in mammalian species richness (3, 5, 6, 50). Species vagility, through its effect on gene-flow patterns (19, 51), has been posited as inversely related to the probability and scale of geographic isolation, and hence allopatric speciation (21, 52). We performed phylogenetic path analysis (53) to assess the indirect effects of these ecological factors on mammalian richness via their impact on the joint, yet unequal, contributions of rates and ages to extant species numbers (Fig. 5, Methods, SI Appendix, Fig. S8). Here, the time-sliced clades allow us to distinguish trait-rate dynamics that are localized near the species level (if traits drive ephemeral speciation (16) or if they evolved very recently) from those that occur deeper in the tree and persist (if traits evolved anciently and did not affect extinction rates). We find that at the species level, and especially in herbivores and carnivores, low-vagility mammals have higher tip DRs (Fig. 5a; ecological trait ~ rate PGLS (8)). Effects of vagility on clade tip DR mean are weakened toward deeper time slices, where they are instead recorded on tip DR skew (Fig. 5b). We interpret these short-lived effects of vagility on tip DR mean as consistent with expectations that nascent allospecies are produced at a high rate, but are ephemeral, going extinct before their peripheral isolate can expand (16, 19, 52). While the nearly 20% of mammal species endemic to islands complicates our allometric estimate of species vagility (Fig. S9), we note that the ~10-million-year ‘threshold’ whereby low-vagility lineages find an adaptive zone, evolve greater vagility, or vanish is robust to multiple sensitivity tests (SI Appendix, Fig. S21-S22). The influence of vagility on diversification, however, might not be linear (e.g., humped (19) or sigmoidal (21)).

(a, top panel) Distribution of species-level diversification rates (tip DR, mean of 10,000 trees) relative to per-species estimates of vagility (maximum natal dispersal distance), diurnality (0=nocturnal or cathemeral, 1=diurnal), and absolute value of latitude (centroid of expert maps) across 5,675 species (excluding extinct and marine species). Loess smoothing lines visualize general trends (blue, span=0.33). Species-level effects (bottom panel) from univariate PGLS between tip DR and ecological traits subset across trophic levels (1000 trees, 95% CI, colored if significant). (b) Phylogenetic path analysis (53) of putative causal relationships between traits and rates leading to clade species richness for time-sliced clades. Path thickness, color, and directionality denote median coefficients of model-averaged analyses. The bottom panels provide per-estimate uncertainty across time slices (slope ± SE, 1000 trees). Non-zero estimates, either positive (blue shades) or negative (red shades), are totaled in the right margin; paths present in >500 trees are bolded and displayed in path model whereas others are dashed.
Latitude, through strong covariation with environmental conditions and species richness, is considered to represent key mechanisms behind cross-taxon disparities in richness (3, 13). But recent evidence casts doubt on this presumed negative association between latitude and diversification rates (11, 13, 14). Here we find that there is no effect of absolute latitude on tip DR at the species level (Fig. 5a). Instead, strong positive associations with latitude arise at deeper time slices, but without corresponding effects on skew (Fig. 5b). Similarly weak latitude-to-rate effects in young clades and species of birds (11, 13, 14) appear to emphasize the impact on species turnover cycles of temperate climatic instability, seasonality, and expansion of new habitats. We suggest that the traditionally invoked tropical ‘cradle’ (higher speciation) and ‘museum’ (lower extinction (3)) should re-focus upon the turnover ratio of those processes, testing whether extratropical species are ‘cycled’ faster than tropical species and, if so, relative to which biogeographic processes. Extratropical lineages may not cycle fully, but instead persist through climatic oscillations in glacial refugia (54). The Eocene-Oligocene transition (~34 Ma) from tropical to temperate habitats (3) would then have initiated converse latitudinal gradients in species turnover and richness, although North American mammal fossils suggests a steeper richness gradient beginning ~15 Ma (55).
Diurnality is a core behavioral-physiological trait tied to temporal niche innovation (50) and the associated potential for adaptive diversification. We find that repeated origins of daytime activity since the late Eocene (~35 Ma (50, 56)) are associated with faster species diversification, both at the present (Fig. 5a) and among 10-Ma time-sliced clades (Fig. 4b). Lineage-specific rate increases also reflect signatures of greater diurnal activity on diversification (SI Appendix, Fig. S17a). These results affirm the importance of diurnality (56) in the context of other drivers of rate variation (vagility and latitude), placing previous findings of rapid diversification in diurnal lineages of primates (57) in a broader context. Results for 30- and 50-Ma clades appear to be confounded with nocturnal ancestors, including inverse effects on tip DR skew (Fig. 5b), which is consistent with diurnality evolving well after a “nocturnal bottleneck” among K-Pg-surviving mammals (50). In contrast to vagility and latitude, we posit that greater daytime activity is an example where adaptive divergence in niche traits has decreased extinction rates via competitive release (17), and therefore led to greater persistence and species richness in diurnal lineages.
Conclusions
Our novel, time-calibrated phylogenetic framework addressing all extant and described species of mammals puts a focus on ecological drivers of diversification. Rate-shifted clades have disparate ecological characteristics (SI Appendix, Fig. S17e), suggesting that lineage-specific events have fostered mammalian radiations. Nevertheless, we detect cross-clade signatures of intrinsic (vagility, activity pattern) and extrinsic (latitude) factors driving aspects of diversification at nested phylogenetic levels. We hypothesize that two main processes are at work. First, turnover-mediated diversification is acting on short timescales due to geographic isolation among low-vagility species, and on longer timescales due to the dynamics of extratropical climates. Second, persistence-mediated diversification is demonstrated for diurnal lineages and related more generally to adaptations (or stable habitats) resulting in lower extinction rates. Traversing between these processes may be possible if otherwise ephemeral allospecies can enter novel regions of the phenotype-to-environment landscape, either via niche evolution or extrinsic opportunity (6, 16, 17, 52), to then continue diversifying with lower extinction risk. Overall, we show that ecological factors are influencing diversification rates, but the effects manifest at different hierarchical levels of the tree of extant mammals. Geologically recent processes associated with species turnover or adaptation are not yet studied for most of life, but our results in mammals suggest that gradients in these novelty-originating processes have ecological causes relevant to the capacity for future biodiversification.
Methods
Building new species-level trees for extant Mammalia – Overview
We reconstructed the evolutionary history of extant Mammalia aiming to maximize the accuracy and comparability of temporal information (branch lengths) across lineages in a posterior set of time-calibrated phylogenies. Trees were built using a multi-step strategy (Fig. 2) designed to: (i) sample and vet available DNA sequences for extant and recently extinct species into a 31-gene supermatrix; (ii) use an updated taxonomy accounting for 367 new species and 76 genus transfers (5,911 total species; SI Appendix, Table S2 and Dataset S2); (iii) estimate a global maximum likelihood (ML) tree for 4,098 species in the DNA supermatrix to inform taxonomic constraints (SI Appendix, Dataset S3); (iv) include species unsampled for DNA within the Bayesian phylogenetic analyses (PASTIS completion (58)); and (v) integrate fossil data at nodes and tips to compare methods of calibrating backbone divergence times in mammals. We modified the backbone-and-patch analysis framework (11) to estimate the relative-time phylogenies of 28 non-overlapping subclades of mammals, called “patches” (identified in the global ML tree; Table S5 and Dataset S3). We then re-scaled branches to corresponding divergence times in fossil-calibrated backbones, and grafted the subclade patches to backbones to form Mammalia-wide trees (SI Appendix, Fig. S1-S3). We compared trees built using node-dated backbones (17 fossil calibrations (31)) and tip-dated backbones (matrix of modern and Mesozoic mammals (32)), which yielded broadly similar ages (SI Appendix, Fig. S9-S11). Strict topology constraints from the global ML tree were used in the 10,000 taxonomically completed trees (5911 species, ‘TopoCons’) while the DNA-only trees were estimated without topology constraints (4098 species, ‘TopoFree’).
DNA gathering pipeline
We used the BLAST algorithm (Basic Local Alignment Search Tool (59)) to efficiently query a local copy of NCBI’s nucleotide (nt) database, targeting 31 gene fragments (SI Appendix, Table S1) commonly sampled among mammals. Meredith et al. (35) was our starting point since their matrix included most extant families for 22 exons and 5 noncoding regions. We further targeted four protein-coding mitochondrial genes to maximize species-level sampling. For each gene, we used a set of pre-vetted sequences or ‘baits’ as queries for extracting homologous gene fragments from the NCBI database using the “blastn” executable (BLAST+ version 2.2.31) and the XML2 output format to assign taxonomic information for subsequent parsing.
Synonym resolving and master taxonomy for this study
The NCBI taxonomy of our genetic data contained many synonyms that required matching to accepted mammalian species prior to analysis. We based this matchup on a synonym list compiled from Catalogue of Life, MSW3 (60), and IUCN (total of 195,562 unique equivalencies; updated from Meyer et al. (61)). This procedure yielded direct matches for 75% of the NCBI names from our BLAST search. We matched an additional 765 names via manual reference to the literature and identified 1273 species synonyms to yield a list of 4,217 accepted species with ≥1 sampled gene for subsequent error-checking. This taxonomic matchup also produced a master taxonomy of 5911 mammalian species for this study, of which 5,804 species are considered extant (SI Appendix, Table S2). The Mammal Diversity Database (62, 63) (mammaldiversity.org) was an outgrowth of our project, and continues to update mammalian taxonomy as new literature is published.
DNA sequence error-checking and alignment
We used an iterative per-gene approach to clean annotation errors in NCBI, as follows: (i) sequence alignment, (ii) gene-tree construction (RAxML v.8.2.3 (64)), and (iii) error-checking for stop codons and insufficient alignment overlap (Fig. 2a). In total, our error-checking steps excluded 1618 sequences across all genes (i.e., 7.2% of the 22,504 individual DNA sequences; SI Appendix, Table S1 and S3) corresponding to 119 species, and yielding 4098 species with ≥1 gene fragment validated in the final 31-gene matrix (Dataset S1 lists excluded sequences).
Global DNA-only ML tree
Phylogenetic analysis of the 4098-species DNA matrix was first performed in RAxML with the goal to identify the single best-supported topology for global mammals (SI Appendix, Table S4, Dataset S3). The supermatrix of 39,099 base pairs (bp) was 11.9% complete in terms of ungapped sites, which was a level of missing data not expected to confound phylogeny estimation (65, 66).
Patch subclades and PASTIS completion of missing species
Examination of well-supported nodes (>75% bootstrap support) in the global ML tree informed our division of the mammalian phylogeny into 28 patch subclades (11). Delimiting patches was an essential step for conducting Bayesian analyses on manageable tree sizes given co-estimation upon 1000 or more species exceeds current computational limits (SI Appendix, Fig. S2, Table S5). Taxonomic constraints for MrBayes v.3.2.6 (67) were formed with the R package PASTIS (58), reducing the potential for human error while identifying non-monophyletic genera in the global ML tree (see Dataset S4). Completed species’ branch lengths were drawn from the same birth-death distribution as the rest of the patch clade, tending PASTIS completions conservatively to rate-constant processes while preserving the taxonomically expected tree shape (11, 58).
Fossil-dated backbone trees
Two backbones were constructed: (i) node-dating (ND), using 17 fossil calibrations from Benton et al. (31), as augmented by Philips (68); and (ii) tip-dating (fossilized birth-death, FBD (69)), using the morphological data set of Zhou et al. (32) trimmed to 76 fossil and 22 extant taxa (mostly Mesozoic fossils, 66–252 Ma). In both analyses, we focused on a common set of extant taxa to subset the full supermatrix for molecular characters (59 mammals, representing each of the 28 patch clades plus select family-level taxa with morphological data, and 1 outgroup Anolis carolinensis). ND and FBD analyses were conducted in MrBayes analogously to patch clades, and compared to test dating sensitivity (SI Appendix, Fig. S9, Table S6, Dataset S5).
Construction of full dated mammalian phylogenies
Tree distributions from the 28 patch subclades (TopoCons and TopoFree) and two backbones (ND and FBD) was performed in ape (70), as outlined in the SI Appendix. Sets of 10,000 trees will be available in the phylogeny subsetting tool at vertlife.org/phylosubsets and temporarily at XXXXXXX.
Tests for diversification-rate variation or constancy -- Tip-level rates
Following ref. (11) we calculated per-species estimates of expected pure-birth (PB) diversification rates for the instantaneous present moment (tips of the tree) using the inverse of the equal splits measure (11, 12). We call this metric ‘tip-level diversification rate’ (tip DR) because it measures recent diversification processes among extant species (7) (≈ speciation rate, if recent extinction is minimal (71)). Tip DR is tightly associated with more complex tip-level metrics (SI Appendix, Fig. S4a), and as a clade-level harmonic mean approximates PB clade rates (R2: ~0.7 versus ~0.5 for BD speciation and net diversification rates; SI Appendix, Fig. S4b).
Lineage-specific rate shifts
We performed searches for macroevolutionary shifts using BAMM v2.5 (43), a reversible-jump algorithm for sampling birth-death scenarios of variable rate regimes without a prior hypothesis. The high degree of phylogenetic uncertainty across our trees (~30% completed species) prompted us to evaluate the number and location of rate shifts on 10 trees from the node-dated sample. We summarized across the most likely shifts per tree—called maximum shift credibility (MSC) sets (SI Appendix, Fig. S15a)—using the ratio of the mean net diversification rate of all branches inside the shifted clade (clade rate) and outside that clade (background rate) to calculate the rate shift magnitude and direction for each MSC set (SI Appendix, Table S8 and Dataset S7; for tree-wide rate shifts, see SI Appendix, Fig. S15-S16).
Fossil diversification
We analyzed Mammalia fossil occurrence data from the Paleobiology Database (72), grouping by genus after excluding ichnotaxa and uncertain genera, we recovered 71,928 occurrences of 5300 genera, which we binned in 10-Ma intervals and used shareholder quorum subsampling (SQS (73); quorum size: 0.5) to maximize the uniformity of coverage. Corresponding origination and extinction rates per stage were calculated using the per-capita rate method (74), and the oldest fossil per extant order was compared to stem ages in our node-dated phylogeny (SI Appendix, Fig. S13, Table S7).
Likelihood tests of RC and RV models of diversification
We analyzed the branching times of 27 named subclades (11 orders and 16 suborders) that contained ≥25 species. For each subclade, we tested 10 models developed by Morlon et al. (42): two rate-constant (RC) models, constant PB and BD; and eight rate-variable (RV) models, with exponentially and linearly time-varying rates. We fit models for 100 trees of the empirical subclades and their matching RC-simulated trees (null models, simulated under the empirical extinction fractions of ~ ε=0.65 over 100 trees using the “pbtree” function in phytools (75)). Subtracting AICc scores of the best-fitting RC and RV models provided the ΔAICRC-RV test statistic per tree and subclade for comparison to the simulated null distribution (alpha=0.05; see SI Appendix, Table S9).
Time-sliced clades and clade-level PGLS
To objectively define clades, we arbitrarily drew lines (referred to as “time slices”) at 5-Ma intervals and took the resulting tipward monophyletic clades as non-nested units of analysis. The rootward relationships of those clades (the “rootward backbone”) was retained for each interval, giving the expected covariance structure among clades when performing phylogenetic generalized least squares (PGLS) analyses (SI Appendix, Fig. S5 for illustration). We used the “treeSlice” function in phytools to construct clade sets across Mammalia trees and the three sets of RC simulations, empirical (ε=0.65), low (ε=0.2), and high (ε=0.8), also comparing our results to analyses on traditional taxon-based clades (genera, families, and orders; SI Appendix, Fig. S18-S20). All PGLS was performed excluding extinct species, using Pagel’s “lambda” transformation in phylolm (optimized for large trees (76)), and repeating the analysis across 100 or 1000 trees.
Tests for causes of diversifìcation-rate variation — Mammalian trait data
Our workflow for gathering trait data involved (i) unifying multiple trait taxonomies (e.g., EltonTraits v1.0 (77)) to our phylogeny’s master taxonomy; and (ii) interpolating home range area and vagility to the species level using known allometric relationships in mammals (SI Appendix, Fig. S6, Dataset S7). Vagility was calculated as the maximum natal dispersal distance per individual (km) and interpolated for each species following our updated version of Whitmee and Orme’s (78) best-fit equation, testing for collinearity prior to analyses (SI Appendix, Fig. S7).
Tip-level correlates of diversification rates
To better understand correlative structures underlying the observed rate variation, we performed tip-level PGLS analyses between species’ ecological traits and tip DR values across 1000 trees, focusing on a 5675-species data set that excluded all extinct (n=107) and marine (n=129) species. We followed Freckleton et al. (8) in using trait ~ rate models in our tip-level PGLS analyses to avoid identical residuals in the dependent variable (i.e., sister species have identical tip DR values, violating the assumption of within-variable data independence in bivariate normal distributions). The trait ~ rate approach has been applied using tip DR in univariate contexts (79) (see SI Appendix, Fig. S21 for sensitivity tests).
Clade-level correlates of diversification rates
At the clade level, univariate PGLS was performed typically (rate ~ trait models), since clade tip DR mean gave independent values to sister clades. These analyses were conducted on 1000 trees by analogy with those previous, except that per-clade trait summaries were the standardized predictors (geometric means for vagility, otherwise arithmetic means). We also performed tests for trait-dependent diversification using rate-shifted clades identified in BAMM runs on 10 mammal trees (STRAPP (80) method), which corrects for phylogenetic pseudoreplication similar to PGLS except considering only the covariance structure among rate regimes (see SI Appendix, Fig. S17).
Phylogenetic path analyses
Path analysis aims to fully resolve correlational structures and thereby translate from the language of statistical probability to causality. In phylogenetic path analyses, we used PGLS to test statements of conditional independence (53) across 27 preselected path models (SI Appendix, Fig. S8). For each tree and clade set, we used “phylopath” (81) to analyze models and perform conditional model averaging. Time-sliced clades at 10-, 30-, and 50-Ma intervals were analyzed along with taxon-based clades (SI Appendix, Fig. S20, S22).
Data availability
All data and code is available in the manuscript, supplementary materials, and after publication on Dryad (all code will be available at github.com/n8upham/).
Acknowledgments
We thank I. Quintero, M. Landis, D. Schluter, A. Mooers, A. Pyron, G. Thomas, D. Greenberg, and E. Florsheim for conceptual discussions that improved this study; B. Patterson, K. Rowe, J. Brown, T. Colston, T. Peterson, D. Field, T. Stewart, J. Davies, and three anonymous reviewers for comments on earlier drafts; S. Upham for improving figure design; C. Meyer for his synonym list; and M. Koo, A. Ranipeta, J. Hart, M. Swanson, C. Burgin, and J. Colella for database help. Artwork from phylopic.org and open source fonts. The NSF VertLife Terrestrial grant to W.J. and J.E. (DEB 1441737 and 1441634) and NSF grant DBI-1262600 to W.J. supported this work.
References
- 1.↵
- 2.↵
- 3.↵
- 4.↵
- 5.↵
- 6.↵
- 7.↵
- 8.↵
- 9.↵
- 10.↵
- 11.↵
- 12.↵
- 13.↵
- 14.↵
- 15.↵
- 16.↵
- 17.↵
- 18.↵
- 19.↵
- 20.
- 21.↵
- 22.↵
- 23.↵
- 24.↵
- 25.↵
- 26.↵
- 27.↵
- 28.↵
- 29.↵
- 30.↵
- 31.↵
- 32.↵
- 33.↵
- 34.↵
- 35.↵
- 36.↵
- 37.↵
- 38.↵
- 39.↵
- 40.↵
- 41.↵
- 42.↵
- 43.↵
- 44.↵
- 45.↵
- 46.↵
- 47.↵
- 48.↵
- 49.↵
- 50.↵
- 51.↵
- 52.↵
- 53.↵
- 54.↵
- 55.↵
- 56.↵
- 57.↵
- 58.↵
- 59.↵
- 60.↵
- 61.↵
- 62.↵
- 63.↵
- 64.↵
- 65.↵
- 66.↵
- 67.↵
- 68.↵
- 69.↵
- 70.↵
- 71.↵
- 72.↵
- 73.↵
- 74.↵
- 75.↵
- 76.↵
- 77.↵
- 78.↵
- 79.↵
- 80.↵
- 81.↵


