

Abstract
This study uses new techniques of topological data analysis to demonstrate the relationship between breast cancer assays and important biological modules. Specifically, we map the landscape of breast tumor molecular states and integrate the information provided by the PAM50 intrinsic subtypes and the 21-gene Oncotype DX Recurrence Score. We modify the Mapper tool, which provides a visual network representation of a dataset in high dimensions, to allow us to incorporate relevant gene sets and stratification functions informed by pre-existing research on breast tumor profiling, mammary basal and luminal-epithelial cell types, and prognostication schemes. This customized tool is utilized to analyze mRNA profiles of TCGA (The Cancer Genome Atlas) breast tumors, METABRIC (Molecular Taxonomy of Breast Cancer International Consortium) breast tumors, and GTEx (Genotype-Tissue Expression) normal mammary tissue samples. The unsupervised analysis locates the basal-like, HER2-enriched, normal-like, Luminal A, and Luminal B breast tumor subtypes along a graphical summary of the breast tumor mRNA expression profiles along assay-relevant genes. The method illuminates the inherent stratification of breast cancer types that is implied by the effectiveness of the Oncotype DX and PAM50 gene sets.
INTRODUCTION
Breast cancer is the most common non-skin type malignancy and the second leading cause of cancer mortality in women [1]. Indeed, worldwide, breast cancer accounts for almost 23% of all cancers (excluding non-melanoma skin cancers) in women, and is the most common female cancer. It is a complex heterogeneous disease with a number of distinctive subtypes.
The risk of breast cancer recurrence is well-established by the ASCO-recommended Oncotype DX assay and the FDA-approved Prosigna assay (based on the PAM50 gene set). However, the tests only retrieve a score, which leaves many questions unanswered regarding the the variation of biological subtype along the continuum of assay scores. In this paper, we investigate this issue using modified Topological Data Analysis (TDA) techniques. We refine the subtype specification provided by established methods, like agglomerative hierarchical clustering applied to mRNA expression profiles of tumor tissue samples, using the TDA tool called Mapper [2]. This tool provides a visual representation of a given landscape of sample vectors.
Data analysis methods that employ ideas from the mathematical field of topology have gained popularity in recent years. More precisely, discrete algorithmic counterparts of topological concepts have emerged in response to the availability of large datasets harboring hidden structures. Mapper, a discrete analogue of a Morse-theoretic analysis of a manifold with respect to a height function, or “filter” function, has received particular attention with regards to both its theoretical foundations [3,4] and, following the landmark TDA breast cancer study of Nicolau et al. [6], its application to cancer genomics [7-9]. Using a binning strategy, the filter function provides a rough stratification of a given sample set, and then each stratum is clustered into nodes with edges between them representing cluster overlaps. The choice of filter function is important because it provides the overall basis for dimensional reduction to a 1D network or graph, and hence the basis for interpretation of the results with respect to spatial arrangement in the graph. Possible choices include generic functions like centroid-distance or eigenfunctions of a distance-weighted-graph Laplacian (as in a fully-unsupervised setting) but also quantitative outcomes or covariates of interest like patient age or disease grade. In this paper, the filter functions are taken to be the Oncotype DX Recurrence Score itself in the case of the 21-gene profiles and a basal-luminal epithelial differentiation score in the case of the PAM50 gene profiles.
Nicolau et al. [6] employed Mapper for the unsupervised analysis of high-dimensional RNA expression microarray data of breast tumor samples from the Netherlands Cancer Institute (NKI). For the filter function, they use a quantification of disease progression for each sample calculated with respect to a normal tissue sample set. To deal with the prevalent problem of sparsity, or high dimensionality compared to the sample size, they add simulated samples to estimate a dense distribution (mathematical de-sparsing) and then perform dimensionality reduction via principal component analysis. The graphical summary they obtain broadly recovers known general classes of breast cancer, with basal-like, normal-like, and ER-positive groups localized along the graph provided by Mapper, as well as providing evidence for a new molecular subtype corresponding to a very high survival rate.
In the present study, we use the Mapper tool for refinement and synthesis of different existing classification schemes. Instead of employing mathematical de-sparsing, we begin the analysis with intermediate-dimensional datasets by focusing on gene sets with known discriminatory or prognostic value: (1) the PAM50 50-gene intrinsic subtyping set introduced by Parker et al. [10] to better differentiate between tumor samples from different patients rather than tumor samples from the same patient, and (2) the 21-gene prognostic gene set of Paik et al. [11] which forms the basis of the Oncotype DX Recurrence Score (RS). For the filter function, which provides the initial stratification, we use: (1) a rough index of epithelial cell differentiation using basal/mesenchymal and luminal-epithelial marker genes, informed by previous studies [12-15] hypothesizing cancer subtype derivation from the heterogeneous phenotypes of cells in pre-existing normal tissue, and (2) the Oncotype DX Recurrence Score. To improve interpretability of the Mapper visualization, we incorporate expression heatmaps localized along the graphical summary. The results are compared across 3 RNA expression datasets: (1) TCGA RNA-Seq with 1082 breast tumor samples; (2) METABRIC microarray with 1904 breast tumor samples; and (3) GTEx RNA-Seq with 290 normal mammary tissue samples.
RESULTS
Summary
Our main findings are (1) identification of likely cell types of origin for each PAM50 subtype by correlating GTEx PAM50 signatures with GTEx normal mammary cell marker patterns; (2) determination of the qualitative function (model whiteboxing) of the Oncotype DX recurrence score stratification with respect to 21-gene signatures; (3) identification of intermediate positions between the PAM50 sub-types including, for example, a rare but relatively coherent HER2-enriched subtype with little basal-like marker expression, located farther from the main HER2-enriched group than basal-marked Luminal A; (4) downregulation of EGFR and PHGDH in Luminal B in comparison with apparent dysregulation in Luminal A, possibly related to the mechanism of greater aggressiveness in Luminal B via the serine metabolic pathway; and (5) validation across TCGA and METABRIC datasets with respect to the topological description of the feature space and the location of coherent signatures.
Mapper analysis of TCGA breast tumor dataset along PAM50 using basal-luminal stratification (Figure 1)
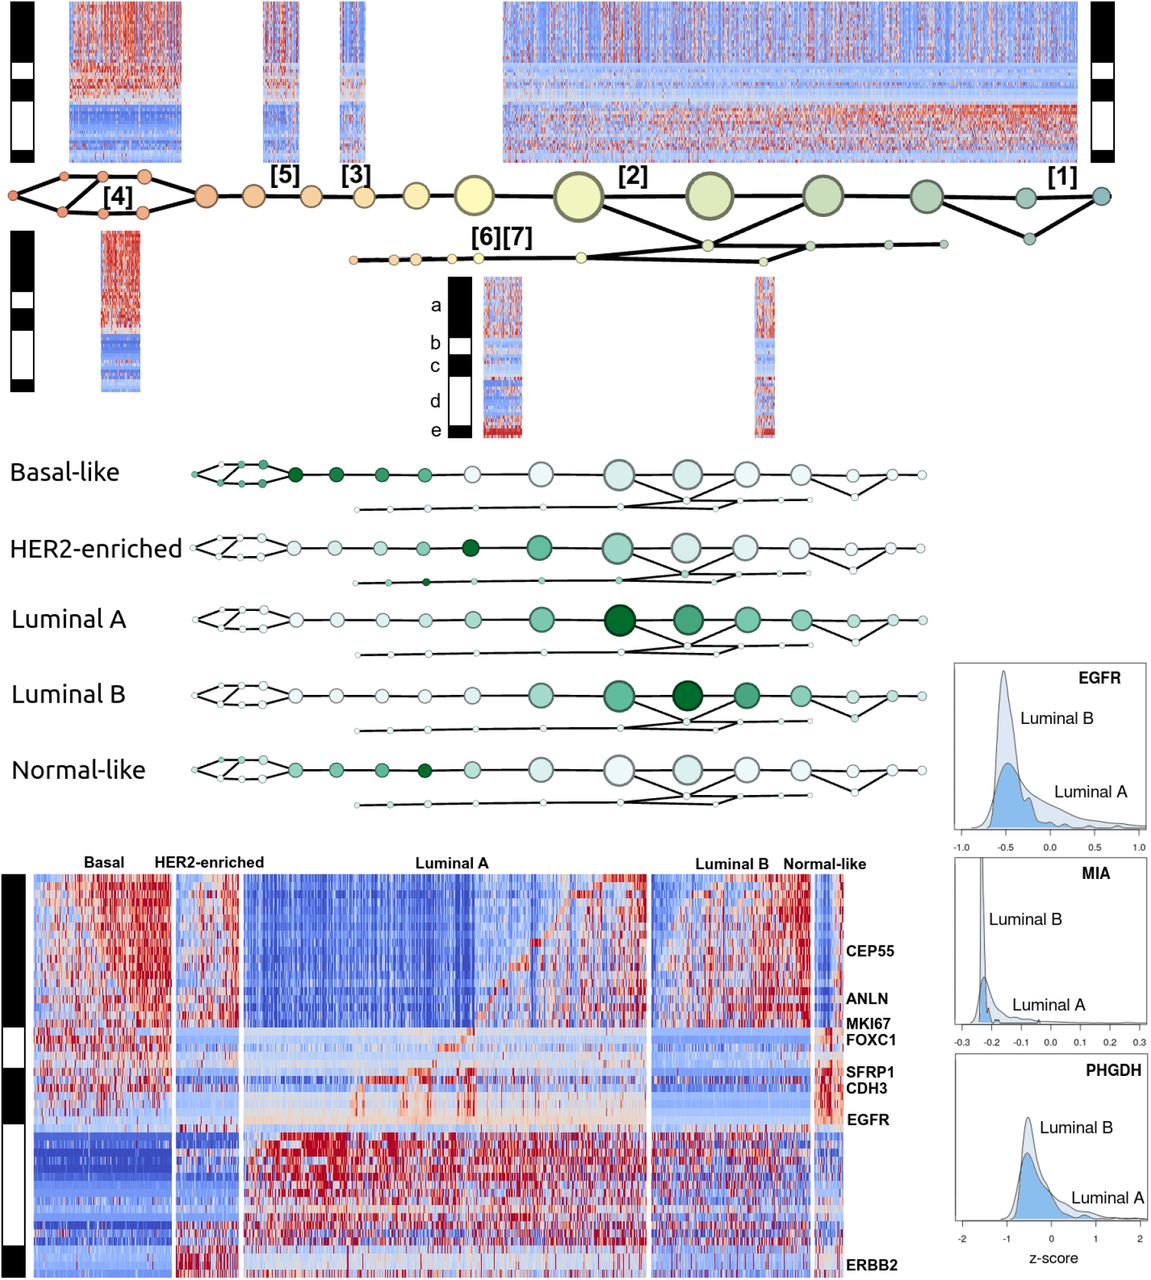
Figure 1 summarizes the Mapper analysis of the 1082 TCGA breast tumor RNA profiles along the PAM50 gene set, performed with respect to a basal-luminal index filter function. Gene groups were determined by unsupervised correlation-based clustering within single nodes. In view of Supplementary Table S2, the gene groups are (a) basal-like markers, (b) a second group of basal-like markers, (c) mainly normal-like markers, (d) ER-related markers, and (e) HER2/ERBB2-related markers.
The signatures appearing in Figure 1 are recorded in Table 1. They were validated for coherence and concordance with PAM50 subtypes using the OncoGrid visualization in cBioPortal (Supplementary Figure S1). Sample groups showing signatures [1] and [2] are ER-positive, these two being distinguished by activity of gene group (a). Signatures [6] and [7] are HER2-positive, distinguished by activity of the ER group (d). Signatures [3], [4], and [5] all express the normal-like markers (except [5] which expresses most of (c) but lacks basal keratins 5, 14, and 17, and EGFR). Signature [3] is distinguished from [4] and [5] by lack of expression of both basal-like groups (a) and (b). On the basal-luminal scale: the ER-positive samples are concentrated on the luminal side, as expected; the expression of basal-like gene group (a) has higher concentration on the basal side, but appears on the luminal side as well; the subtype clearly marked by HER2/ERBB2 expression is spread out across the intermediate and luminal ranges; the apparently normal-like signature [3] is limited to one narrow region with intermediate basal-luminal index; basal-like signatures [4] and [5] are concentrated on the basal side; [2] is spread out along the luminal side.
Refinement and validation with METABRIC dataset (Figure 2)
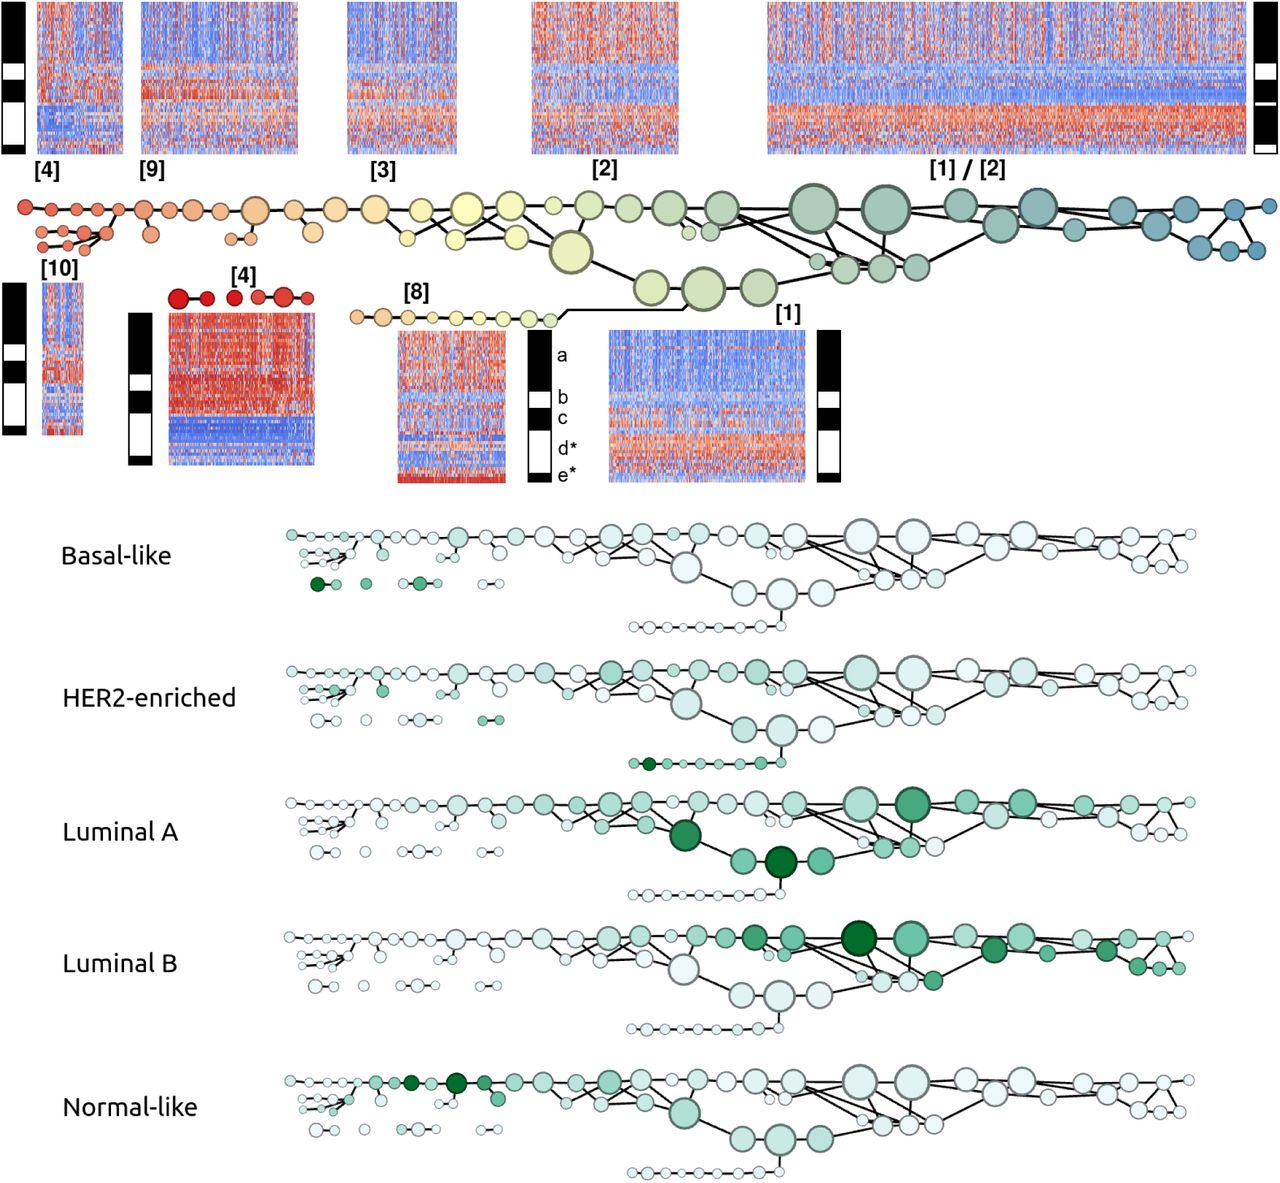
Table 1 also summarizes the signatures uncovered by the Mapper analysis of the 1904 METABRIC breast tumor RNA profiles along the PAM50 gene set, performed with respect to the basal-luminal index. To facilitate comparison with the TCGA analysis, the gene groups were chosen to be the same as in Figure 1, except that group (d*) omits BAG1 and GPR160 and group (e*) omits TMEM45B due to missing values. Overall, the analysis has higher resolution (additional and more coherent signatures) since there are approximately twice as many METABRIC samples as TCGA samples. Note that we have included two large cohorts collected as part of the METABRIC study (997 and 995 samples, with 88 samples omitted for missing all values for our genes of interest) [33]. Signatures [1], [2], [3], and [4] reappear approximately unchanged, except most notably that MYBL2 no longer coexpresses with (a). A large number of samples otherwise expressing signatures [1] or [3] are MYBL2 positive, and a large number of samples otherwise expressing [2] or [4] are MYBL2 negative. The expression of (b) is less coherent than in the TCGA analysis, with MIA and FOXC1 exhibiting complementary distribution to ACTR3B, CCNE1, and PHGDH along several node sets. The HER2-positive signatures [6] and [7] are replaced with [8], with much more activity in (a), (b), and (c). A new signature appears, [9], combining some features of [3] and [4] from Figure 1. [10] is like [9] except for HER2 positivity in [10]. Unlike Figure 1, where signatures [1] and [2] appear interleaved along a single main branch of the graph, here the main branch is largely resolved into [1] (below) and [2] (above).

GTEx normal mammary tissue dataset comparison (Figure 3)
Table 1 also summarizes the signatures uncovered by the Mapper analysis of the 290 GTEx normal mammary tissue RNA profiles along the PAM50 gene set, also performed with respect to the basal-luminal index. The gene groups are chosen to be the same as in Figure 1. [1] reappears as a coherent group with the most extreme luminal value along the basal-luminal scale. A new signature, [11], shows especially coherent activity along (a). Approximately one third of the samples, with intermediate basal-luminal index, display new signature [12], defined by low expression along the subset of the genes (c) consisting of CDH3 and the keratins 5, 14, and 17, as well as the HER2/ERBB2-related group. As pointed out by Prat and Perou [12], caution is advised in interpreting a “signature” such as [12], since it is not defined by any clear positive expression markers.
All of these signatures are relatively well localized along the graph. Signature [1] appears on the luminal side, [10] appears on the basal side, signature [11] appears as a separate branch near the luminal side, and signature [12] appears in the intermediate region.

Mapper analysis of TCGA breast tumors with respect to Oncotype DX RS recurrence prognosticator (Figure (4)
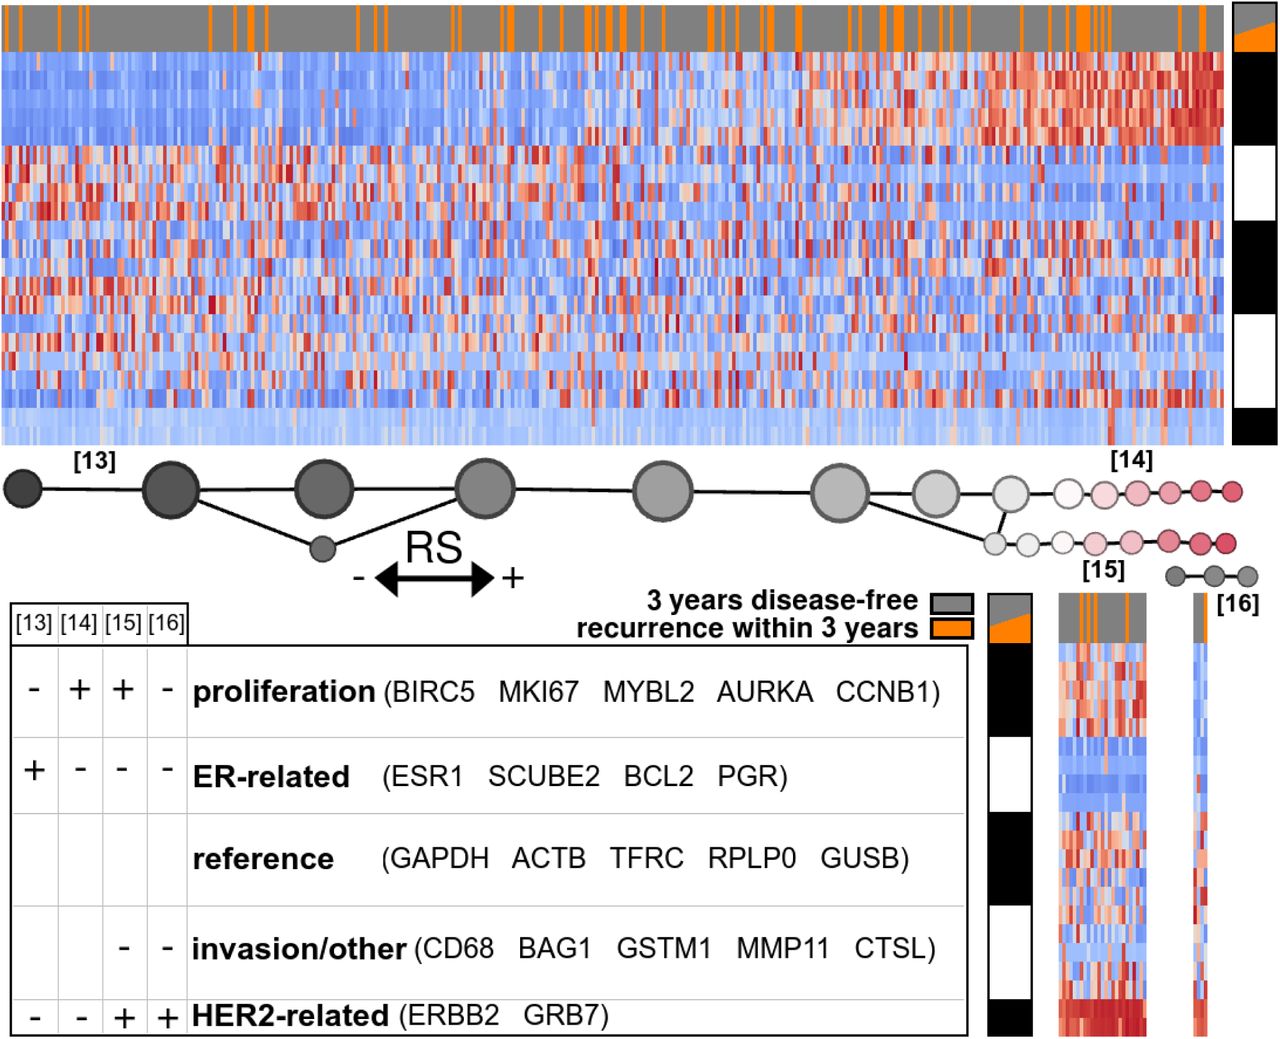
Figure 4 illustrates the Mapper analysis of 380 of the TCGA samples along the 21-gene set, filtered by the calculated recurrence score. The 380 samples correspond to those patients for whom complete recurrence/non-recurrence data is available for at least 3 years. The large majority of these samples exhibit one of four clear signatures, [13], [14], [15], or [16]. Signatures [15] and [16] are HER2+, distinguished by the presence of proliferation markers in [15] which are absent in [16]. Though [16] is very rare, it was readily discerned by the unsupervised analysis. Signature [13] is defined by activity of the ER-related gene group, and [14] by activity of the proliferation group, these two gene groups exhibiting approximately complementary distribution.
DISCUSSION
PAM50 gene set and classifier
Perou et al. [16] performed unsupervised hierarchical clustering on mRNA microarray profiles of 84 breast tumor samples, clustering genes and samples. Among the resulting gene expression patterns were those of certain cell types with respect to normal mammary epithelial lineage. This line of research led to the PAM50 gene set and associated qRT-PCR RNA profile centroid-based classifier, introduced by Parker et al. [10]. Their Figure A2 shows sets of 10 genes which were shown to discriminate between each of the 5 subtypes (reproduced in our Supplementary Table S2). These computational gene sets do not constitute complete signatures. For example, ESR1 is not listed among the high-expression markers for Luminal A or Luminal B, the two ER-positive subtypes, but rather ESR1 is listed among the low-expression markers for the Basal-like group.
Mapper analysis of TCGA breast tumor dataset along PAM50 using basal-luminal stratification (Figure 1)
The distribution of PAM50 subtypes along the graph, taken together with the localization of (unsupervised) signatures, supports the claim that the subtypes are characterized as follows: Basal-like subtype by signature [4] a+/b+/c+/d-/e-; HER2-enriched by [6] and [7] b-/c-/e+; Luminal A and Luminal B by signatures [1] a-/b-/c-/d+/e- and [2] a+/b-/c-/d+/e-; Normal-like by [3], a-/b-/c+.
There are certain inconsistencies with the PAM50-based classification. Figure 1 shows the expression heatmaps by PAM50 subtype, with the benefit of the gene ordering determined by the Mapper-based analysis. The actual Normal-like group evidently expresses (b), showing a signature not originally salient in the analysis. Rather than marking Normal-like samples, signature [3] a-/b-/c+ actually marks a subtype of Luminal A. Although the heatmap-enriched graph distinguishes two classes within the luminal subtype, the graph itself fails to clearly distinguish between Luminal A and Luminal B. However, note that the original classification of Perou et al. [16] actually listed a single luminal type. The A/B distinction was made later in order to account for large variation in outcome for luminal tumors. Nevertheless, when the analysis was repeated with the larger sample size in the METABRIC dataset, the Luminal A and Luminal B subtypes were distinguished by a separate branch in the graph given in Figure 2.
The graph distinguishes a rare HER2-enriched subtype with little basal-like marker expression, placing it closer to Luminal A than the main HER2-enriched group. This suggests the hypothesis that basal-marked HER2-enriched tumors have their origin or behaviors in common with the (basal-marked) Luminal B tumors, which are not shared with other HER2-positive tumors. This may be a straightforward example of different disease ontology classes conflated by emphasis on specific behaviors of interest (there is a drug, trastuzumab, effective against HER2-enriched tumors regardless of basal markers).
Figure 1 also shows slight upregulation of EGFR in Luminal A in comparison to Luminal B. We should note that the colormaps in Figure 1 are rendered on a per-group basis. The histogram of EGFR expression across all samples reveals a distribution highly skewed towards 0, and indeed both luminal types show negative EGFR expression z-scores overall (downregulation). However, the distribution of z-scores in Luminal A is much less coherent than in Luminal B, and skewed towards more positive values, suggesting that a process acts to regulate EGFR at a stable low level in Luminal B but no longer functions in Luminal A.
The genes MIA and PHGDH seem to exhibit a similar effect. The protein product of PHGDH, the enzyme phosphoglycerate dehydrogenase, is a key participant in biosynthesis of the L enantiomer of the amino acid serine. It is known primarily for causing certain neurological disorders via serine deficiency when mutated. The recent work of Labuschagne et al. [17] and of Amelio et al. [18] implicates serine metabolism specifically in promoting tumor growth, and p53-mediated regulation of PHGDH is associated with abnormal apoptotic response to serine starvation [19,20]. Thus the apparent regulation of PHGDH in Luminal B and dysregulation in Luminal A may be an important clue concerning differential prognosis among patients with ER-positive tumors. Previous observations regarding PHGDH seem to have focused on ER-negative tumors, since PHGDH is amplified in about 70% of ER-negative breast tumors [21].
EGFR/HER1/ERBB1 overexpression was historically one of the earliest potential targets identified for anti-cancer drugs across several cancer types [22-24]. Nevertheless this subtle expression pattern of EGFR in luminal types of breast cancer is not obvious from the point of view of the usual dichotomy between upregulation and downregulation with respect to the whole cohort of breast tumors.
Refinement and validation with METABRIC dataset (Figure 2)
The larger sample size METABRIC analysis correctly displays the new signatures [9] and [10], which largely mark the Normal-like samples. It also corrects the main HER2-positive signatures, [6] and [7], to signature [8] to involve greater expression of the basal-like markers (a).
GTEx normal mammary tissue dataset comparison (Figure 3)
Santagata et al. [25] present a rich classification of normal mammary cell types in terms of marker genes/proteins ESR1, AR, VDR, KRT5, MKI67, KRT18, MME, SMN1, TP63. It includes 11 luminal types L1-L11, belonging to 4 classes HR0-HR3, and 2 myoepithelial types My1 and My2. The classes HR0-HR3 are defined by the number out of 3 hormone receptors that are present: ESR1 (estrogen receptor), AR (androgen receptor), and VDR (vitamin D receptor; note that vitamin D is actually a hormone). To compare the results of the TCGA and METABRIC analysis with the GTEx normal analysis, we first overlay heatmaps of these normal markers on the GTEx graph (Figure 3). Normal cell type signatures are correlated with PAM50 GTEx signatures by colocation of the sample subsets expressing these signatures, and these normal signatures are thereby correlated with PAM50 TCGA or METABRIC signatures by comparison of the signatures themselves. The correspondence is expected to be imperfect since the RNA expression datasets were obtained with bulk sequencing or microarrays, with several cell types in each sample.
Signature [1] is largely colocated with HR1(L4, ER+), HR2(L8, ER/AR+), and HR3. Consistent with the findings of Santagata et al., the GTEx sample subset with expression of all 3 hormone receptors ESR1, AR, and VDR also expresses keratin KRT18. We note that signature [10] is contained in HR1(L7, KRT5/VDR+), and signature [11] is covered by HR0(L1, MKI67+), the only signature with proliferation marker MKI67 (Ki-67), but perhaps also HR1(L5, AR+). Signature [12] colocates with My1/My2 and HR0. The lower left branch is largely HR1(L7, KRT5/VDR+).
Integration of TCGA, METABRIC, and GTEx analysis
Combining the definitions of signatures [1], [10], [11], and [12] with their colocations with normal cell type signatures, we can estimate which combinations of normal cell types would express a signature similar to TCGA and METABRIC signatures [2] through [10]. As in previous studies [12-15], such a combination can be taken to be evidence of tumor origin.
TCGA/METABRIC Signature [1] is already itself present among the GTEx signatures. Signature [2] is a combination of [1] and [11]. [3] does not seem to have a description in terms of [1], [10], [11], and [12]. Signature [4] is a combination of [10] and [11], but without expression of HER2/ERBB2-related gene group (e). Signature [5] is the same as [4], with a higher proportion of [11] (due to negativity of (c)), or possibly the addition of signature [12]. The HER2+ [6], [7], and [8] are most similar to signature [10], possibly with the addition of [11] in the case of the basal-marked [8]. Signature [9] is a combination of [1] and [10], but mainly [10] (not [11], since (a) is highly expressed in [11]). Signature [10] is also already among the GTEx signatures.
We conclude that likely cell types of origin for the PAM50 subtypes are as hypothesized in Table 2. This determination may be skewed by the incompleteness of the concordance between the signatures observed in the GTEx normal dataset and the characteristics of the classes enumerated by Santagata et al. [25]. This discordance itself may be an artifact of our use of RNA expression values rather than protein levels.
Hypothesized cell types of origin for each PAM50 subtype, determined by means of GTEx normal mammary cell RNA expression signatures along the PAM50 gene set. Uses normal mammary cell classification of Santagata et.al. [25].
Prognosis versus disease ontology
The use of ER, PR, HER2/ERBB2, and Ki-67 immunohisto-chemistry assays for tumor classification was made popular by the history of the development of breast cancer treatments related to hormones. The research community has largely insisted that these assays are not a sufficient surrogate for a thorough assessment of molecular subtype, even if one is mainly interested in accurate prognostication rather than determination of activation of specific biological processes [13,26]. When the coordinated expression of a whole gene cluster is thought to be a more realistic indication of a given molecular state, the use of a single marker as a surrogate carries a high risk of misclassification, as in the use of ESR1 as a marker for the approximately 15-gene cluster coexpressing with ESR1.
However, it was mentioned by the 12th St Gallen consensus panel on breast cancer treatment in 2011 [27] that the prognostic value of multi-gene panels is not thought to be sufficiently greater than that of these immunohistochemistry assays to merit adoption of the former to replace the latter. These assays are also much less expensive. This view was reiterated and emphasized by the 14th panel in 2015 [28].
Mapper analysis of TCGA breast tumors with respect to Oncotype DX RS recurrence prognosticator
The 15th St Gallen consensus nevertheless acknowledged a degree of clinical value for multigene panels including Mammaprint and Oncotype DX [29]. The Oncotype DX Recurrence Score and associated three-level recurrence risk classifier has gained popularity in the clinic, mainly for providing evidence that certain patients, otherwise showing aggressive tumor characteristics, may safely forgo chemotherapy.
With the goal of unbiased determination of the source of the predictive value of the 21-gene panel, and eventually refining the risk assessment provided by Oncotype DX RS, we performed Mapper analysis on the TCGA RNA profiles along the 21 genes filtered by the recurrence score described by Paik et. al [11]. Figure 4 clearly shows the function of the recurrence score in the case of 3-year recurrence risk for the TCGA dataset: signature [13] is placed in the low-risk group, [16] in an intermediate group, and [14] and [15] in the high-risk group. The cases of actual recurrence (shown in orange) are somewhat more frequent in the intermediate-to-high score range than in the 380-sample population, but not significantly higher in the high score range; the tumors in the latter range may be at high risk for recurrence some time after 3 years.
Conclusion and future directions
The method of topological representation, and the Mapper tool in particular, has been shown to provide convenient and straightforward access to the main structural features of relatively high-dimensional datasets. It enriches ordinary cluster analysis by a spatial location paradigm that reveals relationships between clusters and retains information about within-cluster variation. Since the methodology is datatype-agnostic, future work will integrate copy-number variation, methylation, phosphorylation, proteomics, and radiomics, as well as incorporate supervised analysis based on clinical outcomes. The analysis will also be extended to other cancer types. Moreover, improved parameter-selection strategies [5] will increase robustness and facilitate statistical significance analysis.
METHODS
We retrieved the 1082 TCGA and 1904 METABRIC [32,33] RNA expression z-score datasets from cBioPortal [30,31]. The 290 GTEx normal breast dataset was downloaded from the GTEx portal in TPM (Transcripts Per Kilobase Million)-normalized format [34]. In the GTEx case, for each gene the sample mean and standard deviation are calculated in order to replace the transcript count values with z-scores. Our use of z-scores entails that the later interpretation of high or low values is relative to the sample set, not absolute. Each dataset is restricted to a gene set of interest.
The Mapper algorithm proceeds as follows. A “filter” function on the sample set is selected. We use a basal-luminal index for the TCGA, METABRIC, and GTEx analyses along the PAM50 gene set, and an estimate of the Oncotype DX Recurrence Score for the TCGA analysis along the 21-gene signature genes.
The basal-luminal index is calculated as the average expression z-score of certain luminal epithelial markers (XBP1, FOXA1, GATA3, ESR1, ANXA9) minus the average expression z-score of certain basal epithelial markers (KRT17, KRT5, DST, ITGB4, LAMC2, CDH3, LAD1, ITGA7). Selected largely on the basis of Perou et al. [16], the basal markers are all associated with anchorage of epithelial cell layers to the basement membrane, while the luminal markers are all expressed in well-differentiated or mature luminal epithelial cells.
The Oncotype DX Recurrence Score is calculated from 21-gene RNA expression signatures as described by Paik et al. in their Figure 1 and the Supplementary Appendix [11].
Next the range of filter values is covered by overlapping bins. Though more sophisticated covers may be chosen, as in Dey et al. [4], we employ a simple uniform data-driven cover for a given number of bins and a given percentage of overlap between successive bins. This percentage is defined as the ratio of the number of samples in the overlap to the total number of samples. The number of bins is chosen approximately equal to the square root of the total number of samples, in order that there are approximately as many samples in each bin as there are bins. This tethers the two quantities together, ensuring that in general the number of bins and the bins themselves are neither too large nor too small. The percentage, which roughly controls the sparsity of the resulting graph, should be chosen between the levels which fully connect and fully disconnect the graph.
Next the samples in each bin are clustered according to an established clustering method. In the present work, Ward’s method [35] is employed, approximately minimizing within-cluster variances. The clusters are called nodes. These nodes are joined by edges whenever they overlap by some subset of samples. The resulting graph can be given a planar representation using graph software systems like Gephi or Cytoscape. We arrange nodes so that the horizontal axis reflects the values of the filter function. For the Mapper algorithm, we used the Müllner implementation Python Mapper.
Heatmap representations of the original data values for each sample are overlaid on the graphical diagram, where each sample’s representation is placed near the location of that sample along the graph. For interpretability, an ordering of the coordinates (genes) should be selected carefully. In practice, convenient orderings are found by grouping together genes which are coexpressed in some node. Often direct or inverse coexpression for a gene group in one node implies direct or inverse coexpression in many other nodes as well.
Salient profiles or signatures with respect to the gene groups are noted at certain locations along the graph. These profiles may be formalized for export and reproducibility in other studies. For example, with Onco Query Language (OQL) queries for use in cBioPortal to investigate clinical characteristics of the samples with given signatures in the original dataset or in other datasets.
FUNDING
This study was supported by AFOSR grant FA9550-17-1-0435), ARO grant (W911NF-17-1-049), a grant from National Institutes of Health (R01-AG048769), MSK Cancer Center Support Grant/Core Grant (P30 CA008748), and a grant from Breast Cancer Research Foundation (grant BCRF-17-193).


