

Abstract
Background Transitions between wakefulness and anesthesia are accompanied by profound changes in brain functioning. A key challenge is to disentangle neuronal mechanisms specific to loss and recovery of consciousness, from more general effects that are not directly related to the capacity for conscious experience. Measures of neuronal diversity have been recently proposed to constitute a robust correlate of the global states of consciousness. In the present study we investigated whether EEG signal diversity is indeed related to behavioral responsiveness during propofol sedation, or rather to the general drug-related effects.
Methods We reanalyzed data collected from 20 subjects sedated with propofol. Based on the responsiveness to auditory stimuli all subjects were subdivided into two subgroups - responsive (n = 13), who remains awake throughout the experiment, and drowsy (n = 7), who becomes unresponsive during moderate sedation. Resting state EEG recorded during wakefulness and sedation was characterized by the Mean Information Gain - an information-theory measure estimating signal diversity.
Results In line with our hypothesis, the drowsy group exhibited a decrease in diversity during sedation but, unexpectedly, the responsive group exhibited a robust increase in diversity (ANOVA group x state interaction: F(3) = 7.81, p < 0.001; BF10 > 100).
Conclusions We revealed that propofol sedation is initially related to an increase in EEG signal diversity, and that only upon loss of responsiveness EEG diversity decreases. The qualitatively different pattern of changes in the responsive and drowsy groups makes EEG diversity a robust indirect index of responsiveness and, presumably, consciousness.
Author Contributions:Conceived the study: MB; Analyzed data: PO, MB; Contributed analysis methods: MP; Interpreted data: MB, AM; Wrote the paper: MB. Revised the paper: MB, AM.
Introduction
What are the neuronal mechanisms of consciousness? One of the main hypotheses is that the capacity for conscious experience relies on the brain’s ability to generate a large repertoire of functional states1, 2. However, the temporal diversity of brain states needs to be balanced between order and disorder, as both insufficient temporal diversity (i.e. dwelling in the same state for long time periods) and excessive diversity (i.e. chaotic transitions between states) will likely cause alterations in the global state of consciousness.
These hypotheses have been tested by recent studies, which established neuronal diversity as a robust marker of the global states of consciousness3. Specifically, it has been shown that brain signals are relatively complex and diverse during wakefulness, but they become simple and stereotypical during NREM sleep4-7 and general anesthesia8-10. The diversity measures have been subsequently applied in the clinical context to successfully classify patients with disorders of consciousness11, 12. Interestingly, recent studies provided first evidence that not only decreases, but also increases in diversity of brain states are in principle possible, specifically during psychedelic states caused by LSD, ketamine, or psilocybin13-15.
Based on these findings brain signal diversity has been interpreted as a correlate of consciousness. However, what limits this interpretation is that conscious and unconscious states differ not only with respect to the presence or absence of conscious experiences. In the context of anesthesia not only neuronal mechanisms specific to loss of consciousness can be observed (i.e. state-related), but also more general effects of the anesthetic that are not directly related to capacity for conscious experiences (i.e. drug-related). Thus, a key challenge is to disentangle these effects in order to distil the genuine neuronal mechanisms of consciousness. One possible approach is to take advantage of the between-subjects variability in susceptibility to anesthetics16 and compare brain activity observed in subjects who are sedated and unconscious, with subjects who are sedated with similar anesthetic doses but remain conscious. Comparing such groups would allow testing whether a given measure is indeed related to consciousness, as then it would change only in the unconscious group, or rather to the general effects of an anesthetic, as then a change would be observed in both groups.
In the present study we adopted the outlined approach to investigate whether signal diversity is indeed related to behavioral responsiveness and, presumably, consciousness. We reanalyzed data from an experiment conducted by Chennu and colleagues17, in which all subjects were sedated with similar doses of propofol, but based on their responsiveness to auditory stimuli they could be subdivided into two subgroups: sedated but responsive, and sedated and unresponsive. Resting-state EEG recorded during wakefulness and sedation was characterized in terms of two information-theory measures: the Mean Information Gain (MIG), which measures diversity understood as randomness or entropy of the data, and Fluctuation Complexity (FC), which is a measure of complexity understood as the state intermediate between order and disorder (Fig. S1). We hypothesized to observe a decrease of diversity and complexity during sedation, but only in the unresponsive group.
Methods
Subjects and data collection
In the present study we reanalyzed data first published by Chennu et al.17. The procedures regarding data collection and preprocessing are briefly described below and the original paper should be consulted for additional details. Ethical approval for the study was provided by the local ethics committee and all subjects provided a written informed consent. The data are accessible from https://www.repository.cam.ac.uk/handle/1810/252736.
Data collected from 20 healthy subjects (11 females; mean age = 30.85, SD = 10.98) were used in the present analysis. Data were collected in four states: wakeful baseline, mild sedation, moderate sedation, and recovery. During each state subjects first performed an auditory discrimination task (for 3 to 5 minutes), and afterwards 7 minutes of resting-state EEG was recorded. States of mild and moderate sedation were obtained by performing a target-controlled infusion of propofol with a computerized syringe driver. The targeted blood plasma levels of propofol were 0.6 mcg/ml for mild sedation and 1.2 mcg/ml for moderate sedation. At each targeted level a period of 10 minutes was allowed to obtain a steady propofol concentration and only afterwards behavioral and EEG measurements were performed. Blood samples were taken in each state to evaluate the actual propofol concentration in blood.
To evaluate subjects’ responsiveness in each state they were asked to perform a simple auditory discrimination task. Specifically, to indicate, by pressing on of two buttons, whether a presented binaurally stimulus was a broadband noise (“noise”) or a harmonic complex with a 150 Hz fundamental frequency (“buzz”). 40 stimuli (20 of each kind) were presented in a random order with a mean inter-stimulus interval of 3 s. A hit-rate was defined as a proportion of correct responses. Binominal modelling of hit-rates obtained during baseline wakefulness and moderate sedation was used to classify subject into either drowsy or responsive subgroups (details of the procedure can be found in: 17).
In each state approximately 7 minutes of eyes-closed resting-state EEG was recorded with high-density 128 electrodes caps and the Net Amps 300 amplifier (Electrical Geodesic Inc., Eugene, Oregon, USA). Offline preprocessing was conducted with EEGlab18. First, 37 channels placed over neck, cheeks, and forehead were excluded and only data from 91 channels covering the scalp area were retained and further analyzed. EEG signals were filtered between 0.5 Hz and 45 Hz and segmented into 10-seconds long epochs. Mean value was subtracted from signal from each channel in an epoch. Semi-automatic procedure was used to remove noisy epochs and channels. The mean ± SD number of retained epochs was: baseline wakefulness - 38 ± 5; mild sedation - 39 ± 4; moderate sedation - 38 ± 4; recovery - 40 ± 2 and did not differ significantly across states. Missing channels were interpolated using the spherical spline interpolation algorithm. As the last step, the data were re-referenced to the average of all channels.
The EEG data were published in the already preprocessed form and we did not apply any further data transformations before calculating the measures described below.
Diversity and complexity analysis
a) Mean information Gain (MIG)
The Mean Information Gain (MIG) is one of the information theory-based measures. MIG is a measure of diversity, as it exhibits maximum values for random signals. The details and a formal definition of MIG can be found in: 19, 20. An application of MIG to EEG data was described by Wang et al.15 and by Bola et al.21, and here we followed the same procedure.
Briefly, to calculate MIG a signal has to be binarized. Here, for each epoch and channel separately, a median value was used as a threshold, and "1" was assigned to the time-points exceeding the median value, while "0" was assigned to the time-points that were below or at the median value. Then binary series were partitioned into “words” of L length, where L is the “window length’ or ‘information length’, and each “word” reflects the state of a system at a given time-point. Using L= 4, as in the main analysis reported here, the possible states/words were 0000, 0001, 0010, 0100, 1000, 0011,0110, 1100, 1010, 0101, 1001, 0111, 1011, 1101, 1110, 1111. A transition to a next state occurs by a shifting a window forward by one symbol.
Calculating MIG starts with the Shannon information content. We define the probability pi that the system is currently in a state ‘i’ by dividing the number of occurrences of a state ‘i’ by the total number of occurrences19. Based on the probabilities of observing transition from state i to j, defined as pij we calculate the transition probability  In the same way, the reverse conditional probability can be obtained as
  .
.
The net information gain can be written as  , and by averaging the gains over all transitions the MIG is estimated:

b) Fluctuation Complexity (FC)
Another example of an information theory-based measure is Fluctuation Complexity (FC). The details and a formal definition of FC can be found in: 19, 20. While applying FC to EEG data we again followed the procedure described in Wang et al.15 and Bola et al.21. Unlike MIG, FC does not consider a random signal to be complex. In the computation of FC, the EEG signals were binarized in the same way as described for MIG.
While shifting from one state to another, the newly observed symbol contributes to a gain of information, defined as  . At the same time we forget the first symbol from the previous word. The loss of information can be expressed as
  .
.
In average for the whole symbol sequence, information gain and loss eliminate each other. The fluctuation complexity is the mean square deviation of the net information gain (i.e. the differences between information gain and loss):

The more this balance of information gain and loss is fluctuating in the given EEG time series the more complex is the signal in the sense of the fluctuation complexity.
c) Lempel-Ziv (LZs and LZc)
MIG and FC have used in recent studies to evaluate diversity and complexity of EEG signals15, 21. But majority of studies have employed the Lempel-Ziv algorithm to estimate EEG signal diversity3, 10. Therefore, for consistency with the previous studies in the present analysis we used two version of the Lemepl-Ziv measures, single-channel Lempel-Ziv (LZs), which captures temporal variability, and multi-channels Lempel-Ziv (LZc), which captures spatio-temporal variability. Similarly to MIG, Lempel-Ziv is a measure of diversity, as it reaches maximum values for random signals. We used an implementation of the method described by Schartner et al.7. Results of the LZs and LZc analysis are presented in the supplementary materials.
To estimate LZs EEG signal from each channel and epoch was assessed independently by demeaning (within 10 s long segment), dividing by standard deviation, and removing a linear trend. Hilbert transform was used to estimate the envelope of a signal (an absolute value of the analytic signal) and the mean of the envelope was used as a threshold to binarize the signal, i.e. “1” was assigned to time-points exceeding the mean value, while “0” was assigned to measurements that were below or at the mean value. The binarized signal was then segmented into blocks using the encoding step of the Lempel-Ziv compression algorithm. The number of blocks is the raw LZs score for the segment. Next the raw LZs value was normalized by the raw LZs value obtained from the same binary signal shuffled in time. Thus, the final (normalized) LZs score varies between 0 and 1 indicating, respectively, minimally and maximally diverse signals.
To estimate LZc the 64 time series (one for each EEG channel) from a 10 s segment of data are binarized as described above for LZs, then concatenated observation-by-observation into one binary string such that the first 64 digits of that string are the observations of the 64 channels at time step 1, the next 64 are those at time step 2, etc. The diversity of this binary string is then assessed in the same way as described for LZs above.
Statistical analysis
All values presented as Mean ± Standard Error of the Mean (SEM), unless stated otherwise. All statistical analyses were conducted in JASP software22. The performed tests involved two-way repeated-measures ANOVA, with within-subjects factor state (4 levels: wakeful baseline, mild sedation, moderate sedation, recovery) and between-subjects factor group (2 levels: drowsy, responsive). Subsequent post-hoc tests were computed, either paired-samples t-tests to compare between states, or independent-samples t-tests to compare between groups. Post-hoc comparisons were corrected for multiple comparisons using the Bonferroni-Holm procedure23.
The traditional null-hypothesis significance testing approach was complemented with Bayesian statistics in order to enable testing for the lack of differences between variables. The Bayes Factor (BF10) is defined as the ratio of the probability of observing the data given the alternative hypothesis is true, to the probability of observing the data given the null hypothesis is true. Thus BF10 provides a continuous measure of evidential support and is typically interpreted according to Lee and Wagenmakers 24: BF10 < indicates strong evidence in favor of the null hypothesis (i.e. lack of an effect); 0.1 < BF10 < 0.33 indicates moderate evidence in favor of the null hypothesis, 0.33 < BF10 < 3 indicates inconclusive data, 3 < BF10 < 10 indicates moderate evidence in favor of the alternative hypothesis, BF10 > 10 indicates strong evidence in favor of the alternative hypothesis,. Bayesian equivalents of a two-way ANOVA and t-test were calculated using a medium prior scale (Cauchy scale: .707).
In an additional analysis we aimed to test whether between-group differences in MIG observed during moderate sedation can be explained by differences in propofol concentration. We thus conducted a one-way ANOVA with a group factor, which in this case is equivalent to an independent-samples t-test, and included a propofol concentration as a covariate.
Results
In the present study we reanalyzed a data-set published by Chennu et al.17. In their study 20 subjects were sedated with propofol and data were acquired in four states: baseline wakefulness, mild sedation, moderate sedation, and recovery. In each state subjects performed an auditory discrimination task to assess their responsiveness and next resting-state EEG was recorded. The profiles of hit rates, defined as a proportion of correct responses, indicate that subjects can be subdivided into two subgroups - responsive (n = 13), who remains awake throughout the experiment, and drowsy (n = 7), who becomes unresponsive during moderate sedation (Fig. 1). Comparing both groups in terms of propofol concentration in blood we found a significant state x group interaction (F(2) = 124.6, p < 0.001; BF10 > 100). Specifically, there was no difference between groups during mild sedation (0.41 ± 0.04 vs. 0.50 ± 0.08 mcg/ml; t(18) = 1.05, p = 0.30; BF10 = 0.59) and recovery (0.27 ± 0.02 vs. 0.32 ± 0.03; t(18) = 1.37, p = 0.18; BF10 = 0.77), but during moderate sedation the drowsy group had a higher in-blood propofol concentration (0.79 ± 0.05 vs. 1.09 ± 0.12; t(18) = 2.60, p = 0.018; BF10 = 3.37).
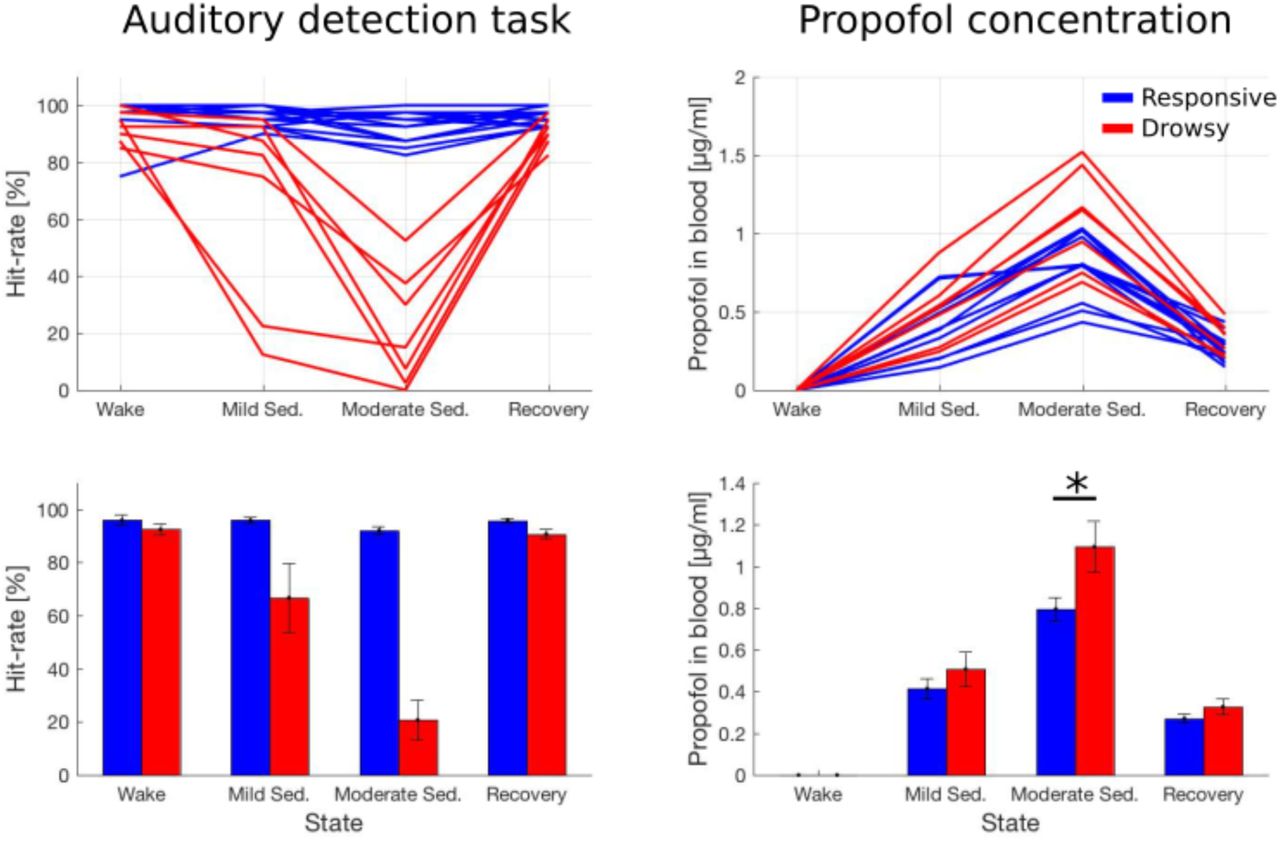
Hit-rates during an auditory detection task (left panels) and propofol concentration estimated from blood samples taken during the experiment (right panels). Upper panels present data of individual subjects from both groups, while bar-plots in lower panels present mean ± SEM of the same data. Statistical analysis of hit-rates was not conducted in this study, and in case of propofol concentration only comparisons between groups (but within states) were conducted. * - p < 0.05.
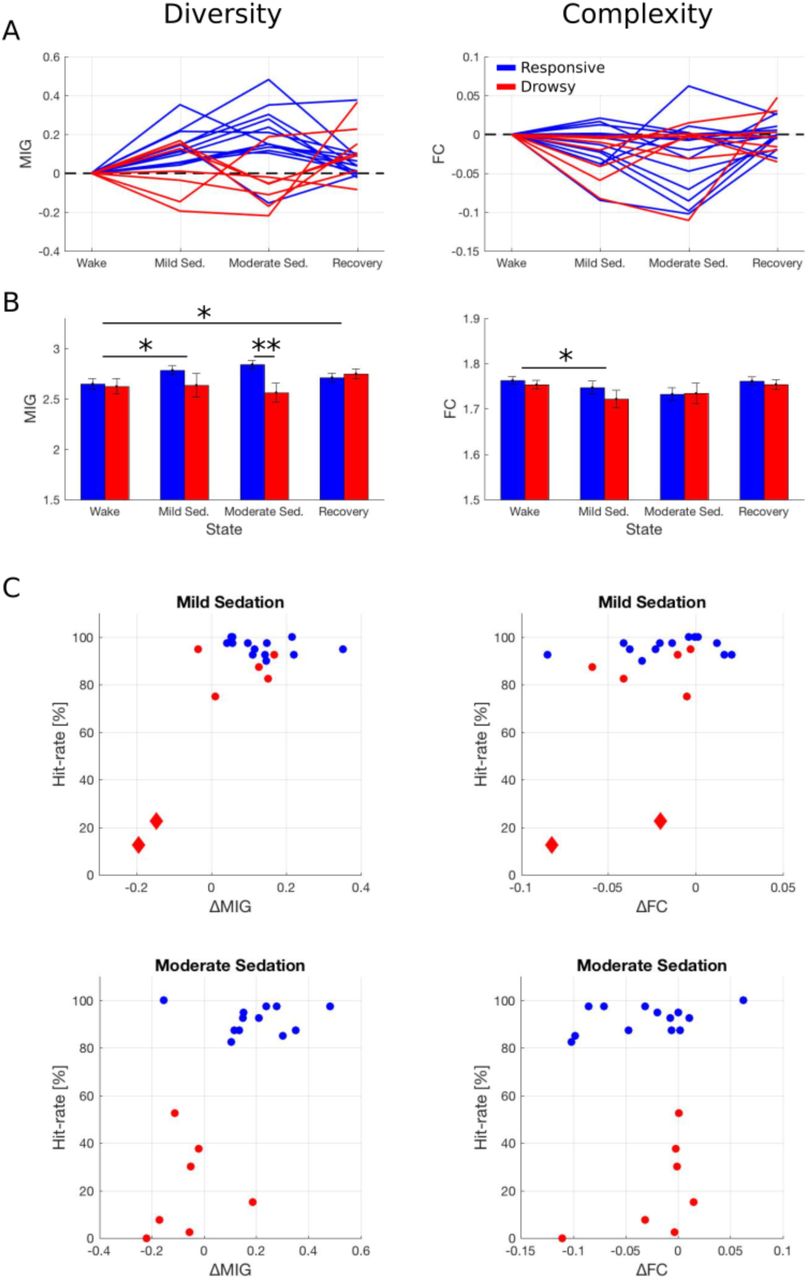
The recorded resting-state EEG signals were characterized in terms of diversity and complexity using two information theory measures19 (Fig. S1). Diversity, understood as randomness of the data, was estimated by the Mean Information Gain (MIG). Statistical analysis of MIG indicates no main effect of group (F(1) = 1.8, p = 0.19; BF10 = 0.80) and no effect of state (F(3) = 2.59, p = 0.062; BF10 = 1.27), but a significant group x state interaction was found (F(3) = 7.81, p < 0.001; BF10 > 100). Subsequent post-hoc tests indicate that, with respect to the wakeful baseline, MIG increases during mild sedation (t(19) = 3.34, p = 0.020; BF10 = 12.7) and recovery (t(19) = 3.15, p = 0.026; BF10 = 8.83), but not during moderate sedation (t(19) = 2.47, p = 0.093; BF10 = 2.56). Importantly, lack of the significant effect during moderate sedation is due to a different pattern of changes in both subgroups, which is confirmed by a significant difference between groups during moderate sedation (t(18) = 3.24, p = 0.005; BF10 = 9.20) but not during other states (all p > 0.10; all 0.3 < BF10 < 1). Specifically, the drowsy group exhibits a decrease in MIG during moderate sedation (with respect to baseline) but the responsive group exhibits an increase.
Next we analyzed the Fluctuation Complexity (FC), which is a measures of complexity understood as a state intermediate between an order and disorder. We found a significant effect of state (F(3) = 4.46, p = 0.007; BF10 = 9.56), but no effect of group (F(1) = 0.36, p = 0.55; BF10 = 0.50) and no group x state interaction (F(3) = 0.74, p = 0.53; BF10 = 1.29). Subsequent post-hoc tests indicate that, with respect to baseline wakefulness, FC decreases during mild sedation (t(19) = 3.20, p = 0.028; BF10 = 9.65). Comparison of wake with moderate sedation is inconclusive (t(19) = 2.57, p = 0.092; BF10 = 3.08), as p value reaches a trend level only but BF10 indicates evidence for a difference between states. All other comparisons between states were not significant (all p > 0.10; all BF10 < 3).
Further, we report results of three additional analyses. First, inspection of the hit-rates profiles suggests that 2 subjects became unresponsive already during the mild sedation state (both had hit-rate < 25%; Fig. 1). Plotting hit-rates against changes in MIG demonstrates that exactly these two subjects exhibit a robust decrease in MIG already during mild-sedation (Fig. 2C). While statistical analysis cannot be conducted on such a small subsample of 2 subjects, this observation provides an additional, qualitative piece of evidence that MIG is closely related to responsiveness. However, similar scatter-plots created for FC clearly show that FC does not differentiate between responsive and drowsy groups in neither state.

Diversity and complexity of the EEG signal across consciousness states. A) Data of individual subjects from both groups. Data of each were normalized by subtracting the baseline (wake) value to better depict profiles of changes. B) The same data presented as mean ± SEM without normalization. Results of between-states and between-groups comparisons depicted as: * - p < 0.05; ** - p < 0.01. C) Individual hit-rates from the auditory detection task plotted against changes in diversity/complexity measures (with respect to baseline, as in A). Data of two subjects who became unresponsive already during mild sedation state are plotted as red diamonds (compare to Fig. 1).
Second, we interpret the difference between groups in MIG during moderate sedation as related to behavioral responsiveness, but the groups differ also in terms of propofol concentration in blood. Thus, to further support our interpretation we compared MIG between groups with propofol concentration included as a covariate. We found a significant difference between groups in MIG (F(1) = 9.53, p = 0.007) but the effect of a propofol concentration was not significant (F(1) = 0.48, p=0.49). Therefore, it is unlikely that the between-groups difference in anesthetic concentration can account for the difference in diversity.
Third, for consistency with several previous studies7, 10, 13 which used the Lemepl-Ziv algorithm to estimate signal diversity we also applied this measure to our data. The results of the Lempel-Ziv analysis can be found in the supplementary materials.
Discussion
Measures of neuronal diversity have been recently established as robust markers of the global states of consciousness3-13. However, it is not clear whether the diversity measures indeed reflect consciousness per se, or rather some general and unspecific effects related to a transition between conscious and unconscious states. Here we aimed to address this question in the context of anesthesia by investigating EEG signal diversity and complexity during propofol sedation. Importantly, despite receiving a similar dose of propofol all tested subjects could be divided into two subgroups: responsive, who remained awake throughout the experiment, and drowsy, who became unresponsive and unconscious. We hypothesized that the loss of responsiveness during sedation will be related to a decrease of EEG diversity. This was indeed confirmed, as 6/7 subjects from the drowsy group exhibited a drop in diversity upon loss of responsiveness. However, the unexpected finding is that EEG diversity increased in 12/13 subjects who were sedated but remained responsive. Such a qualitative difference - an increase in diversity in the responsive group and a decrease in the unresponsive group - makes it a robust index of responsiveness and, presumably, consciousness.
Several recent studies demonstrated that general anesthesia is accompanied by a marked decrease of neuronal diversity as estimated by the Lempel-Ziv algorithm9, 10. Further evidence for simplification and reduced repertoire of brain states during anesthesia was provided by studies characterizing brain signals in terms of functional interactions25, long-range temporal correlations26, 27, or using dynamic systems theory measures28-30. Our work adds to the literature by demonstrating this effect using “minimal” contrasts between states and groups. By minimal we mean that, first, we detected a robust decrease in diversity upon loss of responsiveness even though the doses of propofol were low (e.g. in comparison to Sarasso et al.9 and Schartner et al.10). Second, we included also sedated but responsive subjects, who therefore constitute an important “control group” missing from previous experiments. Lack of a diversity decrease in this group further strengthens our conclusion that EEG diversity is closely related to the ability to respond to external stimuli.
Whereas the diversity decrease in the drowsy group during moderate sedation is in line with the published results, an increase in the sedated but responsive group is a surprising finding. Further, during mild sedation and recovery - states when all subjects were sedated but responsive - diversity increase was indeed observed in all subjects (importantly, propofol was still detected in blood samples during recovery; see: Fig. 1). To our knowledge, such an effect has not been reported so far, even though the state of mild sedation has been included in some previous studies. For instance, Schartner et al.10 analyzed EEG recorded during mild propofol sedation, when subjects were partially conscious (Ramsay scale score = 3), but found a decrease in EEG Lempel-Ziv diversity. However, in the study of Schartner and colleagues the average concentration of propofol in blood during mild sedation was 1.9 ± 0.52 mcg/mL, whereas here it was 0.44 ± 0.04 mcg/mL and 0.90 ± 0.06 mcg/mL during mild and moderate sedation, respectively. Further, Huang et al.31 investigated temporal dynamics of BOLD signals with the targeted propofol concentration of 1.3 mcg/mL, whereas Liu et al.32 analyzed entropy of BOLD signals with a targeted propofol level of 0.98 mcg/mL. In neither study an effect, which could be interpreted as an increase in diversity or variability of brain activity has been found which, most likely, is due to lower sensitivity of fMRI (in comparison to EEG). However, increased signal diversity has been observed during psychedelic states induced by LSD, ketamine, or psilocybin13-15. This provided first evidence that not only decreases, but also increases of signal diversity with respect to the values observed during resting wakefulness, are in principle possible. Our finding adds to this body of evidence by showing this effect is not specific to psychedelic states only.
What is the neurophysiological mechanism behind changes in EEG diversity? While the decrease in diversity in the drowsy group might be related to the occurrence of slow-waves, it is well established that the slow-wave activity occurs mainly during deeper stages of anesthesia, which were not reached here33-35. Another hypothesis, which might explain both decreases and increases in diversity, is related to changes in the higher frequency bands. Low anesthetic doses were reported to induce an increase in the beta/gamma bands amplitude (EEG: 36, modeling: 37). This effect is considered to represent an initial paradoxical excitation caused by an anesthetic and might potentially result in a diversity increase. However, at higher doses coherent alpha band oscillations occur over centro-frontal regions, and this might result in a more regular and less diverse EEG signal (EEG: 34, 35, 38; modeling: 39). Further, during mild sedation synchronization of fMRI BOLD signals within local brain regions increases, but at the same time functional connectivity between distant brain regions decreases31. Such a greater independence of local brain regions might also be reflected by greater diversity. Nevertheless, the precise neurophysiological mechanism of diversity changes remains to be investigated.
In the present study we demonstrate that EEG diversity is closely related to the ability to recognize and respond to auditory stimuli, which was used as a proxy for consciousness. Is there any other evidence that signal diversity measures correlates with consciousness per se? First, different anesthetics have different mechanisms of action but all suppress consciousness40. Therefore, one might compare changes in brain activity under different anesthetics with a rationale that genuine correlates of loss and recovery of consciousness should be common across anesthetics41, 42. Diversity measures have been indeed shown to decrease irrespective of the anesthetic agent used3, 9. Second, unresponsive but potentially conscious states – like ketamine sedation or REM sleep - provide an opportunity to identify correlates of consciousness independent of responsiveness. In a study of Sarasso et al.9 during ketamine anesthesia subjects experienced vivid dreams and hallucinations and, indeed, a very subtle drop in diversity during ketamine anesthesia was observed (in contrast to propofol and xenon anesthesia). Further, Schartner et al.7 found that only NREM sleep is related to decreases in signal diversity, whereas during REM sleep – a state when dreams occur most frequently43 – neuronal diversity is similar to wakefulness. Thus, these initial studies indicate that signal diversity might be indeed a sensitive index of subjective experience, independent of perception and responsiveness.
In the present analysis diversity of EEG signals was estimated by the Mean Information Gain (MIG), which is an information theory measure19. However, multiple previous studies established the Lemepl-Ziv algorithm as a robust correlate of the global conscious states3, 5-10. Therefore, we also calculated the Lemepl-Ziv diversity to compare it with MIG (results reported in the supplementary materials). While both measures behaved in a qualitatively similar way, MIG seems to distinguish responsive and drowsy groups more robustly, and only MIG increased significantly during mild sedation and recovery. Greater sensitivity of MIG might be explained by the fact that, for consistency with previous studies, MIG was applied to the EEG signal15, 21, whereas LZs was applied to the signal envelopes7. Further, Lempel-Ziv was used in two versions, to estimate diversity of either temporal (LZs) or spatio-temporal (LZc) patterns. Our results demonstrate that only LZs, but not LZc, was sensitive enough to distinguish between responsive and drowsy groups. This suggests that temporal (rather than spatial) diversity of brain activity is the key aspect and should be the focus of future studies.
Nevertheless, it is important to keep in mind that both MIG and Lempel-Ziv are measures of signal diversity, defined as randomness or entropy of the data, and not complexity, understood as a state intermediate between order and randomness. Therefore, in our study a measure of complexity, namely Fluctuation Complexity (FC), was also included. FC has been proved capable of robustly differentiating states of anesthesia and wakefulness15. However, FC decreased only during mild and not during moderate sedation, and it did not distinguish responsive and drowsy subjects (Fig. 2). Lack of a reliable complexity decrease during loss of responsiveness might be related to the fact, that moving from low diversity to higher diversity causes an increase in complexity (i.e. moving towards the peak of the inverted “U” shape, see: Fig. S1). Therefore, our analysis suggests that subjects’ behavioral state during propofol sedation is better represented by diversity than complexity of the EEG signal.
In summary, by comparing responsive and unresponsive subjects during propofol sedation we provide further evidence that neuronal diversity is a promising correlate of responsiveness. It remains to be investigated to what extent it is related to the subjective experience.
Footnotes
Funding statement:This study was funded by Sonata grant from the National Science Centre Poland (2015/17/D/HS6/00269) and Iuventus Plus grant from the Polish Ministry of Science and Higher Education (082/IP3/2016/74). MB was additionally supported by a stipend from the Polish Ministry of Science and Higher Education (555/STYP/11/2016).
Conflict of interest: The authors declare no competing interests.
Author Contributions:Conceived the study: MB; Analyzed data: PO, MB; Contributed analysis methods: MP; Interpreted data: MB, AM; Wrote the paper: MB. Revised the paper: MB, AM.
References


