

Abstract
The rise and fall of estrogen and progesterone across menstrual cycles and during pregnancy controls breast development and modifies cancer risk. How these hormones uniquely impact each cell type in the breast is not well understood, because many of their effects are indirect–only a fraction of cells express hormone receptors. Here, we use single-cell transcriptional analysis to reconstruct in silico trajectories of the response to cycling hormones in the human breast. We find that during the menstrual cycle, rising estrogen and progesterone levels drive two distinct paracrine signaling states in hormone-responsive cells. These paracrine signals trigger a cascade of secondary responses in other cell types, including an “involution” transcriptional signature, extracellular matrix remodeling, angiogenesis, and a switch between a pro- and anti-inflammatory immune microenvironment. We observed similar cell state changes in women using hormonal contraceptives. We additionally find that history of prior pregnancy alters epithelial composition, increasing the proportion of myoepithelial cells and decreasing the proportion of hormone-responsive cells. These results provide systems-level insight into the links between hormone cycling and breast cancer risk.
Introduction
The rise and fall of estrogen and progesterone with each menstrual cycle and during pregnancy controls cell growth, survival, and tissue morphology in the breast. The impact of these changes is profound, and lifetime exposure to cycling hormones is a major modifier of breast cancer risk. Each additional year of menstrual cycling due to early age of menarche or late menopause leads to a 3–5% increased risk of breast cancer (Collaborative Group on Hormonal Factors in Breast Cancer, 2012). In contrast, pregnancy has two opposing effects on breast cancer risk: it increases the short-term risk by up to 25% (Lambe et al., 1994), but decreases lifetime risk by up to 50% for early pregnancies (Britt et al., 2007). Multiple mechanisms have been proposed to explain the opposing effects of pregnancy on breast cancer risk. The direct link between pregnancy and the long-term reduction in risk remains an open question, but has been attributed to the effects of pregnancy-induced lobuloalveolar differentiation, including a decrease in the hormone-responsiveness of the epithelium and reduced frequency of tumor-susceptible cell populations (Britt et al., 2007; Russo et al., 1992). In contrast, stromal as well as epithelial changes are thought to drive the increased short-term risk following pregnancy. High hormone levels during pregnancy and lactation promote growth in cells with preexisting oncogenic mutations (Haricharan et al., 2013). Following lactation, involution drives a suite of stromal changes that have been proposed to provide a favorable tumor microenvironment, including extracellular matrix (ECM) remodeling, recruitment of phagocytic M2-like macrophages, and increased angiogenesis (Lyons et al., 2011; O’Brien et al., 2010; Schedin et al., 2007).
While the cellular and molecular changes that occur during pregnancy and involution have been well-studied, particularly in mice, far less is known about the underlying mechanisms that link breast cancer risk and menstrual cycling. The menstrual cycle is characterized by alternating periods of epithelial expansion and regression (Anderson et al., 1982; Söderqvist et al., 1997), and histological analyses of paraffin-embedded human tissue sections have identified alterations in epithelial architecture and stromal organization (Ramakrishnan et al., 2002; Vogel et al., 1981). However, a systems-level understanding of how different cell populations respond to cycling hormone levels, and whether these responses parallel those observed during pregnancy and involution, remains unclear.
One major barrier to understanding the mechanistic links between the menstrual cycle and breast cancer risk is that many of the effects of hormone signaling within the breast are indirect. The estrogen and progesterone receptors (ER/PR) are expressed in only 10–15% of luminal cells within the epithelium, known as hormone-responsive or hormone-receptor positive (HR+) luminal cells (Clarke et al., 1997). Thus, most of the effects of hormone receptor activation are mediated by a complex cascade of paracrine signaling events. In addition to HR+ luminal cells, the human breast comprises two other epithelial cell types—hormone-insensitive (HR−) luminal cells (also termed luminal progenitors), which are the secretory cells that produce milk during lactation, and myoepithelial cells, which contract to move milk through the ducts—as well as multiple stromal cell types including fibroblasts, adipocytes, immune cells, and endothelial cells. Each of these populations is likely affected by paracrine signaling downstream of hormone receptor activation, with distinct effects in each cell type. Additional barriers to understanding the effect of hormone signaling include major differences in glandular architecture and stromal composition and complexity between humans and model organisms like the mouse (Dontu and Ince, 2015; Parmar and Cunha, 2004). Notably, ER expression is restricted to the epithelium in humans but is also expressed in the stroma in rodents (Mueller et al., 2002; Palmieri et al., 2004). Thus, understanding the consequences of epithelial-stromal crosstalk downstream of estrogen and progesterone requires studying these processes in humans or human models.
A second challenge for understanding the role of estrogen and progesterone in breast cancer risk is that the dynamic rise and fall of hormones may be as important as absolute levels: although each additional year of menstrual cycling increases the risk of breast cancer, serum hormone levels do not themselves directly correlate with risk (Schernhammer et al., 2013). Despite this, prior studies have not directly investigated the effects of hormone dynamics on cell state across all cell types in the breast. One barrier is the marked differences in hormone levels and kinetics (4–5 versus 28 days) between the rodent estrous cycle and human menstrual cycle (Dontu and Ince, 2015). While a human explant model has been developed to more accurately capture the acute response of the human breast to hormone treatment (Tanos et al., 2013), this models remains limited to relatively short ~24h treatments with estrogen and progesterone and is not fully integrated with the vascular and immune compartments. It is therefore unclear how well both mouse models and human tissue explants recapitulate the full time course and spectrum of cellular interactions that define the human menstrual cycle in vivo. As it enables unbiased analysis of the full repertoire of cell types within the human mammary gland, single-cell RNA sequencing (scRNAseq) is particularly well-suited to investigate this problem. Despite this, prior scRNAseq studies in human have primarily focused on the epithelium, and have not examined the response to hormone receptor activation (Nguyen et al., 2018).
Here, we use scRNAseq to trace the transcriptional changes that occur in the human breast in response to cycling hormone levels, using healthy tissue from a cohort of reduction mammoplasty patients. Since hormone receptors are master regulators of breast development, we hypothesized that pregnancy history and menstrual cycle stage would be the major sources of variability between specimens (Figure 1A). Therefore, we first compared the transcriptional profile of nulliparous and parous women and identified major changes in the cellular composition of the breast following pregnancy. We found that prior history of pregnancy was associated with striking changes in epithelial composition, and we propose that these changes are consistent with the protective effect of pregnancy on lifetime breast cancer risk. By decoupling these effects of pregnancy on cell proportions, we then used menstrual cycle staging and pseudotemporal analysis to map cell state changes in response to fluctuating hormone levels across the menstrual cycle, and used “virtual experiments” in an additional cohort of patients with hormonal contraceptive use at the time of surgery to confirm key findings. We found that the changing hormonal microenvironment across the menstrual cycle led to wide-ranging cell state changes in both the epithelium and stroma. In addition to transcriptional signatures consistent with tissue expansion and remodeling, we uncovered changes that mimic those seen during postpartum involution (Lyons et al., 2011; O’Brien et al., 2010; Schedin et al., 2007). Thus, our findings suggest that similar mechanisms contribute to both the short-term increased breast cancer risk following pregnancy and the lifetime increased risk due to total number of menstrual cycles. Overall, these results provide a comprehensive map of the cycling human breast and identify the cellular changes that underlie breast cancer risk.

(A) Overview of approach: We predicted that pregnancy history and menstrual cycle stage would be the two the major sources of variability between reduction mammoplasty samples, and that scRNA analysis of nulliparous and parous women from different stages of the menstrual cycle could identify pregnancy-related changes in the breast and map transcriptional state to changing hormone levels across the menstrual cycle. (B) Schematic of scRNAseq workflow: Reduction mammoplasty samples were processed to a single cell suspension, followed by FACS purification and scRNAseq. (C) TSNE dimensionality reduction and KNN clustering of the combined data from all five samples. (D) Left: Hierarchical clustering of each cell type based on the log-transformed mean expression profile, along with their putative identities (Spearman’s correlation, Ward linkage). Right: pseudocolored H&E section and simplified diagram depicting the organization of the human mammary gland. (E) Heatmap highlighting marker genes used to identify each cell type. For visualization purposes, we randomly selected 100 cells from each cluster.
Results
scRNAseq identifies three major epithelial and four major stromal cell types in the human breast
To determine how cycling estrogen and progesterone levels affect cell composition and cell state in the human breast, we performed scRNAseq on 43,021 cells collected from reduction mammoplasties from five age-matched, premenopausal donors without hormonal contraceptive use (Table S1, Figure 1B). To obtain an unbiased snapshot of both the epithelium and stroma, we collected live/singlet cells identified on the basis of forward and side scatter and lack of DAPI staining. For four samples, we additionally collected purified luminal and myoepithelial cells to provide additional confirmation of downstream clustering results (Figure S1A). We used the 10X Chromium system to prepare cell-barcoded cDNA libraries and sequenced approximately 3,000 cells per sample and sort condition (Table S2).
To investigate how the proportion and transcriptional state of each cell type changed in response to hormone levels, we first identified the major cell types present within the human breast. Sorted luminal and myoepithelial cell populations were enriched for the epithelial keratins KRT19 and KRT14, respectively (Figure S1B), and were well-resolved by TSNE dimensionality reduction (Figure S1C). Unbiased clustering identified three main epithelial populations—one myoepithelial cell type (C1) and two luminal cell types (C2-C3)—and four stromal populations (C4-C7) (Figure 1C). Hierarchical clustering and marker analysis identified the three epithelial populations as myoepithelial, hormone-responsive (HR+) luminal, and hormone-insensitive (HR−) luminal cells, and the four stromal populations as fibroblast, endothelial, vascular accessory, and immune cells (Figures 1D-E, Figure S1D-E). HR+ luminal cells expressed hormone receptors (ESR1/PGR) and markers such as amphiregulin (AREG) (Figure 1E, Figure S1F) (Ciarloni et al., 2007; Fridriksdottir et al., 2015). The HR+ luminal and HR− luminal clusters described here closely match the two luminal cell populations identified by a previous scRNAseq analysis of the human breast (Nguyen et al., 2018). The authors reported that the transcriptional signatures for these two populations most closely matched microarray expression data for what has been termed EpCAM+/CD49f− “mature luminal cells” and EpCAM+/CD49f+ “luminal progenitors” (Lim et al., 2009; 2010). As recent mouse data suggests that the ER+ and ER− cell populations are maintained by independent lineage-restricted progenitors (Van Keymeulen et al., 2017; Wang et al., 2017), we propose the nomenclature “hormone-responsive/HR+ luminal” and “hormone-insensitive/HR− luminal” for these two cell types.
Parity leads to a change in epithelial composition
The breast undergoes numerous changes during pregnancy and involution, and we hypothesized that these changes would be a major driver of sample-to-sample variability in our dataset. To identify a parity signature, we focused our initial analysis on the 14,797 cells in the live/singlet sort gate to get an unbiased view of how the overall composition of the breast changed with history of pregnancy. Based on clustering results, we observed a striking change in epithelial composition in parous women, characterized by an increase in the proportion of myoepithelial cells within the epithelium and a decrease in the proportion of HR+ luminal cells within the luminal compartment (Figure 2A).

(A) TSNE plot of aggregated live/singlet cells from nulliparous (RM263, RM272, RM273) and parous (RM264 RM284) samples, with the percent of each epithelial cell type highlighted. (B) FACS analysis of the percent of EpCAM−/CD49fhigh myoepithelial cells within the Lin− epithelial population in nulliparous or parous samples. (C) Samples were immunostained with the myoepithelial marker p63 and pan-luminal marker KRT7, and the ratio of p63+ myoepithelial cells to KRT7+ luminal cells was quantified for the indicated samples. Scale bars 50 μm. (D) TSNE plot highlighting aggregated cells from nulliparous or parous samples in the luminal sort gate, with the percent of each luminal cell type highlighted. (E) Samples were immunostained with KRT23, KRT7 and ER, and the percent of ER+ cells within the KRT23− (HR-) and KRT23+ (HR+) luminal cell populations was quantified. Scale bars 100 μm. (F) Parous or nulliparous samples were immunostained with KRT23 and KRT7, and the percent of KRT23+ cells within the luminal cell population was quantified. Scale bars 50 μm. (G) Prior history of pregnancy led to an increase in the proportion of myoepithelial cells and decrease in the proportion of HR+ luminal cells in the human breast. We predicted that menstrual cycle stage would introduce a second major source of transcriptional variation in the human breast. (H) Representative images of H&E stained sections and predicted menstrual cycle stage based on blinded morphological analysis. Scale bars 100 μm. (I) Left: Schematic depicting the earth mover’s distance (EMD) between two samples. Right: Heatmap representing the EMD for each pair of samples. Samples were ordered using complete linkage hierarchical clustering. (J) Pseudotime ordering of HR+ luminal cells from the indicated samples and density plot depicting the relative frequency of each sample along inferred pseudotime.
We confirmed the increase in myoepithelial proportions by flow cytometry analysis of EpCAM and CD49f expression in 10 additional women. Parity was associated with an increase in the average proportion of myoepithelial cells from 18% to 44% of the epithelium (Figure 2B). The myoepithelial cell fraction correlated with pregnancy history (R2 > 0.8) but not with other discriminating factors such as race, body mass index (BMI), or age (Figure 2B, S2A). As FACS processing steps may affect tissue composition, we performed two additional analyses. First, we reanalyzed a previously published microarray dataset from total RNA isolated from breast core needle biopsies (Peri et al., 2012), and found a significant increase in the myoepithelial markers TP63, KRT5, and KRT14 relative to luminal keratins (Table S3). Second, we performed immunohistochemistry on matched formalin-fixed, paraffin-embedded tissue. Staining for the myoepithelial marker p63 and luminal KRT7 confirmed a significant increase in the ratio of p63+ myoepithelial cells to KRT7+ luminal cells in intact tissue sections (Figure 2C).
We next analyzed our clustering results from the 11,410 cells in the luminal sort gate to confirm the decreased frequency of HR+ versus HR− luminal cells we observed in the live/singlet gate. While the separation between the hormone-responsive and hormone-insensitive luminal cell populations is not always distinct by FACS (Figure S1A) (Lim et al., 2010), transcriptome analysis clearly distinguished between these two cell types and demonstrated a marked increase in the proportion of HR− luminal cells relative to HR+ luminal cells in parous samples (Figure 2D). To verify these results in intact tissue sections, we performed immunohistochemistry for ER and PR. There was a trend toward decreased expression of both receptors in parous samples, although only the change in double-positive ER+/PR+ cells was statistically significant (Figure S2B). This is consistent with previous studies which consistently found decreased expression of ER and/or PR in parous samples, but with varying degrees of statistical significance (Battersby et al., 1992; Muenst et al., 2017; Taylor et al., 2009). We speculate that this variability is due to changes in ER and PR expression, stability, and nuclear localization across the menstrual cycle based on hormone receptor activation status (Battersby et al., 1992; Métivier et al., 2003; Petz and Nardulli, 2000). Supporting this, we found that although ER transcript and protein levels correlate across tissue sections, they do not correlate on a per-cell basis (Figure S2C). Therefore, we sought to identify another marker to more reliably distinguish between HR+ and HR− cell populations, and identified keratin 23 (KRT23) as highly enriched in HR− cells (Figure S2D), as was also reported by a previous scRNAseq study (Nguyen et al., 2018). Immunohistochemistry for KRT23 and ER confirmed that these two proteins are expressed in mutually exclusive populations (Figure 2E). KRT23 thus represents a discriminatory marker between the two luminal populations that does not fluctuate with hormone signaling as the receptors themselves do. Staining for KRT23 in intact tissue sections confirmed a significant increase in KRT23+ HR− luminal cells from 7% to 21% in parous samples (Figure 2F). Together, these results demonstrate a striking change in epithelial composition with parity (Figure 2G).
Pseudotemporal analysis of individual epithelial cell types orders samples according to menstrual cycle stage
As hormone signaling controls breast development during each menstrual cycle in addition to pregnancy, we predicted that menstrual cycle stage would be a second major source of variability between samples (Figure 2G). We used previously described morphological criteria to stage each sample along the menstrual cycle (Longacre and Bartow, 1986; Ramakrishnan et al., 2002). Blinded analysis placed three samples in the follicular phase (stages I-II) and two in the luteal phase (stages III-IV) (Figure 2H). We confirmed this staging using a previously published bulk RNA sequencing dataset (Pardo et al., 2014) to develop an average menstrual cycle score for each sample (Figure S2E, Table S4). Additionally, since PR is upregulated following estrogen exposure, we predicted that samples in the luteal phase would have a higher proportion of PR+ cells. To normalize the effects of parity on the proportion of HR+ luminal cells, we quantified the percentage of PR+ cells within the KRT7+/KRT23− HR+ luminal cell population in our five sequenced samples and found a significant increase in the percentage of PR+ cells in the luteal phase of the menstrual cycle (Figure S2F). Finally, as a measure of transcriptional variation between each sequenced sample, we quantified the earth mover’s distance (EMD) between each sample in principal component (PC) space, representing the minimum cost of moving one distribution onto another. We chose this approach rather than distance-based similarity metrics since EMD measures the transcriptional variation between entire cell populations—containing multiple cell types—rather than between individual cells. Using hierarchical clustering of the EMD results, we found that samples were grouped according to their predicted menstrual cycle stage (Figure 2I). Thus, the transcriptional differences observed between samples mapped directly onto changes in hormone signaling state that vary with menstrual cycle stage.
To understand how HR+ luminal cells change across the menstrual cycle, we performed pseudotemporal ordering of single cells along a cell state trajectory (Trapnell et al., 2014). Strikingly, this temporal ordering matched the predicted menstrual cycle stage for each sample based on morphological and transcriptional analysis (Figure 2J). To test whether hormone cycling also drives transcriptional changes within a non-hormone-responsive cell population via paracrine signaling, we performed a similar analysis in myoepithelial cells. As in the HR+ population, ordering of single myoepithelial cells placed each sample according to its predicted menstrual cycle stage (Figure S2G). Together, these data demonstrate that hormone levels and their paracrine signaling effectors are the major driver of transcriptional changes—and inter-sample variability—within both hormone-responsive and hormone-insensitive cell populations.
Two transcriptional states emerge in hormone-responsive luminal cells as estrogen and progesterone levels increase
Pseudotime analysis revealed that the HR+ luminal population transitioned from one to two distinct transcriptional states as progesterone increased in the luteal phase (Fig 2J). To investigate these diverging cell states, we used principal component analysis (PCA) and non-negative matrix factorization (NMF) to perform detailed sub-clustering analysis on the HR+ cell population. We chose NMF because this clustering method most accurately distinguishes between groups of cells with high similarity (Zhu et al., 2017), as is the case for classifying cell signaling states rather than distinct cell types. We identified three clusters of HR+ luminal cells (Figure 3A, Figure S3A-B). Each cluster primarily localized to one branch of the pseudotime trajectory (Figure 3B), representing one cell state enriched in the follicular phase (HR+ 1) and two cell states enriched in the luteal phase (HR+ 2 and 3) (Figure 3C, Figure S3C). Notably, all three clusters were present in the early luteal phase, suggesting that both HR+2 and HR+3 emerged simultaneously as estrogen and progesterone levels increased. In support of this, we used the Velocyto tool (La Manno et al., 2018) and found that RNA velocity estimation predicted a similar bifurcating cell state trajectory as subclustering and Monocle analysis (Figure S3D).

(A) PCA and clustering of aggregated data from all samples identified three cell states in HR+ luminal cells. (B) Pseudotime analysis revealed a bifurcating trajectory in HR+ luminal cells from one to two cell states. (C) Frequency of each cell state across the menstrual cycle. (D) Heatmap of genes with pseudotime-dependent changes in gene expression. (E) Heatmap of genes with branch-specific, pseudotime-dependent changes in gene expression. (F) Bar chart and feature plot depicting the log-normalized expression of LRRC26 or P4HA1. (G) Immunostaining for LRRC26 and KRT7 in the indicated samples and quantification of the percent of LRRC26+ luminal cells. Scale bars 50 μm. (H) Immunostaining for LRRC26, P4HA1, and KRT7 and quantification of the relative intensity of P4HA1 signal in LRRC26-/KRT7+ and LRRC26+/KRT7+ regions of interest. Scale bars 20 μm. See also Figure S3F. (I) High estrogen and progesterone levels drive the emergence of two cell states in HR+ luminal cells. One cell state expresses high levels of paracrine factors such as RANKL and WNT4 that signal to the surrounding epithelium, and the second expresses high levels of VEGFA and other stromal paracrine factors.
We next used pseudotime ordering to identify genes that changed as HR+ cells transitioned from the follicular to the luteal phase (Figure 3D). Upregulated transcripts across both luteal-phase cell states included previously described ER targets such as amphiregulin (AREG) (Ciarloni et al., 2007) and the trefoil factors TFF1 and TFF3 (May and Westley, 2015; Rio et al., 1987), transcription factors associated with luminal differentiation such as ID2 (Seong et al., 2018) and HES1 (Bouras et al., 2008), and chemokines such as CXCL13 and CXCL3. This analysis also identified genes with branch-specific changes in gene expression levels (Figure 3E). In the HR+2 branch, we found upregulation of RANK ligand (TNFSF11) and WNT4, which are well-characterized downstream mediators of progesterone receptor activation that signal to myoepithelial cells and HR− luminal cells (Joshi et al., 2015; Tanos et al., 2013). The HR+ 3 branch was characterized by expression of the PR targets KLF4 (Shimizu et al., 2010) and SOX4 (Graham et al., 1999), as well as upregulation of a hypoxia gene signature and pro-angiogenic factors such as VEGFA and ANGPTL4. Interestingly, a previous study using microdialysis of healthy human breast tissue found that VEGF levels increased in the luteal phase of the menstrual cycle (Dabrosin, 2003). As estrogen response elements have been identified in the 5’ and 3’ untranslated regions of the VEGFA gene (Hyder et al., 2000), our results suggest that this increased expression is, in part, a direct effect of hormone signaling to a subpopulation of HR+ luminal cells.
To confirm these results in vivo, we performed marker analysis to identify genes specific to each cluster that could be used for immunohistochemical staining (Figure S3E). We identified LRRC26 as a marker of the WNT4/RANKL-expressing cluster HR+ 2 and P4HA1 as a marker of the hypoxia/pro-angiogenic cluster HR+ 3 (Figure 3F). To directly test whether the luteal-phase cell states were a result of estrogen and progesterone signaling, we performed immunostaining in additional tissue sections from donors using progestin-based or combined estrogen/progestin-based forms of hormonal contraceptives (Table S5). LRRC26 protein expression was upregulated in both the luteal phase and in women using hormonal contraception (Figure 3G) and marks a distinct set of luminal cells from P4HA1 (Figure 3H, Figure S3F). Moreover, these two subpopulations co-occurred within the same regions of the breast, demonstrating that they are not an artifact of sample processing. Together, these results demonstrate that high estrogen and progesterone in the luteal phase reveal two diverging transcriptional states in HR+ cells, one that signals via RANK ligand and WNT4 to the surrounding epithelium and a second that, in part, signals to the surrounding vasculature via VEGF signaling (Figure 3I).
Paracrine effects of hormone signaling in hormone-insensitive epithelial cells
To investigate cell state changes in hormone-insensitive epithelial populations downstream of paracrine signaling from HR+ luminal cells, we performed sub-clustering analysis on myoepithelial cells and HR− luminal cells as described above. NMF identified two subpopulations of myoepithelial cells (Figure 4A, Figure S4A-B), which represented a switch in cell states between the follicular phase (MEP 1) and the luteal phase (MEP 2) of the menstrual cycle (Figure 4B, Figure S4C). Marker analysis (Figure S4D) and gene set enrichment analysis (Subramanian et al., 2005) of differentially expressed genes identified signaling pathways upregulated in each phase of the menstrual cycle. Similar to the HR+ 3 subcluster of hormone-responsive cells, myoepithelial cells in the luteal phase had enrichment of transcripts involved in hypoxia and angiogenesis such as VEGFA and ANGPTL4 (Figure 4C). Luteal-phase myoepithelial cells were also enriched for signaling pathways involved in epithelial-mesenchymal transition (EMT) (TPM2, MYL9, ACTA2/SMA) and anchoring junction proteins (DST, ACTN1), suggesting that changes in actomyosin contractility and cell-ECM interactions partly underlie the morphological changes seen in the breast epithelium across the menstrual cycle (Figure 4C). Follicular-phase myoepithelial cells were enriched for pathways involved in ribosome biogenesis and protein synthesis, including Myc target genes (Figure S4E).

(A) PCA and clustering identified two cell states in myoepithelial cells. (B) Frequency of each cell state across the menstrual cycle in myoepithelial cells. (C) Volcano plot for genes differentially expressed between the luteal- and follicular-phases in myoepithelial cells and bar chart of the ten most significantly enriched gene sets in the luteal phase. (D) PCA and clustering of aggregated data identified three cell states in HR− luminal cells. (E) Frequency of each cell state across the menstrual cycle in HR− luminal cells (F) Genes differentially expressed between the luteal- and follicular-phases in HR− luminal cells and the ten most significantly enriched gene sets in the luteal phase. (G) Genes differentially expressed between the early- and late-follicular phases in HR− luminal cells and the ten most significantly enriched gene sets in each phase. (H) Log-normalized expression of CD14 and MARCO in the indicated HR− luminal clusters. (I) Log normalized expression of the WNT effector TCF7 in the indicated cell types. (J) Immunostaining for the pan-luminal marker KRT7, TCF7, and the basal marker p63 or HR− luminal cell marker KRT23 in samples from the indicated menstrual cycle phase and quantification of the percent of TCF7+ myoepithelial (p63+/KRT7−) or HR− luminal (KRT23+/KRT7+) cells. Scale bars 50 μm. (K) Paracrine signaling from HR+ luminal cells drives WNT activation and the additional indicated gene expression programs in myoepithelial cells and HR− luminal cells. HR− luminal cells in the early follicular phase upregulate a transcriptional signature that parallels postpartum involution.
A similar analysis in HR− luminal cells identified three subpopulations (Figure 4D, Figures S4F-G). As in myoepithelial cells, there was a switch in cell states between the follicular and luteal phases of the menstrual cycle, with one subpopulation enriched in the early follicular phase (stage I), one in the late follicular phase (stage II), and one in the luteal phase (stages III-IV) (Figure 4E, Figure S4H). Similar to other epithelial cell types, signaling pathways associated with hypoxia were upregulated in luteal-phase hormone-insensitive cells. The luteal phase was also associated with hallmarks of TNF-alpha signaling, including increased expression of TNFAIP6 and CCL4 (Figure 4F, Figure S4I). TNF itself was upregulated in both the luteal phase and the early follicular phase that immediately follows, suggesting that the TNF-alpha signature represented an autocrine signaling response (Figure S4J). Comparison of the early and late follicular phases uncovered a transcriptional signature in the early follicular phase that was similar to that identified during post-lactational involution (Clarkson et al., 2004; Stein et al., 2004). This “involution” gene signature was characterized by upregulation of death receptor ligands such as TNFSF10 (TRAIL) and of genes involved in the defense and immune response including the acute phase genes SAA1/2 and LCN2, complement components CFB and C1R, and the immunoglobulin-related gene LTF (Figure 4G). Moreover, expression of the phagocytic receptors CD14 and MARCO in this cluster suggests that HR− cells play a role as non-professional phagocytes in the clearance of apoptotic cells during the early follicular phase (Figure 4H), similar to what has been described during involution (Monks et al., 2008).
Finally, based on our finding that a subset of HR+ luminal cells upregulated WNT4 in the luteal phase, we examined whether canonical WNT signaling was activated in luteal-phase myoepithelial cells and HR− luminal cells. Additionally, to test whether WNT activation was a result of estrogen and progesterone signaling, we performed immunostaining in tissue sections from donors using progestin-based or combined estrogen/progestin-based forms of hormonal contraception. The WNT effector TCF7 was upregulated in both cell types during the luteal phase (Figure 4I). Staining in matched tissue sections confirmed that TCF7 protein is expressed in a majority of myoepithelial cells (~70%) and a subset of HR− luminal cells (~4%) both in the luteal phase and following hormonal contraceptive use (Figure 4J). Together, these data demonstrate that paracrine signaling following hormone receptor activation leads to a dramatic change in cell state in hormone-insensitive epithelial cell populations (Figure 4K). Moreover, in HR− luminal cells, the early follicular phase is characterized by an “involution” transcriptional signature that closely mimics changes seen during post-lactational mammary gland regression, suggesting that similar mechanisms control both processes.
Paracrine signaling downstream of hormone receptor activation supports a proangiogenic microenvironment in the luteal phase
Expression of pro-angiogenic factors such as VEGFA, TNF, and ANGPTL4 from both hormone-responsive and hormone-insensitive cell types was increased in the luteal phase, suggesting that there was a switch to a proangiogenic microenvironment as estrogen and progesterone levels increased. To test this prediction, we performed sub-clustering analysis to dissect the changes that occur in endothelial cells across the menstrual cycle and identified two distinct endothelial populations (Figure 5A) that represented vascular or lymphatic endothelial cells, based on expression of the markers PDPN and PLVAP (Figure 5B) (Hirakawa et al., 2003; Niemelä et al., 2005). Within the lymphatic endothelium, sub-clustering identified a change in transcriptional states between the follicular and luteal phases of the menstrual cycle (Figure 5C, Figure 5A-B), characterized by upregulation of pathways involved in TNF-alpha signaling, hypoxia, and EMT in the luteal phase (Figure 5D, Figure S5C). A similar analysis in vascular endothelial cells identified three cell states representing cells in the follicular, early luteal, and late luteal phases (Figure 5E, Figures S5D-E). Vascular endothelial cells in the early luteal phase were enriched for genes associated with angiogenesis and blood vessel remodeling including PGF, EDN1, and VEGF receptors. Similar to the lymphatic endothelium, vascular endothelial cells in the late luteal phase had enrichment of pathways involved in EMT, hypoxia, and TNF-alpha signaling (Figure 5F, Figure S5F). Two VEGF receptors control angiogenesis: previous studies demonstrated that KDR promotes endothelial sprouting in response to VEGF and FLT1 antagonizes this response (Jakobsson et al., 2010). We found that expression of KDR was restricted to the early luteal phase, whereas FLT1 was expressed in both the early and late luteal phases (Figure 5G). Along with gene set enrichment analyses, these results suggest that new blood vessel formation mainly occurs at the beginning of the luteal phase and is followed by blood vessel remodeling or maturation in the late luteal phase.
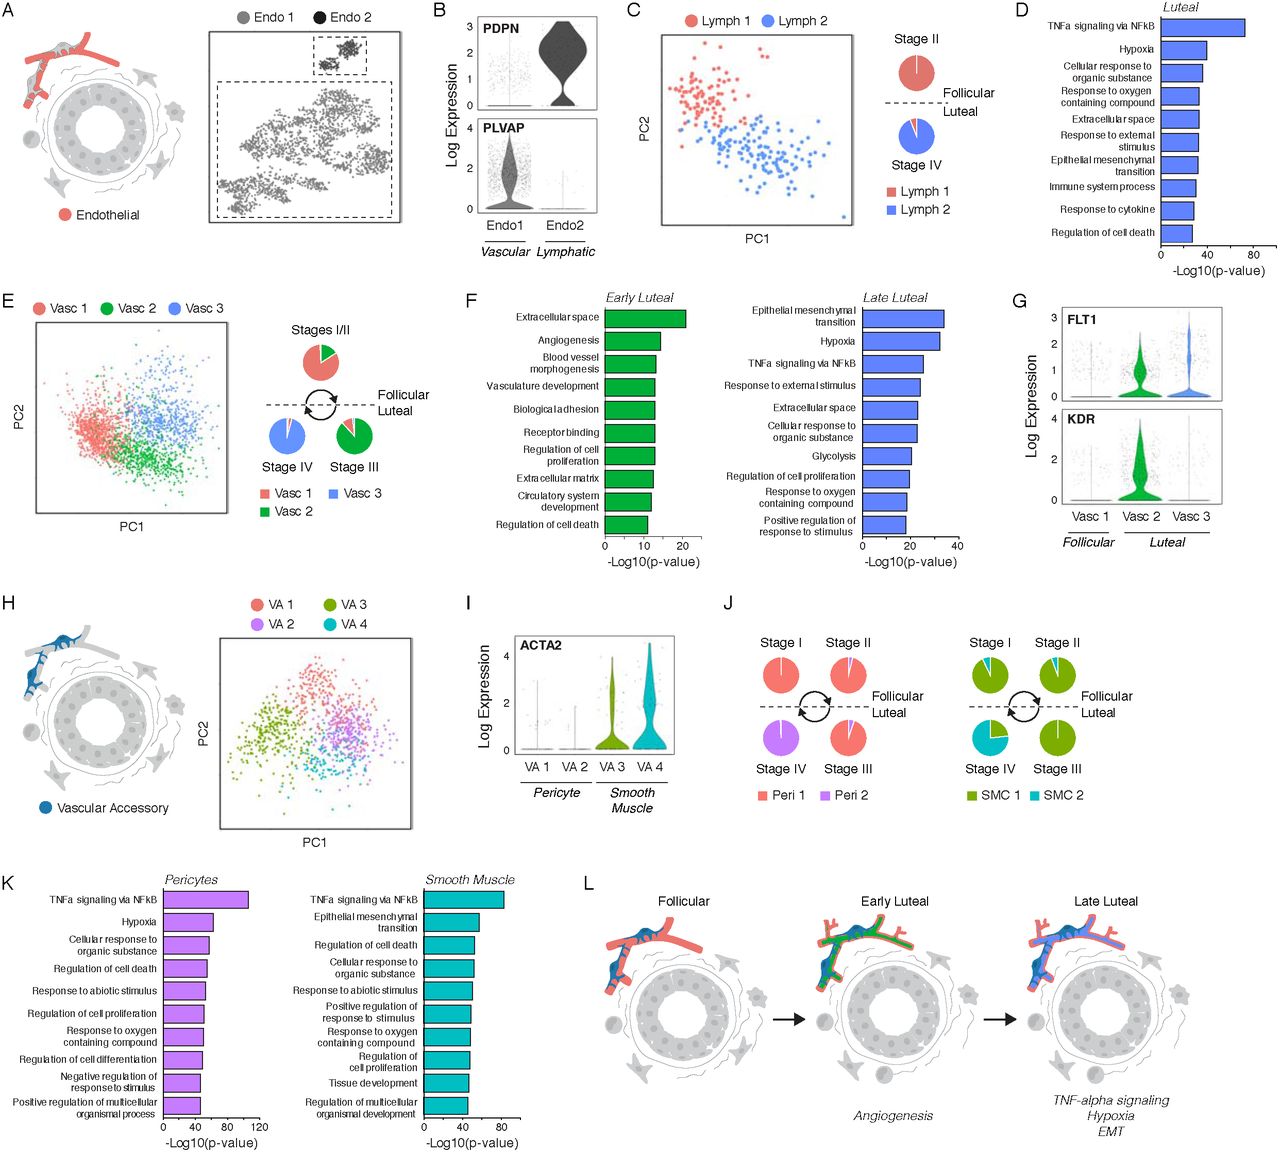
(A) Clustering identified two endothelial cell types. (B) Log-normalized expression of blood or lymphatic endothelial markers PLVAP and PDPN in the indicated endothelial cell clusters. (C) Left: PCA and sub-clustering identified two cell states in lymphatic endothelial cells. Right: Frequency of each cell state across the menstrual cycle. (D) Bar chart of the ten most significantly enriched gene sets in the luteal phase in lymphatic endothelial cells. (E) Left: Sub-clustering identified three cell states in blood endothelial cells. Right: Frequency of each cell state across the menstrual cycle. (F) Ten most significantly enriched gene sets in blood endothelial cells in the early (left) or late (right) luteal phase. (G) Log-normalized expression of the VEGF receptors FLT1 and KDR in the indicated blood endothelial cell clusters. (H) Sub-clustering identified four cell states in vascular accessory cells. (I) Log-normalized expression of the smooth muscle marker ACTA2 in the indicated vascular accessory cell clusters. (J) Frequency of each cell state across the menstrual cycle in pericytes (left) or smooth muscle cells (right). (K) Ten most significantly enriched gene sets in the luteal phase for pericytes (left) or smooth muscle cells (right). (L) Paracrine signaling downstream of hormone activation supports a proangiogenic microenvironment in the early luteal phase, followed by upregulation of TNF-alpha signaling and a hypoxic gene signature in the late luteal phase.
The proangiogenic microenvironment of the luteal phase was also reflected in the transcriptional state of vascular accessory cells. Clustering resolved four cell populations (Figure 5H, Figure S5G) that represented pericytes or smooth muscle cells based on the expression of smooth muscle actin (ACTA2) (Figure 5I). In both accessory cell types, there was a switch in cell state between the follicular/early luteal phase and late luteal phase of the menstrual cycle (Figure 5J, Figure S5H). Similar to the blood and lymphatic endothelium, the late luteal phase was characterized by upregulation of TNF-alpha signaling in both cell types, as well as a hypoxic gene signature in pericytes and pathways involved in EMT in smooth muscle cells (Figure 5K, Figure S6I-J). Together, these data dissect the transcriptional changes in endothelial cells and accessory cell types that underlie angiogenesis and vascular remodeling during the menstrual cycle (Figure 5L).
Remodeling of the stromal and immune microenvironments in response to estrogen and progesterone
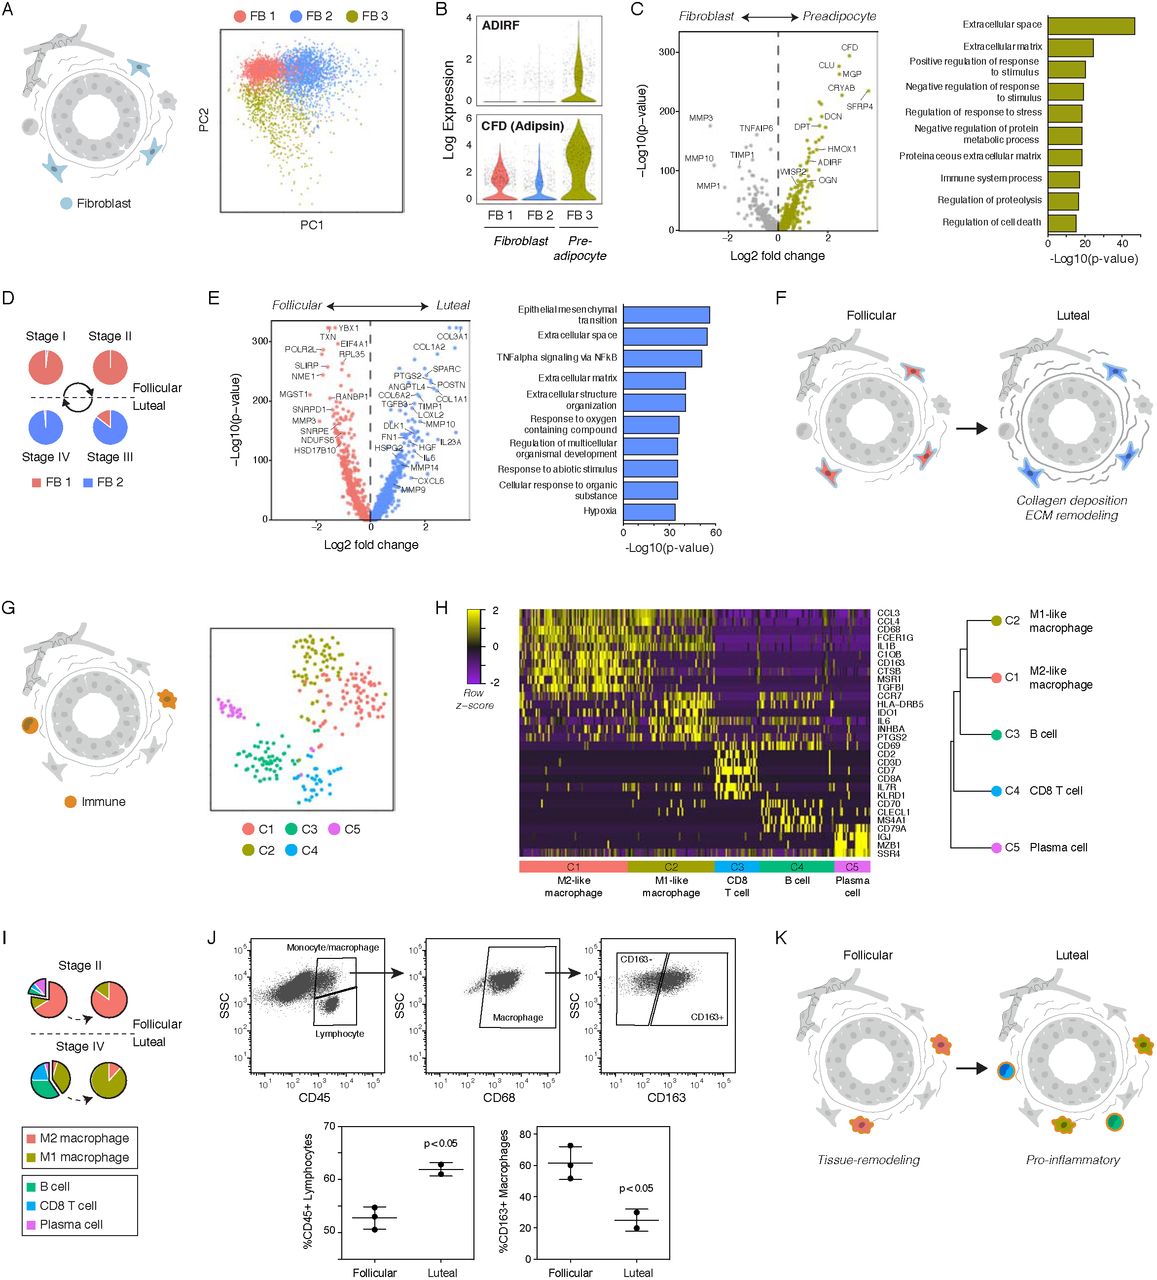
Histological and immunohistochemical analyses of human breast tissue sections have identified alterations in stromal organization and ECM composition across the menstrual cycle (Ferguson et al., 1992; Hallberg et al., 2010). To dissect the transcriptional changes that underlie this stromal remodeling, we performed sub-clustering analysis and identified three subpopulations of fibroblasts (Figure 6A, Figure S6A-B). We identified the FB 3 cluster as a preadipocyte population based on expression of genes involved in adipogenesis such as ADIRF and Adipsin (CFD) (Figure 6B). Compared to fibroblasts, preadipocytes were highly enriched for expression of proteoglycans such as DCN and OGN and non-fibrous ECM proteins such as DPT, whereas fibroblasts had increased expression of genes involved in ECM remodeling such as MMP3 and TIMP1 (Figure 6C, Figure S6C). Within the fibroblast population, we identified two cell states representing a switch between the follicular and luteal phases of the menstrual cycle (Figure 6D, Figure S6D). The luteal phase was characterized by upregulation of ECM proteins including collagen family members (COL3A1, COL1A2) and fibronectin (FN1), ECM remodeling proteins such as matrix metalloproteinases (MMP10, MMP14) and LOXL2, and cytokines and growth factors such as IL6 and TGFB3 (Figure 6E-F, Figure S6E). Notably, TGFB3 signaling is a major signaling molecule involved in post-lactational involution that enhances phagocytosis by mammary epithelial cells (Fornetti et al., 2016), suggesting that TGFB3 secreted by fibroblasts at the end of the luteal phase activates the subset of HR− luminal cells identified in the early follicular phase that express “involution” markers including phagocyte receptors (Fig 4G).

(A) Sub-clustering identified three cell states in fibroblasts. (B) Log-normalized expression of the preadipocyte markers ADIRF and CFD (Adipsin) in the indicated stromal clusters. (C) Volcano plot of genes differentially expressed between fibroblasts and preadipocytes and bar chart of the ten most significantly enriched gene sets in preadipocytes. (D) Frequency of fibroblast cell states across the menstrual cycle. (E) Genes differentially expressed between the luteal- and follicular-phases in fibroblasts and the ten most significantly enriched gene sets in the luteal phase. (F) Paracrine signaling downstream of hormone activation drives ECM deposition and remodeling in luteal-phase fibroblasts. (G) Clustering identified five cell types in the immune cell population. (H) Left: Heatmap highlighting marker genes used to identify each cell type. Right: hierarchical clustering of each cell type based on its log-transformed mean expression profile, and putative identities (Spearman’s correlation, Ward linkage). (I) Frequency of each immune cell type across the menstrual cycle based on TSNE and clustering results. (J) Representative FACS plots of CD45, CD68, and CD163 and quantification of the percent of CD45+/SSClow lymphocytes and CD163+ M2-like macrophages (CD45+/SSChigh/CD68+) in follicular or luteal phase samples. (K) Paracrine signaling during the luteal phase drives a switch from an M2-like to an M1-like macrophage polarization and recruitment of B and T lymphocytes.
Finally, we examined changes in the immune microenvironment across the menstrual cycle. Clustering identified 5 immune cell populations (Figure 6G), comprising two CD68+ macrophage populations representing M1- or M2-like polarized macrophages and three lymphocyte populations representing CD20+ (MS4A1) B cells, CD8+ T cells, and IgA-producing IgJ+ plasma cells (Figure 6H, Figure S6F). M1-like macrophages expressed pro-inflammatory growth factors and cytokines such as INHBA and IL6, whereas tissue-remodeling M2-like macrophages expressed the scavenger receptors CD163 and MSR1. Notably, our clustering data suggested that there was a switch from an M2-like to an M1-like macrophage polarization and increased recruitment of B and T lymphocytes during the luteal phase of the menstrual cycle (Figure 6I, Figure S6G), consistent with previous immunohistochemical studies demonstrating a decreased frequency of CD163+ macrophages and increased frequency of CD8 T cells in the luteal phase (Schaadt et al., 2017). Using flow cytometry analysis, we confirmed an increase in the proportion of SSClow lymphocytes within the CD45+ immune cell population, and a decrease in the proportion of CD163+ M2-like macrophages within the CD45+/CD68+ population in luteal-phase samples relative to the follicular phase (Figure 6J). This switch to a proinflammatory immune microenvironment in the luteal phase coincided with increased expression of cytokines such as TNF in HR− luminal cells (Figure S4J) and IL6 in fibroblasts (Figure 6E). Together, these data suggest that a transition from a tissue-remodeling immune microenvironment to a pro-inflammatory microenvironment occurs between the follicular and luteal phases of the menstrual cycle (Figure 6K).
Hormonal contraceptive use provides a “virtual experiment” to confirm key findings
As we observed similar upregulation of key marker genes such as LRRC26 and TCF7 in women using hormonal contraceptives as we did in the luteal phase of the menstrual cycle (Figure 3G, Figure 4J), we performed “virtual experiments” to test the effects of hormone combinations and dynamics on downstream signaling responses by analyzing an additional three donors with hormonal contraceptive use at the time of surgery (Table S6). scRNAseq (Table S7) and clustering identified three major epithelial populations and four major stromal populations (Figure S7A-C) that directly corresponded to the seven cell types identified in our original five sequenced samples (Figure 1D-E).
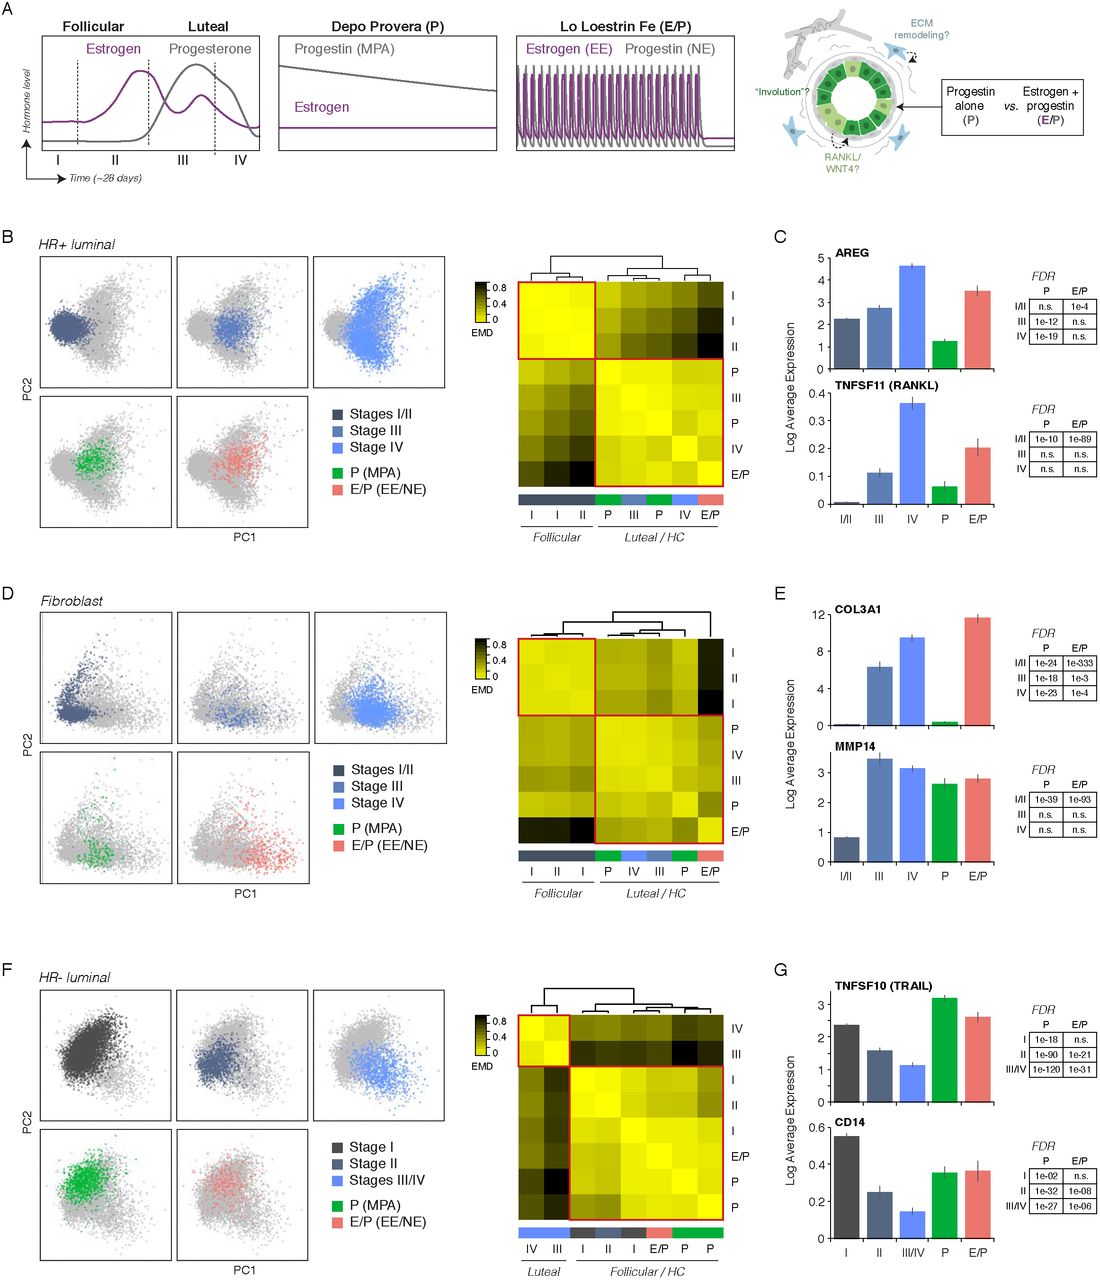
Using the defined hormonal perturbations represented in this new dataset, we first investigated the HR+ cell population to identify the specific signaling pathways activated by combined estrogen/progesterone signaling (E/P) versus progesterone alone (P) (Figure 7A). To measure the transcriptional variation in HR+ cells between each sample, we quantified the EMD in PC space and identified two discrete groups; samples within the either the follicular or luteal phase of the menstrual cycle clustered with each other, and samples from donors using hormonal contraception clustered with those in the luteal phase (Figure 7B). Interestingly, combined hormonal contraception was most similar to the late luteal phase (stage IV), whereas progestin-based contraception was most similar to the early luteal phase (stage III), suggesting that both estrogen and progesterone are required for the full luteal-phase transcriptional response. Supporting this, ER target genes such as AREG, TFF1, and TFF3 were specifically upregulated by combined E/P treatment, although other key downstream regulators such as TNFSF11 (RANKL), WNT4, and CXCL13 were upregulated in both hormone treatment groups to varying degrees (Figure 7C, Figure S7D). Surprisingly, we did not observe upregulation of genes such as VEGFA or ANGPTL4 in either hormonal contraceptive group, despite high expression of PR target genes such as SOX4 and KLF4 in the progestin-only contraceptive group similar to levels seen in the luteal-phase (Figure S7D). These data suggest that VEGFA expression and the pro-angiogenic response in the late luteal phase either depend on cycling rather than sustained hormone levels or on specific temporal ordering of ER/PR activation.
(A) Schematic depicting relative estrogen and progestin levels across the natural menstrual cycle and in donors using progestin-based (P) or combination (E/P) hormonal contraceptives. Samples from donors using hormonal contraceptives were used as a “virtual experiment” to test the effects of hormone treatment on downstream signaling pathways in the indicated cell types. (B) Left: PC plot of HR+ luminal cells from the indicated menstrual cycle stage or hormone-treatment group. Right: Heatmap representing the EMD for each pair of samples, ordered by hierarchical clustering (complete linkage). (C) Bar chart depicting the log normalized expression of AREG or TNFSF11 (RANKL) in HR+ luminal cells from the indicated menstrual cycle stage or hormone-treatment group. (D) Left: PC plot of fibroblasts from the indicated menstrual cycle stage or hormone-treatment group. Right: Heatmap representing the EMD for each pair of samples (complete linkage). (E) Log normalized expression of COL3A1 or MMP14 in fibroblasts from the indicated menstrual cycle stage or hormone-treatment group. (F) Left: PC plot of HR− luminal cells from the indicated menstrual cycle stage or hormone-treatment group. Right: Heatmap representing the EMD for each pair of samples (complete linkage). (G) Log normalized expression of TNFSF10 (TRAIL) or CD14 in HR− luminal cells from the indicated menstrual cycle stage or hormone-treatment group.
Based on these results, we next asked whether the transcriptional states observed in HR+ luminal cells following P-alone or combined E/P treatment led to different downstream paracrine signaling responses in the stroma. EMD and clustering in fibroblasts identified two groups, with samples from donors using hormonal contraception most similar to those in the luteal phase (Figure 7D). We predicted that, as in HR+ luminal cells, fibroblasts would require combined E/P for the full “luteal-phase” transcriptional response, including upregulation of ECM molecules and ECM remodeling proteins. Indeed, although many luteal-phase transcripts such as MMP14, IGFBP2, and DCN were highly upregulated in both hormone-treatment groups relative to the follicular phase, ECM proteins such as COL1A1/2, COL3A1, and FN1 were most highly induced in the combined E/P sample (Figure 7E, Figure S7E).
Finally, we took advantage of the different dynamics of serum hormone levels in donors using hormonal contraception to ask whether the “involution” transcriptional signature observed in HR− luminal cells during the early follicular phase was a consequence of hormone signaling dynamics or represented a homeostatic response. In contrast to HR+ cells and fibroblasts, HR− luminal cells from donors using hormonal contraception were most similar to those in the follicular phase rather than the luteal phase (Figure 7F). Consistent with this, markers of the “involution” cluster during the early follicular phase of the menstrual cycle such as TNFSF10 (TRAIL), CD14, and SAA2 (Figure 4G) were also upregulated in both P and E/P treatment groups relative to similar levels as the early follicular phase (Figure 7G, Figure S7F). Interestingly, we also observed expression of the WNT effector TCF7 in both hormone treatment groups at similar levels to that seen during the luteal phase (Figure S7F). Together, these results suggest that rather than serving as a direct response to changing hormone levels, the “involution” phenotype represents a homeostatic response in HR− luminal cells. Moreover, whereas “involution” and WNT activation are temporally separated during the menstrual cycle, our data suggests that this temporal regulation is lost when normal hormone dynamics are disrupted.
Discussion
In this study, we combined scRNAseq with immunostaining, flow cytometry, and “virtual experiments” to reveal changes in cell composition and cell state associated with the cycling of hormones in the human breast. Our key insight was that, after accounting for the effect of parity, sample-to-sample variability primarily represented the physiological responses to hormone signaling in the breast, since samples were collected at different points in each woman’s menstrual cycle. Indeed, we demonstrated that pregnancy history and menstrual cycle were the two major sources of variation between our samples, with prior pregnancy history leading to a change in epithelial cell proportions and menstrual cycle stage leading to changes in transcriptional state across all epithelial and stromal cell types.
Unbiased clustering uncovered a dramatic change in epithelial composition in women with prior history of pregnancy, characterized by an increased proportion of myoepithelial cells relative to luminal cells and of HR− luminal cells relative to HR+ luminal cells. Previous work has described two tumor-protective features of myoepithelial cells: they are highly resistant to malignant transformation (Lakhani and O’Hare, 2001) and also act as a natural barrier that prevents tumor cell invasion (Sternlicht et al., 1997). Thus, our data suggests that pregnancy protects against breast cancer risk both by decreasing the relative frequency of luminal cells—the tumor cell-of-origin for most breast cancer subtypes (Keller et al., 2012; Melchor et al., 2014; Molyneux et al., 2010)—and by suppressing progression to invasive carcinoma. Moreover, over 80% of all breast cancers express estrogen and/or progesterone receptors (Howlader et al., 2014), and epidemiological studies demonstrate that pregnancy specifically reduces the risk of HR+ breast cancer (Ma et al., 2006). In mice, early pregnancy leads to a lifelong decrease in the overall proportion of HR+ cells (Meier-Abt et al., 2014). Our findings suggest that a similar decrease in the proportion of HR+ cells occurs in the parous human breast. We propose that this decrease is a second mechanism that may contribute to the protective effect of pregnancy against breast cancer.
Interestingly, while it has been suggested that the protective effect of pregnancy is partly due to differentiation of stem and progenitor cells within the mammary epithelium (Choudhury et al., 2013; Meier-Abt et al., 2013), we find that parity led to a change in the proportions of cell types that already existed within the nulliparous breast rather than the emergence of new “differentiated” cell states. However, one outstanding question is whether the cellular transcriptional response to estrogen and progesterone is altered in parous versus nulliparous women. A previous study using bulk RNA sequencing of purified cell types suggested that, in HR− luminal cells, the transcriptional signatures of parous and nulliparous samples were more distinct in the luteal phase of the menstrual cycle than the follicular phase (Choudhury et al., 2013). Our data suggests that this difference may be partly caused by a decrease in the proportion of HR+ cells in the parous breast; if the magnitude of paracrine signaling scales with the proportion of HR+ cells, a reduction in HR+ cells following pregnancy would lead to a corresponding overall reduction in paracrine signaling downstream of hormone activation. However, we cannot rule out the possibility that pregnancy also leads to a change in the differentiation status of HR+ or HR− luminal cells that is only revealed in the luteal phase. Identifying such a scenario would require additional single-cell data from parous samples in the luteal phase of the menstrual cycle.
Second, we used menstrual cycle staging and transcriptional analysis to dissect the changes that occur in cell state across the menstrual cycle in all epithelial and stromal cell populations. Importantly, we found that the transcriptional state of samples clustered with menstrual cycle stage but not with other factors such as age, BMI, or race. Subclustering and pseudotemporal analysis of HR+ cells across the menstrual cycle identified a bifurcation in cell state, in which a single population in the follicular phase split into two distinct states in the luteal phase. We find that both luteal phase cell states co-occur within the same region of the breast, suggesting that these two states do not reflect gross microenvironmental differences such as epithelial or vascular density over different regions of the breast. However, these bifurcating cell states may reflect more local changes in microenvironment. Two other possibilities are that: 1) bifurcation is driven by stochastic fluctuations in gene expression, or 2) it represents two cell states already present in the follicular phase—such as different estrogen receptor signaling states or cell cycle stages—that we lack the resolution to detect in our data. Additional scRNAseq studies at higher sequencing depth or using tissue explants to achieve finer-grained temporal resolution following hormone treatment will be required to address this question.
Sub-clustering analysis also uncovered changes in cell state across all hormone-insensitive cell types—epithelial and stromal—downstream of the paracrine signaling cascade originating in HR+ cells. Strikingly, many of these changes closely mimic those seen during the pregnancy/lactation/involution cycle that have been linked with a transient increased breast cancer risk following pregnancy (Lyons et al., 2011; O’Brien et al., 2010; Schedin et al., 2007). Similar to pregnancy and lactation, high levels of progesterone in the luteal phase promote epithelial proliferation (Anderson et al., 1982; Söderqvist et al., 1997). We found that HR+ luminal cells in the luteal phase split into two distinct paracrine signaling states: one cell state signals partly via proangiogenic and hypoxia-induced factors, likely contributing to remodeling of the stroma, while a second cell state signals via RANK ligand and WNT to myoepithelial and HR− luminal epithelial cells. The first subpopulation has not been previously characterized, while the second is consistent with previous studies demonstrating that RANK and WNT control progesterone-mediated epithelial proliferation (Joshi et al., 2015). These latter signals may also be permissive of growth in cells with preexisting oncogenic mutations. In contrast, the fraction of apoptotic cells in the epithelium peaks between the late luteal and early follicular phase (Anderson et al., 1982). Consistent with this, we identified a previously undescribed subpopulation of HR− cells in the early follicular phase with a transcriptional signature closely matching that described for post-lactational involution (Clarkson et al., 2004; Stein et al., 2009), including upregulation of immune mediators and phagocytic receptors.
In the stroma, we uncovered tumor promoting microenvironmental changes in all cell types that parallel the cellular changes seen during pregnancy and involution (Lyons et al., 2011; O’Brien et al., 2010; Schedin et al., 2007). As hormone levels increase, we found induction of pathways involved in angiogenesis and blood vessel remodeling in endothelial cells, as well as hallmarks of ECM deposition and remodeling in fibroblasts. Notably, we observed the concurrent upregulation of a pro-angiogenic and hypoxic gene signatures in multiple epithelial and stromal cell types. A previous study identified these same pathways as highly enriched following involution in the mouse mammary gland. More importantly from the perspective of breast cancer risk, this “hypoxia/pro-angiogenic” signature identified breast cancers with increased metastatic activity (Stein et al., 2009), suggesting that these pathways support tumor cell invasion and metastasis. Finally, we described a switch between a pro-inflammatory M1-like macrophage polarization in the luteal phase and a tissue-remodeling M2-like macrophage polarization in the follicular phase. M2-like macrophages have previously been shown to promote cancer progression (Mantovani et al., 2002). Together, these data suggest that some of the same mechanisms underlie both the increased short-term breast cancer risk following pregnancy and the lifetime increased risk due to menstrual cycle number. Moreover, in samples from donors using hormonal contraception, we observed stromal changes that paralleled those seen during the luteal phase of the menstrual cycle, as well as evidence of an “involution” transcriptional signature in HR− cells similar to the early follicular phase. Thus, we speculate that similar signaling pathways underlie the increased risk of breast cancer that has been observed in women using hormonal contraception (Mørch et al., 2018).
In summary, these results provide a comprehensive, systems-level view of the cellular and transcriptional changes that control normal breast development and breast cancer risk in response to cycling hormones. This single-cell analysis establishes a link between hormone cycling during pregnancy or the menstrual cycle and a variety of well-established pro- and anti-tumorigenic cellular signatures: we identify tumor-protective changes in epithelial cell proportion with pregnancy and tumor-promoting changes in cell state across the menstrual cycle that are similar to changes seen during involution. As the breast is one of the only human organs that undergoes repeated cycles of morphogenesis and involution, this study serves as a roadmap to the cell state changes associated with the dynamic human breast. Moreover, it provides a foundation for similar system-level studies dissecting the how the paracrine communication networks downstream of hormone signaling are altered during HR(+) breast cancer progression. A better understanding of cellular and molecular response to hormone receptor activation will aid in identifying women at higher risk for breast cancer and may inform new strategies for cancer prevention.
Methods
Tissue samples and preparation
Reduction mammoplasty tissue samples were obtained from the Cooperative Human Tissue Network (Nashville, TN) and the Kaiser Foundation Research Institute (Oakland, CA). Tissues were obtained as de-identified samples and all subjects provided written informed consent. When possible, medical reports were obtained with personally identifiable information redacted. Use of the breast tissues to conduct the studies described above were approved by the UCSF Committee on Human Research under Institutional Review Board protocol No. 158396. A portion of each sample was fixed in formalin and paraffin-embedded using standard procedures. The remainder was dissociated mechanically and enzymatically to obtain epithelial-enriched organoids. Tissue was minced, followed by enzymatic dissociation with 200 U/mL collagenase type III (Worthington CLS-3) and 100 U/mL hyaluronidase (Sigma H3506) in RPMI 1640 with HEPES (Cellgro 10-041-CV) plus 10% (v/v) dialyzed FBS, penicillin, streptomycin, amphotericin B (Lonza 17-836E), and gentamicin (Lonza 17-518) at 37 C for 16h. This cell suspension was centrifuged at 400 x g for 10 min and resuspended in RPMI 1640 plus 10% FBS. Organoids enriched for epithelial cells and associated stroma were collected after serial filtration through 150 μm and 40 μm nylon mesh strainers. The final filtrate contained stromal cells consisting primarily of fibroblasts, endothelial cells, and immune cells. Following centrifugation, epithelial organoids and filtrate were frozen and maintained at −180 °C until use.
Dissociation to single cells and sorting for scRNA-seq
The day of sorting, epithelial organoids from the 150 μm fraction were thawed and digested to single cells by trituration in 0.05% trypsin for 2 min, followed by trituration in 5 U/mL dispase (Stem Cell Technologies 07913) plus 1 mg/mL DNase I (Stem Cell Technologies 07900) for 2 min. Single-cell suspensions were resuspended in HBSS supplemented with 2% FBS, filtered through a 40 μm cell strainer, and pelleted at 400 x g for 5 minutes. The pellets were resuspended in 10 mL of complete mammary epithelial growth medium with 2% v/v FBS without GA-1000 (MEGM) (Lonza CC-3150). Cells were incubated in a 37 °C for 2 hours, rotating on a hula mixer, to regenerate surface antigens. Cells were pelleted at 400 x g for 5 minutes and resuspended in phosphate buffered saline supplemented with 1% BSA at a concentration of 1 million cells per 100 μL, and incubated with primary antibodies. Cells were stained with Alexa 488-conjugated anti-CD49f to isolate myoepithelial cells, PE-conjugated anti-EpCAM to isolate luminal epithelial cells, and biotinylated antibodies for lineage markers CD2, CD3, CD16, CD64, CD31, and CD45 to remove hematopoietic (CD16/CD64-positive), endothelial (CD31-positive), and leukocytic (CD2/CD3/CD45-positive) lineage cells by negative selection (Lin-). Sequential incubation with primary antibodies was performed for 15 min at room temperature in PBS with 1% BSA, and cells were washed with PBS with 1% BSA. Biotinylated primary antibodies were detected with a streptavidin-Brilliant Violet 785 conjugate. After incubation, cells were washed once in PBS with 1% BSA and resuspended in PBS with 2% BSA and 1 ug/mL DAPI for live/dead discrimination. Cell sorting was performed on a FACSAria II cell sorter. 5,000–10,000 unsorted (DAPI-), luminal (DAPI-/Lin-/CD49f-/EpCAMhigh), or myoepithelial (DAPI-/Lin-/CD49f+/EpCAMlow) cells were collected for each sample and resuspended in PBS plus 1% BSA at a concentration of 1000 cells/μL.
Antibodies and dilutions used (μL/million cells): FITC-EpCAM (1.5 μL; BD 550257, clone AD2), APC-CD49f (4 μL; Stem Cell Technologies 10109, clone VU1D9), Biotin-CD2 (8 μL; Biolegend 313636, clone GoH3), Biotin-CD3 (8 μL; BD 55325, clone RPA-2.10), Biotin-CD16 (8 μL; BD 55338, clone HIT3a), Biotin-CD64 (8 μL; BD 555526, clone 10.1), Biotin-CD31 (4 μL; Invitrogen MHCD31154, clone MBC78.2), Biotin-CD45 (1 μL; Biolegend 304004, clone HI30), BV785-Streptavidin (1 μL; Biolegend 405249).
scRNAseq library preparation
cDNA libraries were prepared using the 10X Genomics Single Cell V2 (10X Genomics, 2017) standard workflow (CG00052 Single Cell 3’ Reagent Kit v2: User Guide Rev B). Library concentrations were quantified using high sensitivity DNA Bioanalyzer chips (Agilent, 5067-4626), the Illumina Library Quantification Kit (Kapa Biosystems KK4824), and Qubit dsDNA HS Assay Kit (Thermo Fisher Q32851). Each library was separately sequenced on a lane of a HiSeq4500 for an average of ~100,000 reads/cell.
scRNAseq data processing with the Cell Ranger package
Cell Ranger software version 1.31 was used to align sequences, filter data and count unique molecular identifiers (UMIs). Data were mapped to the human reference genome GRCh37. The resulting sequencing statistics are summarized in Table S2 and Table S7. Data from multiple samples were aggregated into a single data set using the Cell Ranger Aggr pipeline, which down-samples the read depth of different lanes to normalize across the data set. We performed three sets of data aggregation: the 5 samples listed in Table S2 were aggregated for initial cell type clustering and analyses of changes due to pregnancy and menstrual cycle (Figures 1–6), the 3 samples listed in Table S7 were aggregated for cell type identification in donors using hormonal birth control (Figure S7), and all 8 samples were aggregated for analysis of relative expression of specific marker genes with different hormone treatments relative to different stages of the menstrual cycle (Figure 7).
Quality control and cell type identification using Seurat
Cell type identification was performed using the Seurat package (version 2.3.1) in R. Aggregated data was filtered to remove cells that had fewer than 200 genes and genes that appeared in fewer than 3 cells. Cells with a Z score of 4 or greater for the total number of genes expressed were presumed to be doublets and removed from analysis. Cells with a Z score of 3 or greater for percent of mitochondrial genes were presumed to be low diversity and removed from analysis. This filtering removed 916 cells from analysis of the 5 aggregated samples (Table S2) to give 23,708 genes across 42.103 cells and 170 cells from analysis of the 3 aggregated hormonal contraception samples (Table S7) to give 21,527 genes across 4,419 cells. The remaining cells were log transformed and scaled to a total of 1e4 molecules per cell, and variation due to the number of UMI and percent of mitochondrial genes was regressed out.
Variable genes were defined as genes with an average expression between 0.0125 and 3 and a z-score of at least 0.5. For initial cell type identification, batch effects were corrected by identifying genes with an AUC > 0.6 for an individual sample and removing these from the list of variable genes. We then performed PCA on the resulting list of variable genes. Statistically significant PCs as determined by visual inspection of elbow plots were used as an input for TSNE visualization. Finally, we performed k nearest neighbor (KNN) modularity optimization-based clustering to identify cell types using Seurat’s FindClusters function.
Menstrual cycle scoring
Gene sets representing differentially expressed transcripts the follicular or luteal phase of the menstrual cycle were taken from Pardo et al., and the top 20 follicular- or luteal-phase genes were identified after excluding genes not expressed in our scRNAseq dataset. As these gene sets represented differentially expressed transcripts in microdissected epithelium, we randomly selected equal total numbers of luminal epithelial cells (C2 and C3) from the unsorted and luminal sort gates for each sample. We then calculated the averaged log-normalized expression of genes in each set to define follicular- or luteal-phase specific gene scores. These scores were scaled by their root mean square and normalized to their maximum value to give a follicular or luteal score ranging from 0–1 for each cell. Finally, an average menstrual cycle score was calculated for each sample by subtracting the follicular score from the luteal score for each cell and plotting the mean across all cells in a sample.
Measuring transcriptional variability between samples with Earth Mover’s Distance
To measure differences in transcriptional state due to menstrual cycle stage without confounding effects of parity on cell proportions, we sampled equal numbers of each of the most abundant cell types (C1-C6) for each sample. We then performed PCA on the subsampled matrix using the most variable genes identified as described above (without correcting for batch effects). We chose this approach rather than using the PCs identified in Seurat, as the PCs in Seurat were calculated on the entire dataset containing variable numbers of each cell type, which varied based on parity and amount of associated stroma. Following PCA, we used the Munkres assignment algorithm in Matlab (Munkres Assignment Algorithm version 1.0.0.0, Yi Cao) to quantify the minimum cost of moving one sample’s distribution across in PC space onto another sample’s distribution, in a measure known as Earth Mover’s Distance (EMD). We chose this approach rather than distance-based or other similarity metrics since EMD measures the transcriptional variation between entire cell populations (containing multiple cell types) rather than between individual cells. Finally, hierarchical clustering of the EMD between each sample pair was calculated using complete linkage to identify samples that were more similar to each other in PC space. To measure differences in transcriptional state due to hormonal contraceptives, we performed similar analyses with the following modifications. First, we sampled equal numbers of each of the analyzed cell types (e.g. HR+ luminal cells, fibroblasts, etc.) rather than multiple cell types. Second, we performed the Munkres assignment algorithm on the first two PCs identified by PCA of each individual cell type in Seurat.
Pseudotime analysis with Monocle 2
Pseudotime trajectories were constructed for HR+ luminal cells and myoepithelial cells using the Monocle 2 R package (version 2.6.4). For each cell type, we performed PCA on genes expressed in at least 5% of the total cells. Statistically significant PCs as determined by visual inspection of elbow plots were used as an input for TSNE analysis. We next used an unsupervised procedure called dpFeature to select genes that varied between clusters as identified by graph-based density peak clustering in TSNE-space. We selected the 1,500 most significantly differentially expressed genes and used these genes to perform reverse graph embedding dimensionality reduction, followed by manifold learning to fit a trajectory to the reduced dimension data and infer a pseudotime value for each cell. Cells in the follicular phase were chosen as the root of each trajectory. For HR+ luminal cells, we additionally used this ordering to identify genes that varied across pseudotime or along each branch and fit a smooth spline to each gene’s expression across pseudotime, using the differentialGeneTest or BEAM functions, respectively. We then clustered genes with similar variation across pseudotime and visualized these changes using the plot_pseudotime_heatmap and plot_genes_branched_heatmap functions.
Cell state identification using non-negative matrix factorization (NMF)
For each cell type, we selected variable genes as described above (without batch correction). We used the NMF (version 0.21.0) package in R to perform sub-clustering by non-negative matrix factorization. NMF attempts to find a mathematical approximation for A ≈ WH, where, for our dataset, A represents a matrix of n variable genes by m cells, W represents an n x k matrix of gene loadings for each cluster k, and H represents a k x m matrix of cell loadings for each cluster k. To estimate the optimum number of clusters, k, we randomly sampled 1000 cells for each cell type, initialized W and H using a random seed, and performed 30 NMF runs to obtain consensus clustering results. We calculated the cophenetic correlation coefficient and dispersion for each consensus clustering matrix and chose the optimum value for k as proposed in Brunet et al. (Brunet et al., 2004). Using this optimum value of k, we then re-ran NMF on the full set of cells for each cell type, using non-negative double singular value decomposition (nnsvd) to approximate appropriate initial values of W and H. For each cell type, we also performed PCA in Seurat on the most variable genes as described above, and plotted the NMF results in PC-space to visually confirm clustering results.
RNA velocity estimation with Velocyto
RNA velocity estimation was performed using the Velocyto (version 0.5) R package as described in La Manno et al. Spliced and unspliced matrices were prepared using the Velocyto Python command line interface. Genes were filtered to remove spliced transcripts expressed in fewer than 20 cells, with fewer than 30 total counts, or with greater than 0.5 average counts and unspliced transcripts expressed in fewer than 20 cells, with fewer than 20 total counts, or with greater than 0.05 average counts. RNA velocities were estimated based on calculating a cell-cell distance from the correlation of each cell in PC space, nearest-cell pooling (k=25) and a fit quantile of 0.02. These velocities were visualized by projecting velocity vector fields into PC space using Gaussian smoothing on a regular grid.
Gene set enrichment analysis
To identify gene sets upregulated in each phase of the menstrual cycle, we performed marker analysis on the cell states identified by NMF analysis, using the likelihood-ratio test for single gene expression as part of the Seurat package (McDavid et al., 2013). We selected the set of marker genes overexpressed by at least 1.5-fold in each cell state and used the Broad’s gene set enrichment analysis tool (http://software.broadinstitute.org/gsea/msigdb/annotate.jsp) to compute overlaps with hallmark, KEGG, and gene ontology (GO) gene sets (Subramanian et al., 2005). A corrected p-value of 0.05 was used as a cutoff to identify significant enrichment of a gene set, and the top 10 most significantly-enriched gene sets were plotted for each cell state.
Fluorescent Immunohistochemistry
For immunofluorescent staining, formalin-fixed paraffin-embedded tissue sections were deparaffinized and rehydrated using standard methods. Endogenous peroxides were blocked using 3% hydrogen peroxide in PBS, and antigen retrieval was performed in 0.1 M citrate buffer pH 6.0. Sections were blocked for 5 minutes at room temperature using Lab Vision Ultra-V block (Thermo TA-125-UB) and rinsed with TNT wash buffer (1X Tris-buffered saline with 5 mM Tris-HCl and 0.5% TWEEN-20). Primary antibody incubations were performed for 1 hour at room temperature or overnight at 4°C. Sections were washed three times for 5 min each with TNT wash buffer, incubated with Lab Vision UltraVision LP Detection System HRP Polymer (Thermo Fisher TL-060-HL) for 15 minutes at room temperature, washed, and incubated with one of three colors of TSA amplification reagent at a 1:50 dilution. After tyramide signal amplification, antibody complexes were removed by boiling in citrate buffer, followed by blocking and incubation with additional primary antibodies as above. Finally, sections were rinsed with deionized water and mounted using Vectashield HardSet Mounting Media with DAPI (Vector H-1400). Immunfluorescence was analyzed by spinning disk confocal microscopy using a Zeiss Cell Observer Z1 equipped with a Yokagawa spinning disk and running Zeiss Zen Software.
Antibodies, TSA reagents, and dilutions used: p63 (1:2000; CST 13109, clone D2K8X), KRT7 (1:4000; Abcam AB68459, clone EPR1619Y), KRT23 (1:2000; Abcam AB156569, clone EPR10943), ER (1:4000; Thermo RMM-9101-S, clone SP1), LRRC26 (1:2000; Thermo PA5-63285), TCF7 (1:2000; CST 2203, clone C63D9), PR (1:3000; CST 8757, clone D8Q2J), P4HA1 (1:9000; Thermo PA5-55353), FITC-TSA (2 min; Perkin Elmer NEL701A001KT), Cy3-TSA (3 min; Perkin Elmer NEL744001KT), Cy5-TSA (7 min; Perkin Elmer NEL745E001KT).
RNA FISH analysis of ESR1 transcripts
Combined RNA FISH and immunofluorescence analysis of estrogen receptor transcript (RNAscope Probe Hs-ESR1; ACD 310301) and protein (anti-ER; Thermo RMM-9101-S, clone SP1) was performed using the RNAscope in situ hybridization kit (RNAscope Multiplex Fluorescent Reagent Kit V2, ACD 323100) according to the manufacturer’s instructions and fluorescent immunohistochemistry protocol outlined above with the following modifications. Immunostaining for ER was performed prior to in situ hybridization, using the hydrogen peroxide and antigen retrieval solutions supplied with the RNAscope kit and the mildest recommended conditions. After ER immunostaining and tyramide signal amplification, in situ hybridization for ESR1 was performed according to the manufacturer’s instructions, followed by immunostaining for KRT7 as described above. For all RNA FISH experiments, we used positive (PPIB) and negative controls (DAPB) to verify staining conditions and probe specificity.
Flow cytometry analysis of myoepithelial and immune cell populations
Flow cytometry analysis of myoepithelial cell populations was performed as described above (Dissociation to single cells and sorting for scRNA-seq). Flow cytometry analysis of immune cell populations was performed as described above except that the filtrate fraction, enriched for stromal fibroblasts and immune cells, was used rather than the 150 μm epithelial-enriched organoid fraction. Cells were stained with Pacific Blue-conjugated anti-CD45 to identify immune cells, FITC-conjugated anti-CD68 to identify macrophages, and PE-conjugated anti-CD163 to identify M2-like polarized macrophages.
Antibodies and dilutions used (μL/million cells): EpCAM, CD49f, and lineage negative-selection antibodies and dilutions for myoepithelial cell FACS analysis are described above. PB-CD45 (5 μL BIolegend 304012, clone HI30), FITC-CD68 (5 μL Biolegend 333805, clone Y1/82A), PE-CD163 (5 μL Biolegend 333605, clone GHI/61)
Data availability
Raw gene expression and barcode count matrices will be uploaded to the Gene Expression Omnibus.
Author Contributions
Conceptualization, L.M.M., R.J.W., and Z.J.G.; Methodology, L.M.M., R.J.W., M.T., and Z.J.G.; Software L.M.M., R.J.W., and C.S.M.; Investigation, L.M.M., R.J.W., J.C., and A.D.B.; Resources, T.T. and Z.J.G.; Writing – Original Draft, L.M.M. and Z.J.G.; Writing – Review & Editing, L.M.M., R.J.W., A.D.B., M.T., T.T. and Z.J.G.; Visualization, L.M.M.; Supervision, T.A.D., T.T., and Z.J.G.
Acknowledgments
We thank Drs. Tom Norman and Jonathan Weissman for technical support and for generously providing access to equipment and computing resources. Sequencing was performed in the Center for Advanced Technology at UCSF. This research was supported in part by grants from the Department of Defense Breast Cancer Research Program (W81XWH-10-1-1023 and W81XWH-13-1-0221), NIH (U01CA199315 and DP2 HD080351-01), the NSF (MCB-1330864), and the UCSF Center for Cellular Construction (DBI-1548297), an NSF Science and Technology Center. Z.J.G is a Chan-Zuckerberg BioHub Investigator. L.M.M is a Damon Runyon Fellow supported by the Damon Runyon Cancer Research Foundation (DRG-2239-15).
References


