

SUMMARY
Eukaryotic transfer RNAs can become selectively fragmented upon various stresses, generating tRNA-derived small RNA fragments (tRFs). Such tRNA fragmentation has been observed to impact a small fraction of the tRNA pool and thus presumed to not directly impact translation. We report that in human cells, oxidative stress can rapidly generate tRFs derived from tyrosyl tRNAGUA—causing significant depletion of the precursor tRNA molecule. Tyrosyl tRNAGUA depletion impaired expression of a gene-set enriched in its cognate tyrosine codons, comprising growth and metabolic genes. Depletion of tyrosyl tRNAGUA or its downstream genes EPCAM, SCD, or USP3 repressed proliferation—revealing a tRNA-regulated growth suppressive pathway for oxidative stress response. Thus, tRNA fragmentation can both deplete a precursor tRNA molecule with codon-dependent regulatory consequences and also generate small-RNAs that interact with RNA binding proteins. Our findings reveal the existence of an underlying adaptive codon-based gene-regulatory logic inherent to the genetic code.
RESEARCH HIGHLIGHTS
Stress-induced tyrosyl tRNAGUA fragmentation depletes precursor tRNATyrGUA and mature tRNATyrGUA
TRNATyrGUA depletion impairs expression of growth genes enriched in cognate tyrosine codons
This constitutes a growth suppressive adaptive stress response driven by codon-based logic
INTRODUCTION
Transfer RNAs (tRNAs) are universal decoders of the genetic code. By recognizing three-nucleotide sequences (codons) in transcripts, tRNAs enable ribosomal incorporation of specific amino acids into the growing polypeptide chain. Because there exists a larger number of codons than amino acids, the code is degenerate, with multiple ‘synonymous’ codons encoding a given amino acid. The human genome contains over 400 tRNA genomic loci, with multiple genes encoding tRNAs that contain the same anti-codon (Parisien et al., 2013). The collection of such tRNA molecules that recognize the degenerate trinucleotide sequence and ‘decode’ the same codon is termed tRNA isodecoders. The central roles of tRNAs in translation have been defined through elegant structural and biophysical studies (Nissen et al., 2000; Ogle et al., 2002). Recent studies have, however, challenged our textbook notions regarding these essential molecules and suggest that beyond their static roles as adaptors in translation, tRNAs play additional dynamic roles in gene regulation (Schimmel, 2018).
One line of support for non-canonical roles for tRNAs was the discovery in Tetrahymena that starvation stress caused a subset of tRNAs to undergo endonucleolytic cleavage into smaller fragments (Lee and Collins, 2005). In humans, tRNA-derived fragments (tRFs) were originally detected in the urine of cancer patients in the 1980s but were of unknown function (Gehrke et al., 1979). A variety of stresses have since been observed to elicit tRFs in cells of organisms ranging from yeast to man (Thompson et al., 2008). Specific ribonucleases have also been implicated in generating tRFs in distinct species, including Rny1 in yeast and angiogenin in human cells (Fu et al., 2009; Thompson and Parker, 2009a). Past studies reported that tRNA fragmentation did not noticeably deplete (<1%) the precursor tRNA molecules for the specific tRFs being studied (Yamasaki et al., 2009). As such, these observations suggested that the primary consequence of tRF generation was production of trans-acting small RNAs rather than translational impairment resulting from depletion of the precursor tRNA pool. Consistent with this hypothesis, endogenous tRFs have been found to interact in trans with RNA-binding proteins and to mediate post-transcriptional gene repression (Goodarzi et al., 2015; Kuscu et al., 2018). Attesting to their functional roles, inhibition of tRFs has been shown to impact malignant phenotypes at the cellular and organismal levels, while deletion of angiogenin has been shown to cause defects in hematopoiesis (Goncalves et al., 2016).
A second line of evidence for non-canonical roles by tRNAs was the observation that the expression levels of some tRNAs become modulated in the context of malignancy (Goodarzi et al., 2016; Pavon-Eternod et al., 2009). Such observations challenged the widely held dogma that tRNAs are static components in gene regulation. The advent of tRNA microarray methods enabled comparisons of expression levels of large numbers of tRNAs in normal and malignant cells (Dittmar et al., 2006). Comparison of breast cancer cells to normal breast cells revealed a number of tRNAs to be overexpressed and others repressed, perhaps owing to genomic instability and subsequent copy number alterations of different tRNA genes (Goodarzi et al., 2016; Pavon-Eternod et al., 2009). Such alterations in tRNA content were hypothesized to impact cellular protein expression (Chan et al., 2010; Pavon-Eternod et al., 2013; Pershing et al., 2015) and mRNA stability (Boel et al., 2016; Hoekema et al., 1987; Presnyak et al., 2015). Other analyses revealed similar findings of large-scale tRNA expression alterations associated with the cancerous proliferative state versus the differentiated state (Gingold et al., 2014). Support for causal roles for tRNA modulations in gene expression and phenotypic regulation came from studies of metastatic progression, where specific tRNA isodecoders (tRNAGluUUC and tRNAArgCCG) were found to be overexpressed as breast cancer cells gained metastatic potential (Goodarzi et al., 2016). Upregulation of these metastasis-promoting tRNAs increased protein expression levels of pro-metastatic genes enriched in their cognate codons. Mutagenesis studies revealed that upregulation of a tRNA isodecoder enhanced protein expression of one of its direct target genes in a codon-dependent manner (Goodarzi et al., 2016). These studies revealed that in some contexts what we call synonymous codons might actually be a misnomer, since the tRNA isodecoders that decode such synonymous codons may become differentially modulated during disease progression. Mutagenesis studies of the KRAS oncogene also provided support for distinctness among synonymous codons; KRAS protein expression became upregulated upon mutation of a ‘rare’ codon (decoded by a low-abundant tRNA isodecoder) to an ‘optimal’ synonymous codon (decoded by an abundant tRNA isodecoder) (Pershing et al., 2015)—consistent with tRNA availability impacting protein expression (Gustafsson et al., 2004). Moreover, it is important to note that tRNA abundance not only impacts translational efficiency, but can also affect mRNA stability, since poorly translated transcripts, in general, exhibit higher decay rates and can be better substrates for degradation machinery (Radhakrishnan et al., 2016). If distinct isodecoders can modulate distinct sets of genes and yield distinct phenotypes, then one may expect the existence of a mutation in a tRNA isodecoder giving rise to a specific phenotype. Indeed, elegant genetic studies revealed that a mutation in the anticodon of a single nuclear encoded mouse tRNA gene could cause a specific phenotype—cerebellar neurodegeneration (Ishimura et al., 2014).
The observed disease-associated tRNA modulations and the ensuing codon-dependent gene expression effects in the context of genomic instability and cancer raise the question of whether such tRNA modulations occur in normal cells and elicit gene expression effects in response to exogenous signals. We herein describe the existence of an endogenous gene-regulatory response to oxidative stress in human cells that is mediated by the depletion of a specific tRNA. We observed that oxidative stress rapidly induced fragmentation of tyrosyl tRNAGUA—leading to tRNATyrGUA depletion and reduced expression of a gene set enriched in tyrosine codons. The affected genes were significantly enriched in growth and metabolic pathways. The depletion of tRNATyrGUA and the consequential downregulation of its tyrosine-enriched gene set caused growth suppression. Our findings uncover a direct relationship between tRNA fragmentation and tRNA modulation and reveal that for a specific tRNA, stress-induced fragmentation can be substantial enough to deplete the tRNA precursor, with adaptive gene regulatory consequences.
RESULTS
Systematic characterization of changes in tRNAs and tRFs as a response to oxidative stress
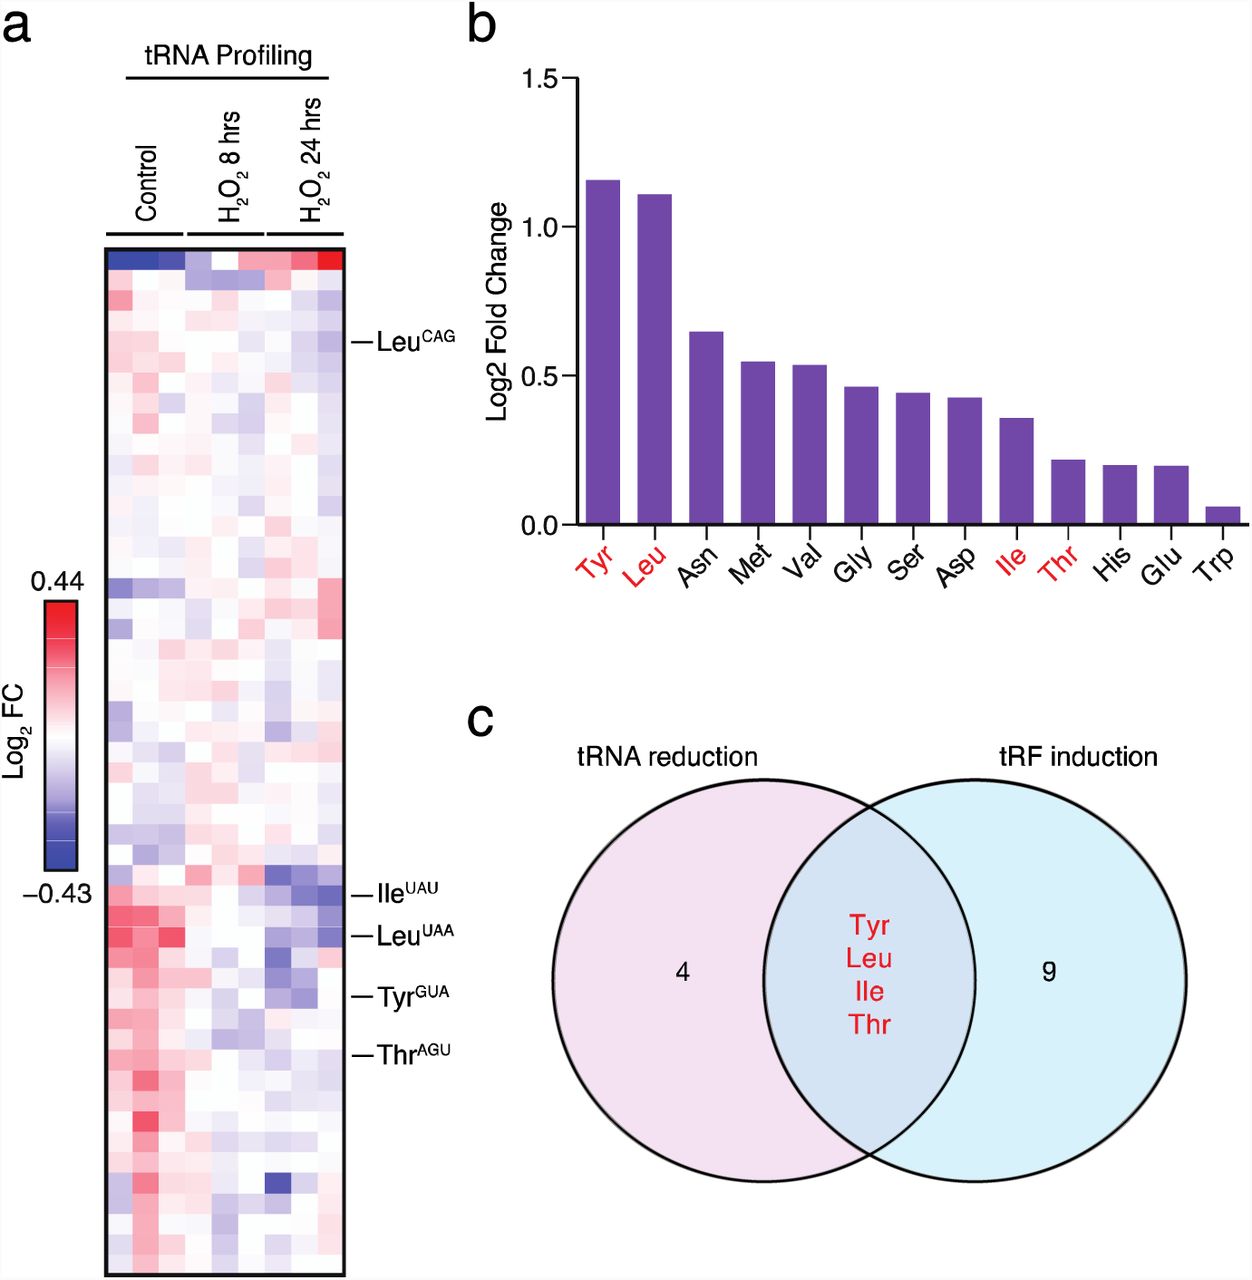
We hypothesized that stress-induced tRNA fragmentation may cause depletion in the pools of specific tRNAs. To search for such tRNAs, we sought to globally profile changes in tRNA and tRF levels upon exposure to oxidative stress—a stress known to robustly induce tRF generation (Thompson et al., 2008; Thompson and Parker, 2009a; Yamasaki et al., 2009). Due to numerous nucleotide modifications as well as their highly conserved secondary structures, tRNAs are poor substrates for reverse transcription and consequently are poorly quantified by standard high-throughput sequencing methods. To overcome this, multiple independent methods have been developed to profile tRNA species (Cozen et al., 2015; Gogakos et al., 2017; Goodarzi et al., 2016; Zheng et al., 2015). We employed one such method—a probe-based tRNA capture, ligation, and deep-sequencing approach—to profile tRNA isodecoder abundances across samples (Goodarzi et al., 2016). This allowed us to assess the impact of oxidative stress on tRNA levels in a human mammary epithelial cell line (MCF10A). At both 8 and 24 hours after 200uM hydrogen peroxide (H2O2) treatment, tRNA levels were globally similar to the tRNA levels in the non-treated condition (Fig. 1a). However, we noted that a number of specific tRNAs (tRNATyrGUA, tRNAIleUAU, tRNALeuUAA, tRNAThrAGU, and others) significantly decreased in abundance over time after H2O2 treatment. We next exposed MCF10A cells to oxidative stress and profiled small RNA (smRNA) abundances via deep-sequencing (Fig. 1b). This revealed the induction of many tRFs upon exposure of cells to oxidative stress—consistent with previous studies describing the effects of oxidative stress on fragmentation of specific tRNAs by northern blot analyses (Saikia et al., 2012; Thompson et al., 2008). The observed induction of tRFs was not an artifact of cell death, as cell viability was unchanged in treated versus control samples at the concentration of H2O2 used (Fig S1a). Integration of tRNA profiling and tRF sequencing analyses identified a set of candidate tRNAs that were both depleted upon oxidative stress and exhibited increased fragment generation upon oxidative stress as assessed by small-RNA sequencing (Fig 1c). From this overlapping set, tRNATyrGUA, tRNALeuUAA, tRNALeuCAG exhibited significantly higher levels of oxidative stress-induced tRF generation (Fig. 1b, Fig S1b).

(A) Heatmap of tRNA profiling of MCF10A cells at 8 and 24 hours post exposure to oxidative stress (200µM H2O2). Biological triplicate data is depicted at each time point relative to control cells.
(B) MCF10A cells were exposed to oxidative stress (200µM H2O2) and processed for small RNA-sequencing. The log2-fold induction levels for tRFs derived from distinct tRNA isoacceptor is plotted.
(C) Schematic depicts the overlap of tRNAs in (A) that decreased over time with tRFs from (B) that were induced. Four isoacceptor families of tRNAs are shown in the overlap with tyrosyl-tRNA and leucyl-tRNAs as the most promising candidates that exhibited the highest degree of tRF induction.
Oxidative stress-induced fragmentation depletes tRNATyrGUA
Northern blot analysis confirmed that oxidative stress can induce generation of tRFTyrGUA and tRFLeu (multiple isodecoders) and therefore we focused our efforts on the most highly induced tRF and its associated tRNA—tRFTyrGUA (Fig S2a). Time-course studies revealed that tRFTyrGUA became rapidly induced (within 5 minutes) upon cellular exposure to H2O2 (Fig 2a). The generation of tRFTyrGUA was associated with a concomitant precipitous decline in pre-tRNATyrGUA levels, which remarkably became nearly undetectable at 1-hour post treatment (Fig 2b). This suggests that the majority of tRFTyrGUA is generated from the pre-tRNATyrGUA rather than the mature tRNA. Pre-tRNA-derived tRFs have been previously detected in other contexts (Lee et al., 2009). As tRNAs are one of the most stable classes of RNAs, with relatively long half-lives, we would expect a delayed effect on the abundance of the mature tRNA pool upon acute reduction of the pre-tRNA pool. Indeed, we observed a significant delayed reduction in the tRNATyrGUA pool, which was observed at 24 hours post H2O2 exposure (Fig 2a-b). The mature tRNATyrGUA pool diminished to roughly half of pre-treatment levels at 24 hours post treatment. These observations reveal that oxidative stress-induced generation of tRFTyrGUA can significantly deplete the corresponding mature tRNATyrGUA pool. Our findings furthermore demonstrate that a single cellular stress can modulate the levels of a specific tRF and its corresponding tRNA.

(A) A northern blot depicting a time course experiment ranging from five minutes to 24 hours of MCF10A cells in response to oxidative stress. A single probe complementary to pre-tRNATyrGUA, mature tRNATyrGUA, and tRFTyrGUA expression was 32P-labeled and used for detection.
(B) Quantification of pre-tRNATyrGUA northern blot analysis from multiple independent experiments after one hour as well as mature tRNATyrGUA levels after 24 hours (normalized to U6 levels) are shown (n=6).
(C) MCF10A cells were exposed to oxidative stress (200µM H2O2) once daily for five continuous days to test if repeated exposure to the stress could elicit a response similar to that found in (A).
(D) Quantification of mature tRNATyrGUA bands by northern blot after cells were treated once daily for five continuous days (normalized to U6) from multiple independent experiments (n=9).
(E) Quantification of northern blot analysis for pre-tRNATyrGUA (left) and tRNATyrGUA (right) after one hour and 24 hours respectively in HBEC30 cells upon exposure to oxidative stress (200µM H2O2) as in (A) (n=6). Data represent mean ± s.e.m. A one-tailed Mann-Whitney test (*p < 0.05 and **p < 0.01) was used to test for statistical significance between the treated and control cell lines for each time point.
We next determined whether oxidative stress-induced tRNATyrGUA depletion is a transient response or whether it could persist upon continual exposure to stress. Exposure of cells to H2O2 once daily for five consecutive days maintained tRNATyrGUA repression as assessed by northern blot analysis (Fig 2c-d). RNA was collected on the sixth day, 24 hours after the last H2O2 exposure and as before, tRFTyrGUA induction was maintained over this time (Fig 2c-d). Such continuous H2O2 treatment repressed mature tRNATyrGUA levels by roughly half. We also assessed the effect of oxidative stress on a distinct mammalian cell line, the human bronchial epithelial cell line (HBEC30), and observed that pre-tRNATyrGUA levels dramatically declined at 1-hour post treatment, with an ensuing significant reduction in mature tRNATyrGUA levels at 24 hours (Fig 2e, Fig S2b). At 24 hours post H2O2 exposure, another control tRNA—tRNAGluCUC–remained unchanged relative to the control (Fig S2c-d). These findings reveal that stress-induced tRNA depletion can be a sustained response and that it can be elicited in multiple human cell types.
Oxidative stress-induced tRNATyrGUA depletion represses cellular growth
A possible explanation for the observed tRNA depletion effect is that it was caused by cell death. However, H2O2 at the dose used in this study did not reduce cell viability (Fig S1a). Secondly, we observed depletion of specific tRNAs rather than a global effect on all tRNAs, which would be expected if this was a consequence of a non-specific cell death phenomenon. H2O2 doses at intermediate and sublethal ranges have been shown to cause growth arrest without cell death (Martindale and Holbrook, 2002). Consistent with such prior observations, we also observed a robust growth defect upon H2O2 treatment (Fig 3a). We thus sought to determine if tRNATyrGUA depletion might contribute to growth repression as a response to oxidative stress. To determine the impact of reduced tRNATyrGUA activity on cell growth, we undertook two orthogonal approaches. The first was to deplete tRNATyrGUA through short-hairpin RNA-induced inactivation (Goodarzi et al., 2016). Using this approach, we generated a stable MCF10A cell line in which endogenous tRNATyrGUA was depleted to roughly the same level as that observed upon H2O2 treatment of cells (Fig 3b). As an independent loss-of-function approach, we sought to impair cellular utilization of tRNATyrGUA via RNAi-mediated depletion of its cognate amino acid charging enzyme—the tyrosyl-tRNA synthetase (YARS) gene (Fig 3c). Due to guanine-uracil wobble base pairing (Crick, 1966; Ladner et al., 1975; Quigley and Rich, 1976), tRNATyrGUA can recognize both codons (UAC and UAU) that code for the amino acid tyrosine. Moreover, we could not detect the other tyrosyl tRNA (tRNATyrAUA) in MCF10A cells by northern blot, suggesting that this synonymous tRNA may play a minimal, if any, role in translation in these cells and is a rare tRNA—as has been reported by others in additional mammalian cell types (dos Reis et al., 2004). We reasoned that depletion of aminoacylated tRNATyrGUA caused by YARS knockdown would phenocopy tRNATyrGUA depletion since in both cases tRNATyrGUA–mediated tyrosine incorporation into proteins is impaired. We observed that impairment of tRNATyrGUA function by either tRNATyrGUA depletion or YARS depletion using two independent hairpins strongly impaired growth of MCF10A cells (Fig 3d). These results reveal that depletion of tRNATyrGUA or inhibition of its cognate charging enzyme can significantly impair growth and phenocopy the H2O2-induced physiological depletion of endogenous tRNATyrGUA. We propose that stress-induced depletion of tRNATyrGUA constitutes an endogenous growth-repressive stress response that contributes in part to the cellular oxidative stress response.

(A) Growth curves of MCF10A cells exposed to oxidative stress (200µM H2O2) relative to control cells (n=3). Two-way ANOVA was used to test for significance.
(B) Northern blot of MCF10A cells expressing a control short-hairpin RNA or a hairpin targeting tRNATyrGUA.
(C) A western blot of MCF10A expressing a control short-hairpin RNA or a hairpin targeting the tyrosyl-tRNA synthetase, YARS (red arrow). HSC70 was used as a loading control.
(D) Growth curves of MCF10A cells expressing RNAi against mature tRNATyrGUA or YARS relative to cells expressing a control hairpin (n=3). Two-way ANOVA was used to test for significance. Data represent mean ± s.e.m. *p < 0.05, **p < 0.01, and ***p < 0.001
TRNATyrGUA depletion represses expression of a set of growth genes
We hypothesized that stress-induced tRNATyrGUA depletion impairs growth by reducing production of proteins enriched in its corresponding tyrosine codons. To search for such proteins, we conducted quantitative proteomic profiling of cells depleted of tRNATyrGUA or impaired in its aminoacylation. Label free mass-spectrometric proteomic profiling of cells depleted of tRNATyrGUA or of YARS via shRNA-mediated knockdown revealed a highly significant correlation (R=0.648; p < 2.2e-16) in the proteomic profiles of these depleted cells relative to control-hairpin expressing cells—consistent with a common set of downstream genes being impacted by these orthogonal methods of eliciting tRNATyrGUA loss-of-function (Fig S4a). Amongst proteins that became depleted upon both of these perturbations, we searched for those that were also enriched for Tyr codons and are therefore likely to be tRNATyrGUA-dependent (Fig 4a). Using this approach, we identified 102 tyrosine-enriched proteins that exhibited sensitivity to tRNATyrGUA depletion. This set of proteins was most significantly enriched in gene ontology (GO) functional categories (Ashburner et al., 2000; The Gene Ontology, 2017) associated with cellular growth, including regulation of ATP synthesis, G0 to G1 cell-cycle progression, and phosphorylation (Fig 4b). These findings reveal that tRNATyrGUA depletion represses the abundance of a set of proteins associated with growth.

(A) Cells depleted of tRNATyrGUA or YARS were processed for label free quantitation by mass spectrometry to identify proteins that were reduced by a log2-fold change of 0.5 or more. This set was overlapped with proteins containing a higher than median abundance of Tyr codon content to identify candidate mediators of the pleiotropic effects of tRNATyrGUA depletion.
(B) GO functional analysis of the 102 candidate gene-set from (A).
(C) Quantitative western blot validation depicting abundances of protein targets (EPCAM, SCD, and USP3) identified from (A). HSC70 was used as a loading control and is not modulated upon molecular perturbation of tRNATyrGUA.
(D) Quantification of western blot analysis in (C) (n=4). A one-tailed Mann-Whitney test was used to test for statistical significance between knockdown and control conditions.
(E) Growth curves for MCF10A cells were transfected with either control siRNA or two independent siRNA targeting EPCAM, SCD, or USP3. Note that the control cell growth curve is the same in all graphs and were plotted separately for clarity and does not represent independent experiments. Two-way ANOVA was used to test for significance. Data represent mean ± s.e.m. *p < 0.05, **p < 0.01, and ***p < 0.001
We selected a small set of tRNATyrGUA–regulated genes that exhibited some of the greatest fold reductions upon tRNATyrGUA depletion for further functional studies (Fig. S4b). These genes comprised ubiquitin specific protease 3 (USP3), a hydrolase that deubiquitinates histone H2A and H2B and is required for mitotic entry and S phase progression (Nicassio et al., 2007), epithelial cell adhesion molecule (EPCAM), a tumorigenic cell surface protein over-expressed in many carcinomas (Munz et al., 2009), and stearoyl-CoA desaturase (SCD), the rate limiting enzyme for generating mono-unsaturated fatty acids such as palmitoleate and oleate—principle components of membrane phospholipids and cholesterol esters (Paton and Ntambi, 2009). Quantitative western blotting revealed significant reductions in the endogenous levels of these proteins in cells upon shRNA-mediated depletion of tRNATyrGUA or YARS (Fig 4c-d). In contrast, the control protein HSC70 was not significantly depleted, consistent with our proteomic findings of a specific set of proteins being modulated upon tRNATyrGUA depletion. To determine if repressed expression of these genes indeed impairs proliferation, we depleted these genes via RNAi. Knockdown of each of these genes by two independent hairpins repressed the growth of MCF10A cells—consistent with growth-promoting roles for these genes (Fig. 4e). Our results reveal that repressing the function of a specific tRNA by depleting it or inhibiting its aminoacylation, and thus its use in translation, represses expression of a set of tyrosine enriched proteins enriched in growth-dependent processes. Moreover, depletion of tRNATyrGUA or its downstream regulated genes impairs proliferation of breast epithelial cells. We propose that this network constitutes a pro-growth tRNATyrGUA-regulated pathway and its repression via oxidative stress-induced tRNA fragmentation and depletion constitutes an adaptive growth suppressive stress response.
TRNATyrGUA depletion impairs protein translation in a codon-dependent manner
Our findings indicate that the abundance of cellular tRNATyrGUA levels regulates the protein levels of a set of growth-associated genes enriched in tyrosine codons. We hypothesized that these proteins would also be sensitive to oxidative stress-induced tRNATyrGUA depletion. To test if our target proteins become repressed upon oxidative stress, we used quantitative western blotting 24 hours after H2O2 treatment, a time point when tRNATyrGUA is depleted. Consistent with our previous experiments, we noted significant reductions in the protein levels of these tRNATyrGUA-regulated genes (Fig 5a-b).

(A) Quantitative western blot EPCAM, SCD, and USP3 in MCF10A cells 24 hours after treatment with H2O2 (200µM). HSC70 was used as a loading control.
(B) Quantification of western results in (A) (n=9). A one-tailed Mann-Whitney test was used to establish statistical significance between treated and control conditions.
(C) Examples of the mapped position of the 5’-end of reads near the start (top) or stop (bottom) codons are shown, revealing the characteristic 3-nucleotide periodicity of ribosomal positioning observed as previously described by (Ingolia et al., 2009).
(D) Histogram of the read length distribution of ribosome protected fragments observed upon ribosome profiling sequence analysis.
(E) Genes were sorted based on their changes in GC-corrected translation efficiency (TE) values, with reduced TE in tRNATyrGUA-depleted cells shown in left and enhanced TE shown on right. The red bars over each column depict the range of values in that bin. We then assessed the distribution of genes with high tyrosine codon content across these three bins using mutual information calculation and testing (see methods for details). For visualization, we used the hypergeometric distribution to assign p-values to the overlap between tyrosine-rich genes and each of the three bins. We then defined an enrichment score as –log of p-value, if there was a significant enrichment. If the overlap is significantly fewer than expected by chance, log of p-value is used instead (depletion). The resulting enrichment score is then shown as a heatmap with gold depicting positive enrichment.
Data represent mean ± s.e.m. *p < 0.05, **p < 0.01, and ***p < 0.001
These genes’ expression levels are sensitive to both the abundance of tRNATyrGUA as well as its charging enzyme—implicating modulation of ribosomal translation of this gene set in a tRNATyrGUA and tyrosine codon-dependent manner. To directly test if ribosomal engagement of tyrosine-codon enriched transcripts is impaired upon tRNATyrGUA depletion, we performed ribosomal profiling in control and tRNATyrGUA–depleted cells (Ingolia et al., 2009). We compared the ribosome protected fragments (RPFs) detected in cells with and without tRNATyrGUA depletion, in order to examine the global translational effects due to modulating a single tRNA. We observed similar length distribution and nucleotide periodicity for ribosome-protected fragments as those of previous studies (Fig 5c-d) (Ingolia et al., 2009; Lareau et al., 2014; McGlincy and Ingolia, 2017). A corrected ribosome-occupancy score was calculated for each gene as a metric for active translation in control and tRNATyrGUA–depleted cells. We then determined whether tRNATyrGUA–depletion caused a reduction in ribosome binding of transcripts enriched in its cognate codons UAC and UAU. We observed that tRNATyrGUA–depletion caused a significant reduction in ribosome engagement of transcripts significantly enriched in UAC and UAU—the codons cognate to tRNATyrGUA. Genes with distinct translation efficiencies, defined as the ratio between RPFs and mRNA fragments, were separated into three equally populated gene sets. Genes with higher tyrosine codons were significantly enriched in the set of genes with the lowest translational efficiency (denoted by the lowest red bar in Fig 5e) upon tRNATyrGUA depletion. These findings reveal that ribosomal translation of a set of tyrosine codon-enriched genes in these mammalian cells is sensitive to tRNATyrGUA levels.
Tyrosyl tRF interacts with the RNA-binding protein SSB
In addition to causing tRNATyrGUA depletion, oxidative stress also induced generation of tRFTyrGUA (Fig 1b, 2a, 2d). Significant tRFTyrGUA induction was observed at 5 minutes, remained elevated for up to 8 hours and declined to near baseline levels at 24 hours (Fig 6a-b) post H2O2 exposure. Previous studies have implicated tRFs in multiple biological processes including proliferation, cell invasion, translation, trans-generational inheritance, and cancer metastasis (Chen et al., 2016; Goodarzi et al., 2015; Honda et al., 2015; Keam et al., 2017; Kim et al., 2017; Sharma et al., 2016). One mechanism by which these tRFs have been proposed to function is through their interaction with various RNA binding proteins (RBPs) (Couvillion et al., 2010; Goodarzi et al., 2015; Haussecker et al., 2010). We hypothesized that tRFTyrGUA may not only be a degradation product of tRNA fragmentation, but may also interact in trans with an RBP. To test this, we used a synthetic tRFTyrGUA as bait in an in vitro co-precipitation experiment where the 5’-biotinylated 37-nt tRF mimetic was captured on streptavidin beads and then incubated with cellular lysate. Proteins interacting with the mimetic were identified by in-solution digestion and mass-spectrometry, and compared to proteins interacting with a scrambled mimetic. Mass spectrometry identified numerous proteins that were enriched in the tRFTyrGUA co-precipitation relative to scrambled control oligonucleotide (Fig 6c). We selected the most significantly enriched proteins—hnRNPA0, hnRNPA1, and SSB—and validated their interaction with synthetic tRFTyrGUA by western blot. Western blot analyses confirmed the mass spectrometry results, showing increased interactions between these proteins and tRFTyrGUA mimetic relative to scrambled control (Fig 6d). These results suggest that tRFTyrGUA may interact with one or more RBPs.

(A-B) Quantification of tRFTyrGUA induction in response to oxidative stress as a function of time in MCF10A (A) (n=4) and in HBEC30 (B) (n=6). A one-tailed Mann-Whitney test (*p < 0.05 and **p < 0.01) was used to test for statistical significance between the treated and control cell lines for each time point.
(C) Volcano plot of mass spectrometry results from a synthetic 5’-biotinylated tRFTyrGUA co-precipitation experiment with cell lysate. Log2 fold enrichment values of proteins identified from tRFTyrGUA relative to scrambled tRF control samples.
(D) Western blot validation of mass spectrometry results for three of the top hits in (A), showing co-precipitation of endogenous proteins with transfected tRFTyrGUA relative to a scrambled control sequence (Scr).
Data represent mean ± s.e.m.
Validation of an endogenous in vivo interaction between tRFTyrGUA and SSB
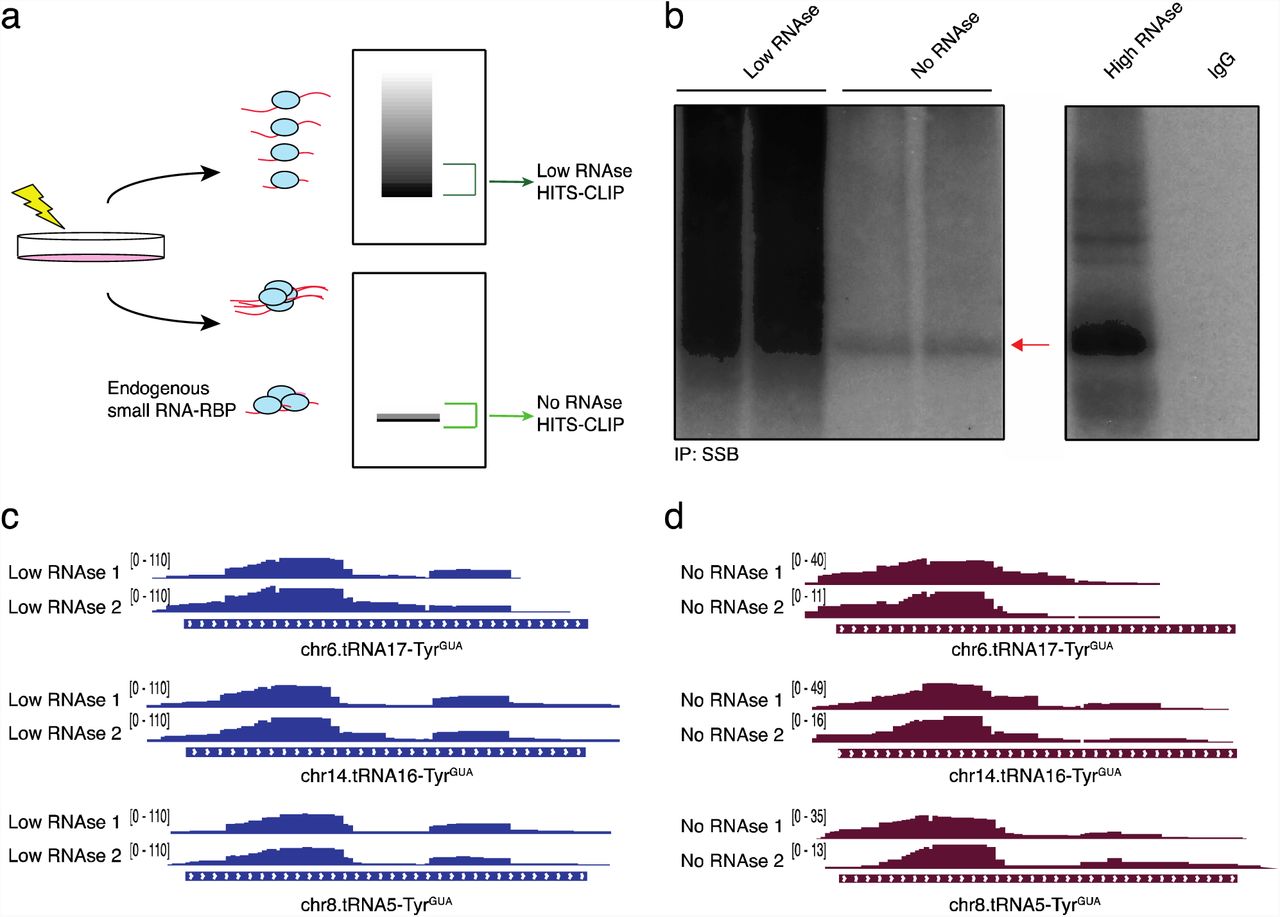
We next sought to determine if there is an endogenous interaction between tRFTyrGUA and an RBP. UV-crosslinking enables assessment of direct endogenous interactions between RBPs and their cellular RNA substrates (Mili and Steitz, 2004; Ule et al., 2003) and has been coupled with deep-sequencing methods such as HITS-CLIP or PAR-CLIP to identify the landscape of RNAs that interact with a given RBP (Hafner et al., 2010; Licatalosi et al., 2008). The initial steps of such CLIP-sequencing approaches require limited RNase digestion of immunoprecipitated ribonucleoprotein complexes prior to SDS-PAGE visualization. Such experiments have previously been done with Argonaute-2, which binds microRNAs (Chi et al., 2009), and YBX1, which binds tRFs (Goodarzi et al., 2015). These experiments have revealed well-defined bands roughly the size of the RBP, which show the RBP bound to a population of small RNAs. In contrast, for RBPs that bind mRNAs, CLIP-seq methods reveal a smear that indicates the RBP bound to a population of longer RNAs (Chi et al., 2009; Goodarzi et al., 2015) (Fig 7a). To determine if any of the candidate RBPs identified by mass spectrometry interact with endogenous small RNA populations, we included an experimental condition where the HITS-CLIP protocol was conducted in the absence of RNase digestion to ensure that any potential small RNA-RBP bands visualized were not a consequence of, or confounded by, RNase digestion. UV-crosslinked immunoprecipitation followed by SDS-PAGE in the presence or absence of RNase digestion revealed that endogenous SSB and hnRNPA1 interacted with an endogenous small RNA population (Fig 7b and Fig S5a). We did not observe a small RNA-ribonucleoprotein band for hnRNPA0 in the absence of RNase (Fig S5b), even upon prolonged autoradiographic exposure, suggesting that this RBP either does not significantly interact with a small RNA population in vivo or this method is not conducive to identifying this interaction. These findings suggest that SSB and hnRNPA1 directly interact with small RNA populations in vivo.

(A) Schematic depicting the expected visualization of a cross-linked immunoprecipitation by autoradiogram. Samples processed in the absence of RNase digestion that revealed a band corresponding to smRNA-RBP interactions were processed for HITS-CLIP. Samples processed using low RNase digestion showing a smear representing mRNA-RBP interactions by autoradiogram were also processed for HITS-CLIP.
(B) Autoradiogram of endogenous SSB (red arrow) after immunoprecipitation from UV-crosslinked cells. 32P labeled ribonucleoprotein complexes were treated with either or high concentrations of RNase A digestion prior to separation on SDS-PAGE gel.
(C) IGV plots representing SSB interacting with the 5’ end of tRNATyrGUA in samples that were treated with low levels of RNase digestion. SSB bound tRFTyrGUA reads mapped to multiple loci encoding tRNATyrGUA.
(D) Similar to the IGV plots shown in (C), but depicting SSB interactions with tRNATyrGUA loci in samples without RNase digestion.
We next sought to define the identities of the small RNAs bound by SSB. We conducted HITS-CLIP for endogenous SSB with and without RNase digestion. SSB, also known as La, is a well characterized RNA-binding protein known to bind the nascent 3’ ends of Pol III transcripts, including those of full-length pre-tRNAs (Gottlieb and Steitz, 1989; Maraia et al., 1994; Yoo and Wolin, 1997). Beyond its described nuclear roles in Pol III transcript binding, key cytoplasmic functions for SSB have also been reported including regulating translation of certain cellular and viral mRNAs (Costa-Mattioli et al., 2004; Maraia et al., 2017). Although our HITS-CLIP experiment was designed to enrich for signal from tRFs, we found that consistent with its previously described canonical role in binding Pol III transcripts, alignment and analysis of sequencing reads revealed binding of SSB to the 3’-trailers of pre-tRNAs (Fig.S5c). Importantly, in addition to this previously described binding, we observed previously unreported interactions of SSB with the 5’ half of tRNATyrGUA arising from multiple distinct loci (Fig 7c). In experiments with and without RNase, sequencing reads containing and not containing the 5’ leader region of pre-tRNATyr were detected. The 5’ leader containing reads likely represent intermediates in the pre-tRNATyrGUA processing reaction (Fig 7c-d) (Hanada et al., 2013). The abundant number of reads mapping to the 5’ regions of tRNATyrGUA distinguish these SSB-tRF interactions from the previously described canonical SSB interactions with 3’-trailers of full-length pre-tRNAs. This notion is further supported by our observations of SSB binding to the 5’ tRF without 3’-trailer binding even in the absence of RNase digestion. These observations reveal that tRFTyrGUA interacts in trans with an endogenous RBP in mammalian cells. Our findings describe that stress-induced fragmentation can cause a specific transfer RNA to become depleted, resulting in translational consequences, and also give rise to a tRNA fragment that can interact in trans with an RNA-binding protein.
DISCUSSION
Aberrant tRNA breakdown products were first detected nearly forty years ago upon analyses of urine from cancer patients (Gehrke et al., 1979). The biological and molecular roles of such small RNAs, commonly termed tRFs, have recently received considerable attention. TRFs have been implicated in processes such as hematopoiesis (Guzzi et al., 2018), cancer pathogenesis (Goodarzi et al., 2015; Lee et al., 2009), and shown to mediate effects via interactions with RNA-binding proteins (Couvillion et al., 2010; Goodarzi et al., 2015) or messenger RNAs (Kim et al., 2017). Early studies of specific tRFs in Saccharomyces cerevisiae revealed that the specific tRNA pools studied were not impacted upon tRNA fragmentation (Saikia et al., 2012; Thompson and Parker, 2009b). Similar observations were made in mammalian systems for specific tRFs (Yamasaki et al., 2009). By comprehensively surveying global tRF generation and tRNA abundances, we have identified specific tRNAs (tRNATyrGUA, tRNALeuUAA, and others) for which significant depletion occurs during stress-induced fragmentation. Such stress-induced depletion, in the case of tRNATyrGUA, resulted in functional consequences of tyrosine codon-dependent translational repression and growth suppression.
The advent of numerous methods that enabled profiling of tRNAs revealed widespread alterations in tRNA expression levels in cancer (Gingold et al., 2014; Goodarzi et al., 2016; Pavon-Eternod et al., 2009). Genomic copy number gains at tRNA loci have been shown to account for enhanced expression of specific tRNAs that functionally drive cancer progression (Goodarzi et al., 2016; Truitt and Ruggero, 2016). This has raised the question of whether in the absence of genomic instability, endogenous pathways exist for physiological modulation of tRNA levels with functional consequences. Our observations reveal that in non-malignant epithelial cells, there exists an oxidative stress response pathway that represses growth upon selective tRNA depletion. The consequence of this response is repressed translation of a set of growth promoting genes. This tRNA depletion response likely cooperates with other cellular oxidative response pathways (Martindale and Holbrook, 2002). While our work has interrogated the consequences of tRNATyrGUA depletion, future work is needed to determine the impact, if any, of depletions of other tRNAs that were observed to generate fragments and also become depleted. Two such examples are tRNALeuUAA and tRNALeuCAG. Interestingly, although there exist six isoacceptor tRNAs for leucine, we only observed significant concomitant tRF induction and tRNA depletion for these two isoacceptors, suggesting potential tRNA fragmentation selectivity amongst the isoacceptors for a given amino acid, with potential for codon-biased translational consequences.
Previous studies have looked at modulating levels of tRNAs and its effects on translation in E. coli (Wohlgemuth et al., 2013; Zhong et al., 2015). Consistent with our findings, the studies in E. coli have revealed that protein translation can be regulated by tRNA bioavailability. While oxidative stress has been observed to repress global tRNA levels in E. coli (Zhong et al., 2015), our results reveal that in mammalian cells, there is a selective tRNA and codon-dependent response to oxidative stress. The differences open up the possibility that eukaryotic or mammalian cells have found mechanisms whereby certain sets of tRNAs or pre-tRNAs may be selectively impacted by diverse cellular stresses. Future studies are warranted to investigate these possibilities. While we do not yet know the mechanistic basis for this selectivity, we speculate that the tRNAs that become modulated upon oxidative stress may be of lower relative abundance compared to other unaffected tRNAs or that various steps in tRNA processing might be targets of regulation. In humans, all tRNATyrGUA isodecoder genes have introns that require splicing to generate mature tRNAs. Our observed tRNATyrGUA-dependent response initiates at the pre-tRNATyrGUA level, giving rise to tRFs, and consequently reduces the abundance of mature tRNATyrGUA.
Further investigation into tRNA processing may elucidate additional mechanisms by which cells post-transcriptionally regulate protein expression. Dysregulated tRNA splicing, for example, has been previously implicated in human disease. Aberrantly generated tRFs derived from pre-tRNA introns have been linked with human neuronal degeneration (Karaca et al., 2014; Schaffer et al., 2014). Furthermore, by reacting with nucleic acids, proteins, and lipids, reactive oxygen species can cause global cellular dysfunction (Cross et al., 1987; Radi, 2018). Consistent with this, oxidative stress has been implicated or associated with a myriad of human diseases including Parkinson’s, ALS, Alzheimer’s, cardiovascular disease, and cancer pathogenesis (Cervantes Gracia et al., 2017; Lin and Beal, 2006; Piskounova et al., 2015). Exposure of mouse neurons and MEFs to oxidative stress was previously shown to elicit fragmentation of tRNAs, including tyrosyl tRNA (Hanada et al., 2013). Sequencing analysis revealed generation of fragments from tyrosyl pre-tRNA—similar to our observations (Fig. 1a). This past work, however, did not assess the subsequent impact of tRF formation on pre-tRNA or tRNA abundances in the neural cells under study. It would be of interest to determine if oxidative stress-induced fragmentation could also functionally deplete the corresponding tRNA pool in non-mitotic neurons in a manner similar to that we observed in mitotic epithelial cells in this study.
In addition to the depletion of tRNATyrGUA in response to oxidative stress, we have implicated SSB/La as an RNA binding protein that directly interacts with tRFTyrGUA. SSB/La has numerous cellular functions, perhaps chief among them being pre-tRNA processing (Gottlieb and Steitz, 1989; Wolin and Cedervall, 2002). While future work is necessary to define the potential regulatory role of this interaction, the interaction of a stress-induced tRNA fragment with a central regulator of physiological tRNA processing suggests a potential regulatory feedback loop that may impact tRNA maturation upon stress induction. Interestingly, past studies have implicated tRFs in impairing stability and expression of translation genes (Goodarzi et al., 2015) and altering the expression of a ribosomal transcript (Kim et al., 2017). These studies in total suggest a natural link between tRFs and the cellular process in which their precursor molecules (tRNAs) participate.
Our findings raise a number of questions for future study. Firstly, could tRNATyrGUA fragmentation and depletion occur during normal development and physiology to mediate growth repression? Oxidative species are generated during cellular respiration and may endogenously activate this response. Moreover, immune cells generate free radicals as a means of combatting pathogens (Dahlgren and Karlsson, 1999; Radi, 2018). Such processes may modulate tRNATyrGUA levels and elicit growth phenotypes. Independent of oxidative stress, tRNATyrGUA fragmentation and depletion may be regulated via other stresses, signaling pathways, developmental events or in the context of normal physiology. Developmental surveys of tRFTyrGUA or tRNATyrGUA levels in diverse tissues may shed light on these possibilities. More broadly, our studies of tRNA modulation by oxidative stress raise the possibility that additional stresses may generate similar or distinct tRNA fragmentation and depletion effects, which may mediate coherent gene-regulatory responses. The degeneracy of the genetic code coupled with the wide spectrum of metabolic modifications on tRNAs positions tRNAs as ideal molecules for ‘sensing’ metabolic derangements and mediating rapid transcription-independent gene expression responses.
EXPERIMENTAL PROCEDURES
Cell culture
MCF10A cells were cultured in DMEM/F12 media supplemented with 5% horse serum and final concentrations of 20 ng/ml of EGF, 0.5 mg/ml of hydrocortisone, 100 ng/ml of cholera toxin, and 10 µg/ml of insulin. HBEC30 cells were cultured in keratinocyte-SFM media with the included supplements of BPE and EGF. MDA-MB-231 cells were cultured in DMEM media supplemented with 10% FBS, L-glutamine, and sodium pyruvate. To induce oxidative stress, cells were incubated with 200µM H2O2 in their respective medias for the time specified in each experiment. RNA was then isolated by TRIzol and isopropanol precipitation as described below.
Stable cell line generation
Lentivirus was produced in 293T cells grown in 10 cm plates. 3 µg of each packaging vector (pRSV-Rev, pCMV-VSVG-G, and pCgpV) were transfected with 9 µg of the appropriate hairpin in a pLKO-backbone vector using 30 µl of Lipofectamine 2000 (Invitrogen). After 24 hours, the media was replaced with fresh media and virus-containing supernatant was harvested 48 hours after transfection. The supernatant was filtered through a 0.45 µm filter before 2 ml of virus was transduced into MCF10A plated in 6-well plates with 8 µg/ml of polybrene. Media was changed after 24 hours and antibiotic selection with 1 µg/ml of puromycin was started 48 hours after virus transduction. Cells were selected for 3-5 days with a population of non-transduced cells as a control. Knockdown of mRNA and protein were validated by qRT-PCR and western blot, respectively, while knockdown of tRNA was validated by northern blot.
RNA isolation and purification
RNA was extracted from cells using TRIzol and isopropanol precipitation at −20°C overnight. After centrifugation at max speed (∼21,000 x g) in a refrigerated tabletop centrifuge, the RNA pellet was washed twice with ice-cold 75% EtOH before being resuspended in RNase free water or TE-buffer.
Northern blotting
Purified RNA was run on a 10% Urea-PAGE gel before being transferred onto a nylon membrane and UV crosslinked (240 mJ/cm2). The membrane was pre-hybridized in UltraHyb-Oligo buffer (Ambion) at 42°C. DNA oligos were radiolabeled with [γ-32P]ATP using T4 PNK (NEB) and further purified by G-25/G-50 columns before incubating with the blot overnight. After hybridization, the blot was washed twice with SSC and SDS buffers before being developed. Probes that were 32P labeled and used for detection were: ACAGTCCTCCGCTCTACCAGCTGA (tRNATyrGUA), CAGCGCCTTAGACCGCTCGGCCA (tRNALeuHAG), GCGCCGAATCCTAACCACTAGACCA (tRNAGluCUC), CACGAATTTGCGTGTCATCCTT (U6).
Quantification was done using FIJI (ImageJ) where the intensity of each band over background was measured and normalized to U6 levels.
Quantitative LC-MS/MS proteomic profiling
For label-free quantitation analysis of protein levels by mass spectrometry, tRNATyrGUA-depleted cells with RNAi against YARS or tRNATyrGUA were compared to cells with control RNAi. For each set of samples, 50ug lysates (n=3 per condition) were ice-cold acetone precipitated. Precipitates were dissolved in 50uL 8M Urea/0.1M ammonium bicarbonate/10mM DTT. After 45 minutes of incubation at room temperature, reduced cysteines were alkylated with iodoacetamide (Sigma) in the dark for 45 minutes. Volumes were diluted 2-fold and proteins were digested overnight with 1 µg Lysyl Endopeptidase (Wako). Prior to trypsinization (1ug) (Promega) the samples were diluted additional 2-fold (0.1 M ammonium bicarbonate). After 8h, the digestions were halted by the addition of neat TFA (Sigma) and then peptides were desalted and concentrated using stage tips.
Peptides were separated using a direct-loading setup with a 50cm EasySprayer C18 column (ES80, Thermo). Peptides were eluted using a gradient increasing from 2% B/98% A to 45% B/55% A (A: 0.1% formic acid, B: 80% acetonitrile/0.1% formic acid) in 220 minutes. The gradient was delivered at 300nL/min (Easy 1200, Thermofisher). The mass spectrometer (Fusion Lumos, Thermo Fisher) was operated in High/High mode with MS and MS/MS mass resolution being 120,000 and 30,000, respectively. For MS/MS, Automatic Gain Control was set to 1e5 with a maximum injection time of 54 ms. MS-data were queried against Uniprot’s Human Complete Proteome (70,246 sequences, March 2016) using MaxQuant v1.6.0.13. Oxidized methionine and protein N-terminal acetylation were allowed as variable modifications and up to 2 missed cleavages were allowed.
Proteins were quantitated using MaxQuant’s ‘Label Free Quantitation’ (LFQ) feature and signals were required in minimum 2-of-3 replicates for at least one condition (4,753 proteins quantitated). Missing LFQ values where imputed. All data analysis was carried out using Perseus v1.6.0.7.
Western blotting
Cells were lysed in ice-cold RIPA buffer containing a protease inhibitor cocktail (Roche) before cellular debris was cleared by centrifugation at max speed in a refrigerated tabletop centrifuge. Samples were heated with LDS buffer and reducing agent before running on an SDS-PAGE gel and transferred onto a PVDF membrane (Bio-Rad). The membranes were blocked and then probed using target-specific antibodies. Antibodies used were YARS (Abcam, ab150429, 1:1000), EPCAM (Proteintech, 21050-1-AP, 1:1000), SCD (Proteintech, 23393-1-AP, 1:1000) USP3 (Proteintech, 12490-1-AP, 1:1000), SSB (MBL, RN074PW, 1:1000), hnRNPA1 (Santa Cruz, sc-32301, 1:1000), and hnRNPA0 (Bethyl Laboratories, A303-941A, 1:1000). Loading controls used were alpha-Tubulin (Cell Signaling, 2144, 1:2000) and HSC70 (Santa Cruz, sc-7298, 1:2000). Chemiluminescent signal was detected by HRP-conjugated secondary antibodies, ECL western blotting substrate (Pierce), and the SRX-101A (Konica Minolta) developer according to manufacturer’s instructions. Membranes were stripped (Restore western blot stripping buffer, Pierce), blocked, re-probed, and re-developed if necessary.
Quantitative western blotting
To compare protein expression levels by western blot, the Odyssey® quantitative western blotting system (LI-COR) was used. This method is identical to western blotting except membranes were blocked in Odyssey® blocking buffer (PBS) and the secondary antibody used was a species-specific fluorescent IRDye®. Membranes were then imaged using the Odyssey® Sa Infrared Imaging System at the Rockefeller University Center for High Throughput Screening. Image quantification was done using Image Studio™ Lite and an unpaired t-test was used to determine statistical significance.
Quantitative RT-PCR
To measure mRNA transcript levels, RNA was converted to cDNA (SuperScript III, Life Technologies) followed by Fast SYBR™ Green quantification (Life Technologies) according to manufacturer’s instructions. Primers used for qRT-PCR were: YARS: CTGCACCTTATCACCCGGAAC, TCCGCAAACAGAATTGTTACCT, EPCAM: AATCGTCAATGCCAGTGTACTT, TCTCATCGCAGTCAGGATCATAA, SCD: TCTAGCTCCTATACCACCACCA, TCGTCTCCAACTTATCTCCTCC, USP3: CAAGCTGGGACTGGTACAGAA, GCAGTGGTGCTTCCATTTACTT, HPRT: GACCAGTCAACAGGGGACAT, CCTGACCAAGGAAAGCAAAG.
Small RNA sequencing
MCF10A cells were seeded at 50% confluency in duplicate into 10 cm plates. The next day, cells were exposed to 200µM H2O2 for one hour before cells were harvested for RNA purification. Small RNA was purified using the microRNA purification kit (Norgen Biotek Corp) according to manufacturer’s instructions. Small RNA sequencing was performed using the NEXTflex→ Small RNA Sequencing Kit v3 (BiooScientific). Different samples were barcoded before being sequenced on the HiSeq 2000 Illumina sequencer.
For computational analysis, fastq files were aligned to hg19 using bowtie2, and reads were further sorted, indexed, and counts were generated with samtools. Raw counts were imported into RStudio V1.1.383 and differential analysis was performed using DESeq2.
Cell growth assays
300,000 or 400,000 cells were seeded into two 6-well plates. Cells were trypsinized and viable cells were counted using a trypan blue and a hemocytometer on days 1 and 3 after seeding. Each experiment included three technical triplicates and was repeated three times. Two-way ANOVA was used to test for significance.
For growth assays with siRNA-mediated gene knockdown, cells were reverse transfected with siRNA (IDT) and Lipofectamine RNAimax (Invitrogen) so that they would be 70-80% confluent in a 10 cm plate. The following day, cells were seeded at a density of 200,000 cells per 6-well plate and counted on days 1 and 3 after seeding into 6-well plates. As before, two-way ANOVA was used to test for significance.
Cell viability assays
MCF10A cells were seeded into 6-well plates and treated with 200µM H2O2 for one hour. This media was retained while cells were trypsinized and cells were resuspended in the previous media that would contain any cells that had died prior to trypsinization. Cell viability was measured using trypan blue exclusion and a hemocytometer. Viability was determined by (Total number of cells counted – Number of blue (nonviable) cells) / Total number of cells counted. Each experiment included three technical triplicates and was repeated two times. An unpaired t-test was used to test for significance.
Transfer RNA profiling
MCF10A cells were cultured in duplicates to be 50% confluent in 10 cm plates. Cells were then exposed to 200µM H2O2 for 8 hours or 24 hours before RNA was isolated by TRIzol as previously described. Transfer RNA profiling was done as described by (Goodarzi et al., 2016). Briefly, biotinylated probe-pairs against nuclear encoded tRNAs were designed to hybridize to each half of the tRNA. A nick at the anticodon end of the DNA-RNA hybrid was filled using T4 DNA ligase and SplintR ligase (NEB). MyOne-C1 Streptavidin Dynabeads (Invitrogen) were used to purify the DNA-RNA hybrids and ligated probes were eluted following RNase H and RNase A incubation. Eluted probes were PCR amplified and high-throughput sequenced.
For computational analysis, fastq files were aligned to tRNA probe sequences using bowtie2, and reads were further sorted, indexed, and counts were generated with samtools. Raw counts were imported into R V3.4.1 and normalized with EdgeR. Linear regression tests were used to assess tRNAs that were significantly depleted at 8 and 24 hour conditions relative to control conditions.
Whole-genome ribosomal occupancy profiling
This procedure was conducted as described by (McGlincy and Ingolia, 2017). Briefly, cells were washed and flash frozen with liquid N2 before being lysed with lysis buffer containing cycloheximide (Alfa Aesar). Lysate was digested with RNase I (Lucigen) before ribosomes were isolated through ultracentrifugation through a sucrose cushion. The ribosome pellet was resuspended in a solubilization buffer containing 0.5% SDS and 1mM EDTA and TRIzol before RNA was extracted using the Direct-zol kit (Zymo Research). RNA was separated on a 15% TBE-Urea gel before RNA between 17nt and 34nt were gel extracted. Barcoded pre-adenylated linkers were ligated on using T4 RNA ligase 2 truncated K227Q (NEB) and rRNA was depleted using the Ribo-Zero gold kit (Illumina) according to the manufacturer’s protocol. RNA was converted to cDNA using SuperScript III (Life Technologies) and the RT product was circularized by CircLigase II (Epicentre). A PCR library was amplified and sequenced using Illumina Nextseq 500 at the Rockefeller University Genomics Center.
For the ribosome footprinting data, reads were first subjected to linker removal and quality trimming (cutadapt v1.17). The reads were then distributed among the samples based on their assigned barcodes using fastx_barcode_splitter (using --eol and --mismatches 1). The reads were then collapsed and UMIs were extracted in two steps (2 at the 5′ end and 5 at the 3′ end) using UMI Tools. The reads were then aligned against a reference database of rRNAs and tRNAs as to remove contaminants (using bowtie 2.3.4.1). STAR was then used to align the remaining reads to the human transcriptome (build hg38). PCR duplicates were then removed using UMI Tools. Xtail (Xiao et al., 2016) was used to count RPFs, estimate translation efficiency, and perform statistical comparisons. For RNA-seq data analysis, reads were first subjected to quality trimming and adapter removal. STAR (v2.5.2a) was used to align the reads to the human transcriptome (hg38). The number of reads mapping to each gene was counted using htseq-count.
Analysis of translation efficiency from ribosome profiling
The logTER (log2 of translation efficiency ratio) between shTyr and shControl samples calculated by Xtail showed a substantial and significant GC bias. As such, prior to further analysis, we first corrected the logTER values by fitting a linear model based on GC content of each genes as the co-variate. We then used the GC-independent residual values for further analysis. We asked whether stratifying genes based on their Tyr content is informative of corrected TER measurements. For this, we performed a t-test between two groups defined by the Tyr content of the 75th percentile. At this threshold, we observed a significantly lower TE for in the shTyr samples (P<0.0002). To perform a confirmatory analysis, we also performed a gene-set analysis using our iPAGE platform (Goodarzi et al., 2009). This analysis also revealed a significant enrichment of genes with high Tyr content (same threshold as above) among those in the bottom tertile of the GC-corrected logTER values.
Using the tRFTyrGUA mimetic to identify interacting proteins
A 5’ biotinylated 37-nucleotide tRFTyrGUA mimetic and a control oligo that was a scrambled version of the tRFTyrGUA were synthesized (IDT). Each mimetic was incubated at 4°C with equal amounts of MCF10A cell lysate containing protease inhibitor that had been pre-cleared for debris and by the control oligo. Proteins that bound to our mimetic were co-precipitated by MyOne-C1 Streptavidin Dynabeads (Invitrogen) and washed twice with a low salt wash buffer (50mM Tris-HCl pH 7.5, 150mM NaCl) and twice with a high salt wash buffer (50mM Tris-HCl pH 7.5, 400mM NaCl) before being submitted to the Rockefeller University Proteomics Resource Center.
SSB HITS-CLIP with and without RNase
HITS-CLIP for endogenous SSB was done as described by (Licatalosi et al., 2008) with the modifications previously used for YBX1 small RNA CLIP (Goodarzi et al., 2015). MDA-MB-231 cells were UV-crosslinked at 400 mJ/cm2 before cell lysis. Samples with and without RNase treatment were immunoprecipitated with an anti-SSB antibody (MBL, RN074PW) for protein-RNA complexes. Polyphosphatase (Epicentre) was incubated with smRNA samples before PCR amplification with primes described by (Goodarzi et al., 2015) Constructed libraries were sequenced on the Illumina HiSeq2000 at the Rockefeller University Genomics Center.
The CTK package (Shah et al., 2017) was used to analyze the SSB HITS-CLIP data. First, reads were distributed to individual samples based on the integrated 4nt barcodes. The reads were then collapsed, trimmed, and aligned to the human genome (hg19) using bwa (0.7.17-r1188; -n 0.06 -q 20). The CTK toolkit was then used parse the alignments, remove PCR duplicates, and call mutations in reads. The results from biological replicates were then combined and the CIMS tool (CTK) was used to call peaks (FDR<0.1).
AUTHOR CONTRIBUTIONS
S.F.T. conceived the project and supervised all research. S.F.T and D.H. wrote the manuscript. D.H., M.C.P., L.F., H.M., E.A.M., and H.G designed, performed, and analyzed the experiments.
Figure S1. The fragmentation of tRNATyrGUA in response to oxidative stress is not due to cell death.
(A) The viability of MCF10A cells after H2O2 treatment (200µM) was tested by a trypan blue exclusion assay (n=6). Viability was tested one hour after exposure to oxidative stress. A two-tailed Mann-Whitney test was used to test for statistical significance between the treated and control cell lines for each time point. (B) The log2 fold induction for all isoacceptors in the overlapping set of tRNAs that are reduced upon oxidative stress and for which their corresponding tRFs are induced upon the same stress. Data represent mean ± s.e.m.
Figure S2. Fragmentation of tRNAs in response to oxidative stress is observed for multiple tRNAs and cell lines.
(A) Northern blot for tRFTyrGUA and tRFLeuHAG in MCF10A cells at one hour post oxidative stress (200µM H2O2) exposure. (B) A northern blot depicting a time course experiment ranging from five minutes to 24 hours for HBEC30 cells in response to oxidative stress (200µM H2O2). As before, a single probe complementary to pre-tRNATyrGUA, mature tRNATyrGUA, and tRFTyrGUA was 32P-labeled and used for detection. (C) A northern blot depicting two time points two time points, one hour and 24 hours, after exposure to oxidative stress (200µM H2O2) in MCF10A cells. As before, a single probe complementary to pre-tRNATyrGUA, mature tRNATyrGUA, and tRFTyrGUA was while another probe complementary to the mature tRNAGluCUC were both 32P-labeled and used for detection. (D) Quantification of tRNATyrGUA and tRNAGluCUC by northern blot analysis from two independent experiments 24 hours (normalized to U6 levels) after exposure to oxidative stress (200µM H2O2) are shown (n=4). A one-tailed Mann-Whitney test (*p < 0.05) was used to test for statistical significance between the treated and control cell lines for each time point. Data represent mean ± s.e.m.
Figure S3. Depleting functional levels of tRNATyrGUA by knocking down YARS, the tyrosyl-tRNA synthetase.
(A) Total mRNA from MCF10A cells stably expressing a short hairpin targeting YARS was analyzed by quantitative RT-PCR. The two cell lines with the best knockdown were used for subsequent experiments. A one-tailed Mann-Whitney test (*p < 0.05) was used to test for statistical significance between the treated and control cell lines for each time point. Data represent mean ± s.e.m.
Figure S4. Proteomic analysis identifies a tRNATyrGUA-dependent gene-set.
(A) A plot showing the correlation between protein abundance changes in the proteome upon either tRNATyrGUA depletion or YARS depletion (shYARS-2) relative to control cells. A Pearson’s two-sided test was used to test determine the statistical significance of the correlation between tRNATyrGUA and YARS depletion effects across the detected proteome. (B) A schematic showing locations of all tyrosine residues in the coding sequence of three target genes, EPCAM, SCD, and USP3. (C) Levels of mRNA expression for target genes in cells depleted of either tRNATyrGUA or YARS as measured by qRT-PCR (n=4). A one-tailed Mann-Whitney test was used to test for statistical significance between the knockdown and control cell lines’ gene expression values. (D) Total mRNA from MCF10A cells transiently transfected with two independent siRNA targeting EPCAM, SCD, or USP3 was analyzed by quantitative RT-PCR at the end of each growth assay. A one-tailed Mann-Whitney test was used to establish statistical significance (n=3 except for siSCD-2 has n=2). Data represent mean ± s.e.m. *p < 0.05
Figure S5. Validation of interactions between RBPs with endogenous smRNAs.
(A-B) Autoradiograms of immunoprecipitations from cross-linked cells for endogenous hnRNPA1 (A) and hnRNPA0 (B). 32P labeled ribonucleoprotein complexes with either no, low, or high concentrations of RNase A digestion before separating on SDS-PAGE gels. (C) IGV plots from the SSB HITS-CLIP reveals protein binding to the 3’ trailer end of pre-tRNAs arising from distinct tRNA loci.
ACKNOWLEDGEMENTS
We are grateful to the members of our lab for their insightful comments on past versions of this manuscript. We are grateful to C. Zhao, C. Lai, and N. Nnatubeugo of the Rockefeller Genomics Resource Center for assistance with next-generation sequencing. D.H. and M.C.P. were supported by a Medical Scientist Training Program grant from the National Institute of General Medical Sciences of the National Institutes of Health under award number T32GM007739 to the Weill Cornell/Rockefeller/Sloan Kettering Tri-Institutional MD-PhD program. E.A.M was supported by NIH training grant T32 CA 9673-39. The research of S.F.T. was supported in part by a Faculty Scholar grant from the Howard Hughes Medical Institute and by the DOD Collaborative Scholars and Innovators Award (grant W81XWH-12-1-0301), Pershing Square Sohn award, Breast Cancer Research Foundation award, Reem-Kayden award, and NIH grant 5R01CA215491-02.
REFERENCES


