

Abstract
Premature birth is the commonest cause of death and disability in young children. Diffuse white matter injury (DWMI), provoked by inflammatory insults accompanying prematurity, is associated with increased risk of neurodevelopmental disorders – such as autism spectrum disorders – and is due to maturation arrest in oligodendrocyte precursors (OPCs). The lack of therapeutic solutions is a strong impetus to unveil the molecular mechanisms underlying neuroinflammation impact on OPC cell fate. We used a validated mouse model of DWMI, induced by systemic- and neuro-inflammation – as observed in preterm infants – and based on interleukin-1B administration from postnatal day P1 to P5. Using integrated genome-wide approaches we showed that neuroinflammation induced limited epigenomic disturbances in OPCs, but marked transcriptomic alterations of genes of the immune/inflammatory pathways. We found that these genes were expressed in control OPCs and physiologically downregulated between P3-P10, as part of the OPC normal developmental trajectory. We observed that transcription factors of the inflammatory pathways occupied DNA both in unstressed and inflamed OPCs. Thus, rather than altering genome-wide chromatin accessibility, neuroinflammation takes advantage of open chromatin regions and deeply counteracts the stage-dependent downregulation of these active transcriptional programs by the sustained upregulation of transcript levels. The intricate dual roles – stress-responsive and potentially developmental – of these proinflammatory mediators strongly suggest that the mere suppression of these inflammatory mediators, as currently proposed, may not be a valid neurotherapeutic strategy. Our study provides new insights for the future development of more targeted approaches to protect the preterm brain.
Significance statement Neuroinflammation provokes premature birth, the commonest cause of death and disability in children, including autism. Neuroinflammation-induced neurological damage encompasses white matter injury. The actual therapeutic strategies are orientated towards global repression of proinflammatory actors. We explore the epigenomic and transcriptomic impacts of neuroinflammation on a purified cell population of oligodendrocyte precursors cells (OPCs). Rather than altering genome-wide chromatin accessibility, neuroinflammation takes advantage of open chromatin regions and deeply counteracts the stage-dependent downregulation of these active transcriptional programs, in particular that of the inflammatory pathway. These proinflammatory genes are constitutively expressed by OPCs and their physiological downregulation during OPC maturation process is counteracted by neuroinflammation. The intricacy between the OPC physiological and neuroinflammation-responsive expression of these proinflammatory mediators reorientates neuroprotective strategies.
INTRODUCTION
Premature birth, namely birth before 37 of 40 completed weeks, occurs in 8-13 % of all births worldwide and is the commonest cause of death and disability in children under 5 years of age (1). Life-long morbidity is predominantly due to neurological damage, which altogether includes an array of effects, collectively called “encephalopathy of prematurity” (2). Almost 10% of infants born before 33 weeks develop Cerebral Palsy and approximately 35% have persistent cognitive and neuropsychiatric deficits, including autism spectrum disorders and attention deficit/hyperactivity disorder (3). Although the most severe problems stem from extreme prematurity, even slight reductions in gestational length have significant adverse effects. One of the hallmarks of encephalopathy of prematurity is diffuse white matter injury (DWMI), which is considered a key target for neuroprotection and the prevention of long-lasting handicap. DWMI is due to oligodendrocyte maturation arrest, leading to hypomyelination and ultimately to defects in grey matter connectivity (1, 4,5). In that context, neuroinflammation is a leading cause of encephalopathy of prematurity, serving as a central mediator of oligodendrocyte maturation defects and hypomyelination (6,7).
We have previously validated a mouse model of encephalopathy of prematurity that recapitulates arrest in oligodendrocyte maturation, hypomyelination, cognitive deficits and neuroinflammation, as seen clinically (8–11). In this model, the common exposure of preterm-born infants to systemic and central inflammation (neuroinflammation) that is known to drive encephalopathy is mimicked by intraperitoneal (i.p.) administration of interleukin 1B (IL1B) from postnatal days 1 to 5 (P1-P5). The similarities of this model to clinical conditions include that male mice are more severely affected than female mice (8,9). As such, the studies on OPC are performed in male animals. This developmental window (P1-P5) is equivalent to the high-risk window for encephalopathy of prematurity in infants, 23-32 week gestational age. This paradigm of preterm injury causes long-term myelination defects (8) suggesting that these prenatal adversities cause deviations from the delicately choreographed programs that control OPC maturation, creating a cell fate issue.
Here, using a purified population of premyelinating OPCs and integrated genome-wide approaches from this animal model, we have explored the contribution of epigenomic and transcriptomic disturbances to the OPC dysmaturation. We show that at P5 a limited number of chromatin regions are perturbed. We also find that the genes, whose expression levels are the most significantly altered by neuroinflammation, are involved in the immune system and inflammatory response. These genes, which include cytokines and chemokines, are unexpectedly expressed by OPCs, also in normal conditions, in a developmentally regulated manner: their expression is higher at early stages and downregulated at further steps of their maturation. The stage-dependent downregulation of these genes is perturbed in OPCs isolated from our inflammatory model of encephalopathy, which provokes a marked upregulation of their expression – likely participating to the failure of these cells to mature correctly.
These major transcriptomic disturbances surprisingly occur in genes which exhibit no overt changes in chromatin accessibility at P5. Indeed, our evidence suggests that neuroinflammation takes advantage of transcriptional programs that are active at the time of exposure – namely open chromatin regions - and disturbs their developmental regulation.
We have therefore unraveled a mechanism by which neuroinflammation acts on OPCs leading to maturation arrest in a model mimicking perinatal inflammation in preterm born infant. Indeed, the unexpected expression of numerous inflammatory genes by OPCs during their normal stage-dependent maturation likely paves the way for intricate interference between the response to neuroinflammatory insults and the white matter developmental program, with important implications for therapeutic strategies.
RESULTS
Characterization of O4+-purified cell populations used for exploration of the epigenome and transcriptome
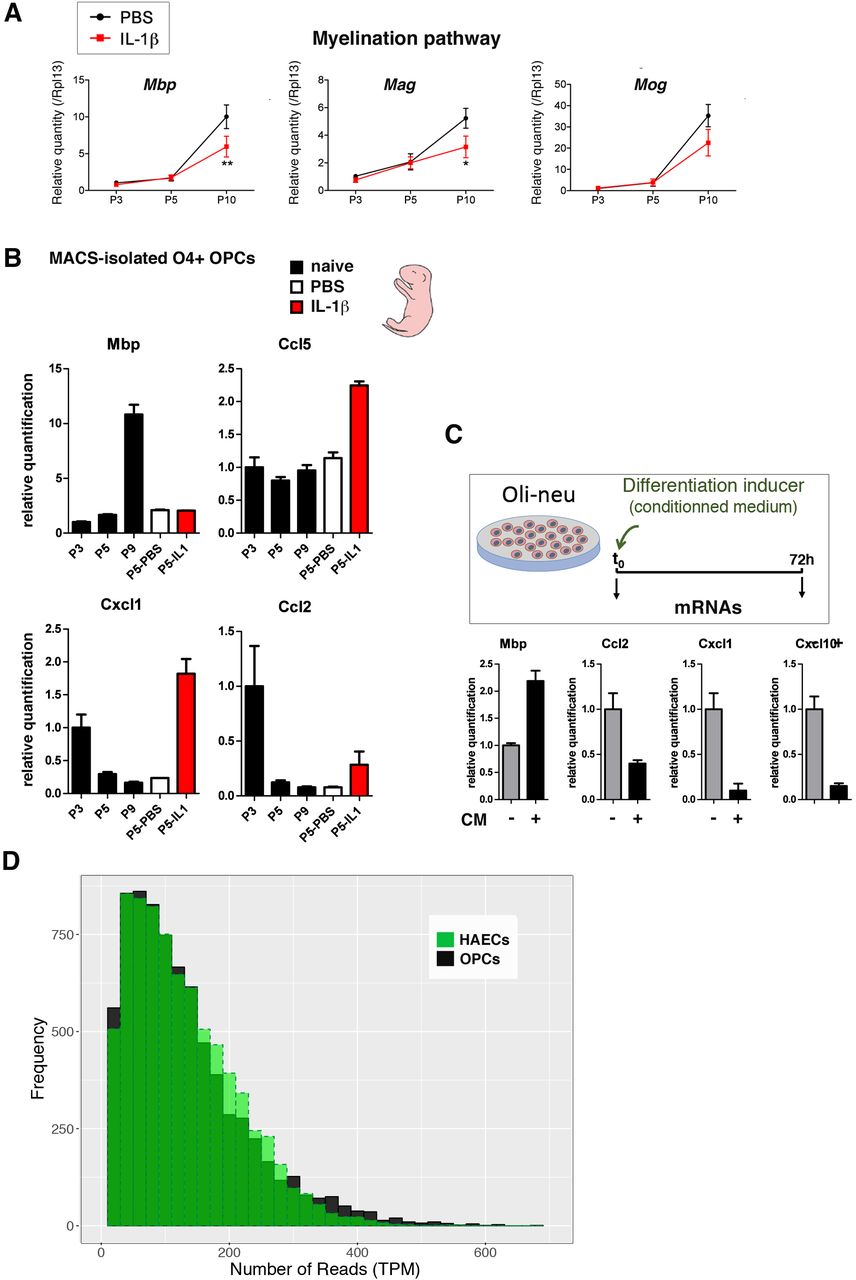
In our previous studies we have demonstrated that oligodendrocyte maturation arrest is a hallmark of neuroinflammation triggered by IL1B intraperitoneal administration (IP). As outlined above and in Figure 1, IL1B was administrated (versus PBS as a control; Fig. 1; 8–11) between P1 and P5; this period mimics chronic exposure to systemic neuroinflammatory mediators from 23-32 weeks of gestation in the infant. Using magnetic-activated cell sorting (MACS), we isolated at P5 the premyelinating OPC population (O4+ OPCs) from male cortices in each condition (Fig. 1). O4 is considered a pan-OPC marker in humans and mice (2, 8). We evaluated the purity of the O4+ population by performing RT-qPCR analyses, and demonstrated that this population, but not microglial (CD11B+) isolated fractions, expressed Myelin binding protein (Mbp) mRNAs (Fig. S1A). In addition, we found almost undetectable levels of the microglia marker mRNAs, CD11B (Itgam, Integrin alpha M gene) in the O4+ population. This suggests that this population indeed corresponds to premyelinating OPCs. Notably, we collected comparable numbers of O4+ OPCs from control (PBS) and treated (IL1B) samples (1.12 × 10⁶+/− 0.12 × 10⁶ cells per sample). In independent RT-qPCR experiments, as expected based on previous studies using this model (8), we observed that the expression of Id2, a transcriptional regulator associated with a pre-OPC maturation state, was increased in O4+ OPCs in response to neuroinflammation, whereas that of myelination-associated genes was reduced (Fig. S1B). Overall, these data show that the cell population isolated by our MACS-protocol is predominantly enriched with O4+ OPCs and that this isolated O4+ OPC population exhibits hallmarks of maturation arrest, as expected in response to neuroinflammation induced by intraperitoneal administration of IL1B.
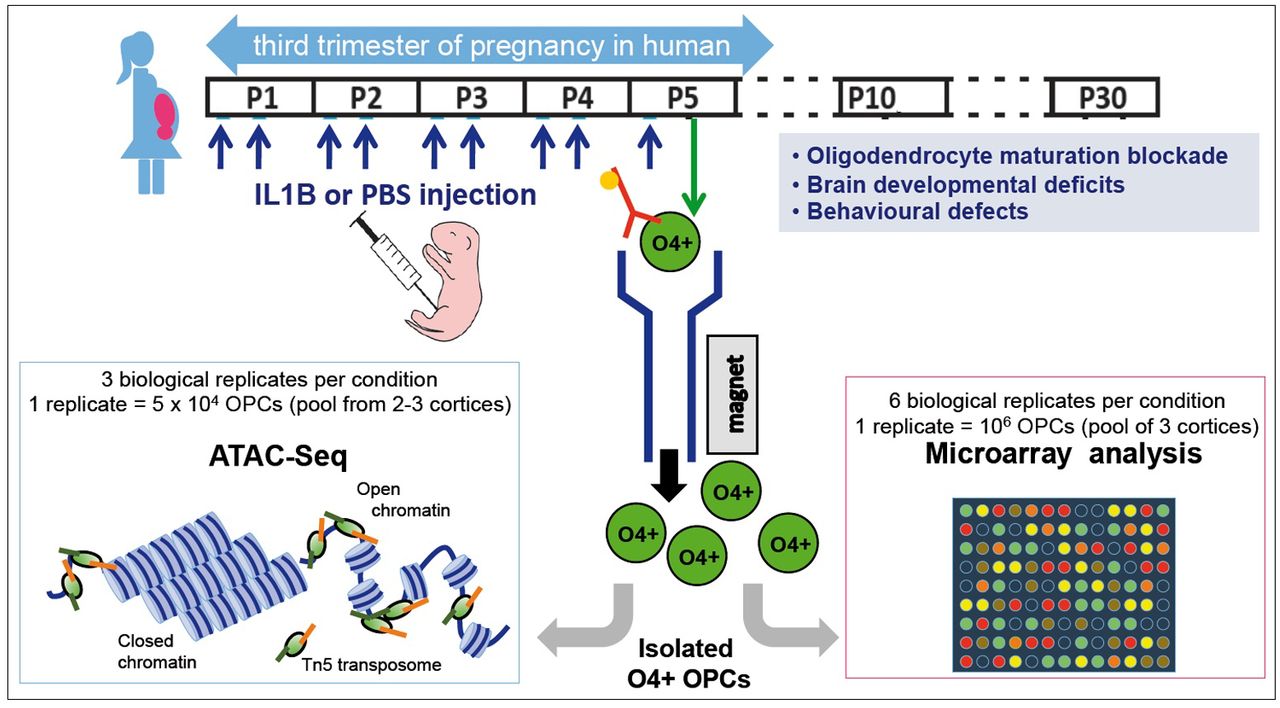
Previously validated mouse model of encephalopathy of prematurity in which we mimic the systemic and neuroinflammatory insults as undergone by human infants from approximately 23-32 weeks gestational age equivalent. Neuroinflammation is induced via i.p. IL1B from postnatal days 1 to 5, and this leads to OPC maturation blockade, defective myelination, and behavioral anomalies as seen clinically (8). O4+ OPCs (green circles) were isolated from P5 pup cortices by MACS and genome-wide chromatin accessibility was explored by ATAC-Seq (lower, left panel): the enzymatic severing of the DNA by the transposome (Tn5 transposase, loaded with adapters in vitro; green and orange) allows « tagmentation » of DNA template, to fragments tagged with adapters. In parallel (lower, right panel), comparative transcriptomic analysis was performed using Agilent mouse whole genome microarray.
The epigenome of OPCs is globally preserved in response to systemic IL1B exposure
We first investigated the impact of IL1B on the integrity of the chromatin landscape in OPCs using ATAC-Seq (12; Assay for Transposase-Accessible Chromatin with high-throughput sequencing; Fig. 1). This approach harnesses the ability of the Tn5 transposase to integrate a DNA fragment into open chromatin regions, allowing to sensitively and accurately map accessible regions. Using the bioinformatics workflow described in Fig. S1C (see Material and Methods) including the MACS2 and EdgeR software tools, we obtained an average of 72 million Tn5-integrated mapped reads per sample, representing a total of 213,246 statistically significant peaks (MACS2; FDR < 0.05; Table S1 and S2; Dataset S1). Analysis of the insert size distributions showed the expected nucleosome-induced pattern and the 10.4bp periodicity with good consistency across samples, an indication of high data quality (Fig. S1D).
The number of reads, which reflects chromatin accessibility, was determined for each sample in the 213,246 peaks. We performed principal component analysis (PCA) on our samples and observed that principal component 1 (PC1) accounted for 42% of the variance and separated samples from control and neuroinflammation-exposed OPCs (Fig. 2A). This shows that a large proportion of the variance in this dataset can be explained by the IL1B exposure. We obtained similar results using the EdgeR MDS function (Fig. S2A). Among the 213,246 significant peaks, only 524 peaks were open or closed in response to IL1B (FDR < 0.05, Fig. 2B; Fig. S2B; Table S3). The majority of peaks with differential chromatin accessibility was more open in IL1B, compared to PBS conditions (Fig. 2B, Fig. 2C). The extent of changes to chromatin accessibility was small, with fold-changes of most peaks only mildly deviating from sample-to-sample variability (Fig. 2B). The median fold-change of differentially open regions was only 2-fold (2.03).

(A) PCA analysis of log normalized read counts falling within ATAC-seq chromatin peaks from OPCs from control (PBS) or neuroinflammation-exposed (IL1B injections); total number of peaks, 213,246.
(B) Scatter plot representing the dispersion (fold change) of peaks in relation to the number of reads (logCPM), for each individual analyzed peak across 3 PBS samples and 3 IL1B samples. The 524 peaks showing significant differences between IL1B and PBS conditions are indicated in red, with 391 peaks corresponding to increased and 134 peaks to decreased chromatin accessibility, with FDR < 0.05.
(C) Heat map visualization of the 524 opening (yellow) or closing (blue) peaks in control (PBS) and neuroinflammation-exposed (IL1B injected) conditions.
(D) Examples of peaks showing increased chromatin accessibility: (Upper and middle panels) peak located at the most downstream position in the Hif3a gene (Hypoxia inducible factor 3 alpha subunit; magnification in the middle panel). Example of peak without significant changes in chromatin accessibility: (Upper panel) the peak located in the middle of the Hif3a gene illustrated region. Example of peak showing reduced chromatin accessibility: (Lower panel) peaks within the Cwc22 gene (encoding the spliceosome-associated protein 22).
We next annotated the 213,246 peaks using HOMER annotatePeaks function. Peaks were mostly distributed in intergenic and intronic regions and were enriched in gene regulatory regions and gene bodies (Fig. S2C). A similar distribution was observed for the 524 differential peaks (Fig. S2C). Representative peaks showing increased, reduced, or unchanged chromatin accessibility are illustrated in Fig. 2D and Fig. S2D. We assigned differential peaks to genes based on proximity to their transcription start site (TSS) and thus likely affected by chromatin alteration, and performed gene ontology (GO) analyses, using David6.8, for the 485 corresponding genes, of which 344 were assigned a GO-term. The top ten GO-terms ranked according to their FDR, belong to pathways relevant for neural development (regulation of cell migration, cell adhesion, and neuron projection development, but none of them showed FDR < 0.05; Fig. S2E; Table S4).
Our results thus reveal that only 0.25% of open chromatin regions show differential chromatin accessibility in P5 OPCs that are isolated from a model of inflammation-driven encephalopathy.
Impact of systemic IL1B exposure on the transcriptome of O4+ OPCs
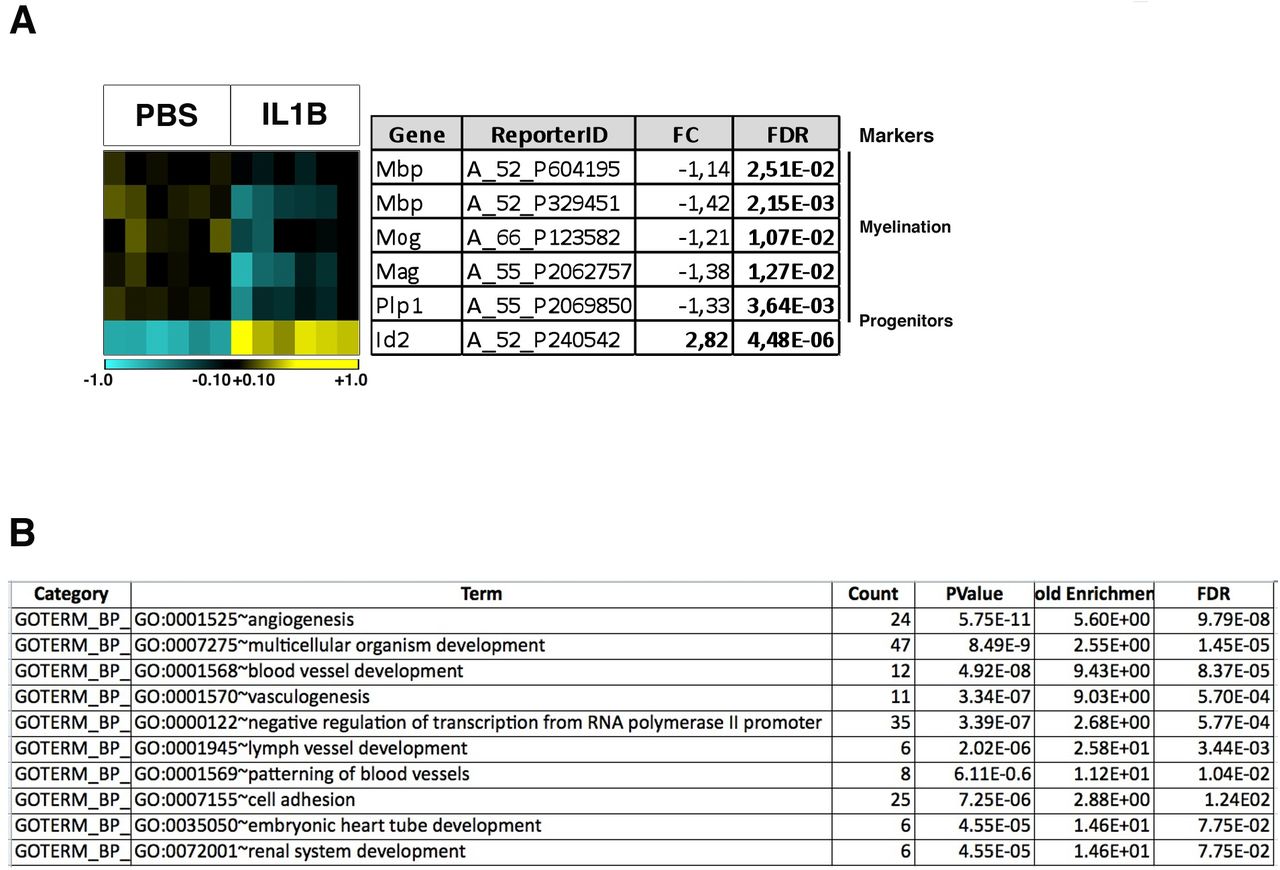
We analyzed gene expression in isolated O4+ OPCs using microarray analysis. We compared six independent samples of O4+ OPCs from IL1B-exposed mice to six independent samples from PBS (control) mice. IL1B-exposure mainly induced upregulation of gene expression: 1,266 genes were up-regulated and 454 downregulated, which corresponded to 1,872 and 699 probes, respectively (FC +/− 1.5; FDR < 0.05; Fig. 3A; Table S5). As expected based on previous work in this model (8) and from our validation experiments by RT-qPCR for O4+ OPC isolation (Fig. S1B), the analysis of our microarray data revealed that the expression of genes associated with myelination (Mbp, Mog, Mag, CNPase, Plp1; which are still lowly expressed at P5 in normal conditions) were downregulated by IL1B, whereas that of Id2 was upregulated (8; Fig. S3A). These results indicated that our samples and microarray analyses were representative of OPC maturation blockade (8). The GO analysis of these upregulated genes strikingly pinpointed the immune system and inflammatory response in the top 5 most statistically significant pathways (DAVID 6.8; Fig. 3B; Table S6). The analysis of downregulated genes indicated that these belonged to pathways linked to development, but with lower statistical relevance (Fig. S3B). Our microarray data highlighted that the significant alteration in the expression of the 262 genes, belonging to the immune system and inflammatory response pathways, mostly corresponded to upregulation (Fig. 3C). Using RT-qPCR on independent samples, we confirmed the induction of the expression of known players of these pathways: cytokines, chemokines, interleukins and their receptors (Fig. 3D).

Microarray analysis comparing gene expression in isolated O4+ OPCs from six independent control (PBS) and six independent neuroinflammation-exposed cortices (IL1B; Fig. 1).
(A) Heat map of genes with altered expression upon IL1B exposure. A fold-change (FC) threshold of +/−1.5 was chosen, with FDR < 0.05. Total number of probes corresponding to IL1B-induced disturbances in gene expression: 2571, corresponding to 1719 genes. Total number of probes corresponding to the 1266 upregulated genes: 1872. Total number of probes corresponding to the 454 downregulated genes: 699. Heatmap color scale: log2 [-2.0;+2.0].
(B) The top5 GO of up-regulated genes corresponds to the immune system and inflammatory response pathways. GO-terms as a table with p-values and FDR.
(C) Heat map of the genes belonging to the top5 GO-terms, 315 probes corresponding to 262 genes. Heatmap color scale: log2 [-2.0;+2.0].
(D) Validation of the alteration in gene expression for members of the GO-term “immune system and inflammatory response pathways” in O4+ OPCs using RT-qPCR. Number of independent experiments: n=8 for all genes, except for Cxcl9, Cxcl10, and Il1r1 (n=7).*, p < 0.05; **, p < 0.01; ***, p < 0.001. Grey bars ligands; black bars: receptors.
OPCs intrinsically activate genes of the immune and inflammatory pathways in response to IL1B
We excluded the possibility that the upregulation of immune and inflammatory genes was due to contamination of O4+ OPCs with microglia. In this model of neuroinflammation we have previously published microarray analyses of the transcriptomic profiles in microglia (CD11B+ MACS-isolated cells; 9). These CD11B+ cells were obtained from the same animals as the O4+ OPC populations that we have examined in this study; by sequentially MACS-based isolation of O4+ OPCs and CD11+ microglia cells from the same brains. We compared the microarray gene expression profiles in the previously assessed CD11B+ cells to the list of 262 genes found in OPCs and corresponding to inflammation and immune pathways (Fig. 4A; Fig. S4; dataset from 9). These two cell populations exhibited remarkable differences in gene expression profiles in response to neuroinflammation, both in the magnitude and direction of expression changes; Fig. 4A; Fig. S4). Notably, the upregulation of these genes in microglia was greatest at P1 and their expression at P5 has already recovered, reaching basal levels comparable to that of PBS samples, while in OPCs the basal expression has not (9; Fig. 4B). Those data were confirmed by RT-qPCR in independent O4+ OPC and CD11+ samples, and extended to astrocytes (GLAST+ MACS isolation). Specifically, neither CD11B+ microglia, nor GLAST+ astrocytes showed an increase in the expression of selected cytokines and chemokines at P5 (illustrated here for Ccl2, Cxcl1 and Cxcl10; Fig. 4B). Altogether, these results indicate that the upregulation of immune and inflammatory pathway in O4+ OPCs in response to IL1B in our microarray analyses at P5 cannot be attributed to contamination of OPCs by microglia, nor astrocytes.

(A) A heatmap comparing the microarray data of the 262 genes upregulated of the inflammatory pathway in isolated O4+ OPCs in response to neuroinflammation, with the same genes from isolated CD11+ microglial cells (9) at the same timepoint. These 262 genes are not dysregulated in a comparable way in these two cell types. Heatmap color scale of log2 [-2.0;+2.0].
(B) Unique signature for inflammatory gene expression in isolated O4+ OPCs, compared to CD11B+ microglia, and GLAST+ astrocytes. Fold-change in the expression of genes of the immune and inflammatory pathways as detected by RT-qPCR analyses at different postnatal stages. mRNA levels are normalized to Gapdh for OPCs and astrocytes and Rpl13 for microglia based on in-house reference gene testing. The numbers of independent experiments are indicated on each plot. *, p < 0.05; **, p < 0.01; ***, p < 0.001.
To verify the potential for production of inflammatory players by OPCs in response to inflammation, we isolated primary OPCs, grew them in vitro and treated these cultures with IL1B (Fig. 5A). We detected significant induction of the production of seven cytokine and chemokine proteins via Luminex in the supernatant of IL1B-treated MACS-isolated primary O4+ OPCs, cultured for 24 or 72 hours (Fig. 5B). We also confirmed the upregulation of these inflammatory and immune mediators at mRNA levels (Fig. S5A). In conclusion, these data strongly support the hypothesis that, at P5, O4+ OPCs are able to intrinsically synthesize inflammatory and immune pathway proteins in response to exposure to inflammatory stimuli.

(A) Experimental design for ex vivo OPC culture, inflammatory exposure (IL1B), and differentiation (see Material and Methods).
(B) Detection and quantification (pG/mL) of the expression of interleukins (IL1B, IL6), cytokine C-C Motif Chemokine Ligand 2, 4, and 5 proteins (CCL2, CCL3, CCL4, and CCL5) and chemokine C-X-C Motif Chemokine Ligand 2 (CXCL2) proteins by Luminex. CTR, PBS exposure; IL1B, IL1B exposure. The dotted line represents the limit of detection for individual proteins in the assay. The numbers of independent experiments performed for each plot are indicated on each plot. *, p < 0.05; **, p < 0.01; ***, p< 0.001.
Linking chromatin and transcriptional disturbances in response to IL1B exposure
To examine the contribution of modifications of chromatin accessibility to the changes in the transcriptome, we intersected our ATAC-Seq data (213,246 peaks, corresponding to 20,108 gene names) and our microarray data (limited to genes with annotated ID; 25,294). We found 16,883 genes in common between the two datasets, of which 1,333 genes showed altered expression after IL1B exposure and 404 peaks showed differential chromatin accessibility. By performing the intersection of the 1,333 differential genes with genes nearby the differential 404 ATAC-Seq peaks, we identified 53 genes representing a statistically significant overlap between transcriptomic and epigenomic changes. (Fig. 6A; p= 1.7 e−4; Table S7).

(A) Number of genes differentially expressed and associated with all differentially accessible peaks/regions in O4+ OPCs isolated from neuroinflammation-exposed pups.
(B) Number of genes differentially expressed and associated with differentially accessible peaks/regions only located +/− 8 kb around their TSS in O4+ OPCs isolated from neuroinflammation-exposed pups.
(C) Heat map illustrating the co-localization of pairs of TF binding motifs in the 2319 ATAC-Seq peaks located within +/− 8 kb from the TSS 1266 upregulated genes (corresponding to 886 different gene names), identified using paired motif analysis. TF names from MEME nomenclature on both axes. Statistically relevant co-occurrence of two different TFs is indicated by yellow to orange squares (multiple testing corrected log10 p-value). Examples of TF pairs are indicated IRF1-p50; ISRE-p65; PU.1-IRF8-p65; PU.1-iRF8-p50; PU.1-BATF; PU.1-FOSL2. Color code (TF names and arrows): red, pairing of PU.1-IRF8 with NFκB subunit binding motifs; purple, pairing of PU.1 with AP-1 family binding motifs; blue, pairing of NFκB binding motifs with Isre (IFN-stimulated response element); green, pairing of NFκB with IRF binding motifs.
(D) Examples of chromatin accessibility footprints at TF motifs: average footprint profiles at TF motifs were plotted at base pair resolution, located within accessible chromatin loci in both PBS and IL1B conditions, adjacent to differentially regulated genes (ALL; down and upregulated) using the Wellington software (14). Typical footprint profiles coincide with the center of the canonical motif for a given TF (indicated by brackets). Footprints for occupancy of IRF1, IRF2, Isre, and NFκB binding motifs are illustrated. Footprints showing occupancy by IRF1, IRF2, Isre, and NFκB on corresponding binding motifs are illustrated. Red and blue curves: + and - strand, respectively.
In order to maximize the chance of attributing peaks to relevant genes, we reasoned that peaks corresponding to opening or closing of the chromatin and lying within +/− 8kb around a TSS were most likely to contribute to the regulation of the expression of the corresponding gene. Taking this into account, we identified 15 genes showing differential expression and exhibiting modifications of the chromatin landscape in their vicinity, which corresponded to 20 % of the ATAC-Seq peaks present in +/− 8 kb around the TSS (Fig. 6B; p= 8.74 e−5; Table S8). Among these 15 genes, 10 corresponded to genes involved in the immune system and inflammatory response pathways: Cd14, Cwc22 (Fig. 2D), Hmha1, Ifit3, March1, Nckap1l, Slfn2, Slc15a3, Tlr1, Tnfsf14, Tnfrsf12a (Table S8). Interestingly, Hif3a, a gene recently identified in models of inflammation, was also included in this list (see discussion; Fig. 2D).
In summary, the immune system and inflammatory response pathways were prominently represented in the lists of genes showing marked dysregulation of their expression upon IL1B treatment, and associated to two different chromatin behaviors: 1) a limited number of genes shows differential chromatin accessibility upon IL1B exposure (Fig. 6A and B); 2) the majority of the genes annotated in the top 5 most enriched GO-terms displays no major changes in chromatin accessibility (Fig. 3B). Indeed, in this case, the chromatin was already in an open conformation in the PBS samples (examples shown in Fig. S2D).
Identification of combinatorial transcription factor binding in immune system and inflammatory pathways
In the large majority of instances where neuroinflammation altered gene expression, we observed that the chromatin was already open and remained unchanged. As such, we investigated the putative involvement of transcriptional regulators as primary mediators of alteration in gene expression. We searched for enrichment in transcription factor (TF) binding sites (TFBS) using HOMER and known motifs in the ATAC-Seq peaks adjacent to differentially regulated genes (up and downregulated genes, termed “ALL”). We chose to focus on ATAC-Seq peaks within a distance of +/− 8 kb relative to the TSS of these genes. Members of the IRF (interferon-regulatory factor) family appeared at the top of the list with the strongest scoring results. This is also true for the composite site PU.1-IRF8, and NFκB family members (Fig. S5B). A list of similar motifs was found with comparable scoring results, as well as p-values, in the peaks adjacent to upregulated genes (termed “UP”; Fig. S5C).
Because we suspected that these TFs might work together (13), we investigated the occurrence of paired motifs in the peaks located in +/− 8kb regions around the TSS of differentially regulated genes, as described in Materials and Methods. The analysis of peaks corresponding to downregulated genes did not reveal any paired motif enrichment, compared to random occurrence in all peaks. In contrast, the analyses of ATAC-Seq peaks associated with upregulated genes revealed the existence of paired TFBS motifs, with marked involvement of TFBS from the IRF family, PU.1/SPI1, Isre (Interferon-Stimulated Response Element), NFκB, and AP-1 family (Fig. 6C; Table S9).
To investigate whether the occurrence of these motifs corresponded to the binding of TFs, we tested the motif occupancy on DNA in PBS and IL1B conditions. For this, we used the Wellington algorithm (14), which is highly accurate in inferring protein (TF)-DNA interactions. We investigated the presence of footprints corresponding to occupied TFBS and their motif content, located within significant ATAC-Seq peaks, adjacent to differentially regulated genes. The average footprint profiles, produced for the top 6 results in the list of known HOMER motifs (Fig S5B,C) are illustrated, for IRF1, IRF2, IRSE and NFκB in Fig. 6D (using data from both conditions, PBS plus IL1B) and in Fig. S6A (PBS, upper panels; IL1B, lower panels). The dip in the number of reads at the center of the sharp average profile (indicated by brackets) was strongly suggestive of effective TF binding. A similar analysis is illustrated for IRF1, IRF2, IRSE, and NFκB (Fig. S6A). In contrast, PU.1-IRF8 and PGR (Progesterone Receptor) average footprint exhibited sharp internal spikes, suggestive of transposase insertion bias (15, Fig. S6B). Interestingly, there was little difference in the average footprint profiles for all these TFs, when considering either PBS samples only or IL1B samples only, indicating that these TFs might already bind DNA at the corresponding motifs in PBS conditions (Fig. S6A).
Altogether, these results indicate that key TFs involved in the immunity and inflammatory processes are bound in a significant number of open regions located in the vicinity of genes that are differentially upregulated by IL1B. The binding of such TFs is coherent with the prominent upregulation of proinflammatory cytokine and chemokine genes, and other genes of the immune system and inflammatory pathways. In addition, because footprint profiles were similar in PBS and IL1B conditions, our data suggest that, at P5, these TFs might be positioned in these regions before exposure to IL1B.
There was no evidence for footprints in peaks adjacent to downregulated genes (data not shown). And the search for de novo motifs in ATAC-Seq peaks near differentially expressed genes did not reveal statistically relevant motif associated with bona fide average footprints (data not shown).
Constitutive expression of genes of the immune and inflammatory pathways at early stages of OPC maturation trajectory, in unstressed conditions
At this step of the study, we had shown that P5 isolated O4+ OPCs were able to induce the expression of genes belonging to the immune system and inflammatory response pathways, in response to neuroinflammatory challenge. We had also shown that these major alterations in gene expression occurred without major modifications in chromatin accessibility, but that key TFs controlling these pathways were bound to these open regions both in the control (PBS) and neuroinflammatory (IL1B) conditions. These observations suggest that the epigenomic profiles associated with IL1B-induced genes exhibit neuroinflammatory-like patterns prior to IL1B exposure (i.e. open chromatin conformation). Furthermore, transcription of these genes may already be activated at a physiological level in OPCs during normal development and further upregulated by exposure to neuroinflammation.
To assess this hypothesis of the transcription of immune and inflammatory genes in normal OPC maturation trajectory, we MACS-isolated O4+ OPCs at P3, P5, and P10 from our model of preterm neuroinflammatory injury. Indeed, our investigations detected presence of cytokine and chemokine mRNA in O4+ OPCs in control conditions. These mRNA levels were greatest at P3 and decreased in a stage-dependent and significant manner, between P3 and P10 (Fig. 7A and Fig. S7A). In addition, we verified that our control condition (i.p. PBS) did not constitute a stress, per se, that would induce the expression of cytokine and chemokine genes in the absence of IL1B administration. By comparing MACS-isolated O4+ OPCs from naïve (untreated) and PBS-treated pups at P5 we observed similar levels of cytokine and chemokine gene expression, in RT-qPCR experiments (Fig. S7B). This shows that PBS injection is not responsible for constitutive cytokine and chemokine mRNA levels at P5. In contrast, IL1B-treated OPCs exhibited elevated levels of cytokine and chemokine mRNAs compared to naïve or PBS OPC samples, as expected (Fig. S7B). Moreover, we confirmed that the constitutive expression of cytokines and chemokines also occurred in normal conditions in the murine oligodendrial cell line, Oli-neu (Fig. 7B). We showed that this constitutive expression decreased during Oli-neu differentiation, as was observed during the O4+ OPCs maturation trajectory (Fig. 7B and Fig. S7C). These data demonstrated that O4+ OPCs can intrinsically transcribe cytokine and chemokine genes at an early OPC stage (P3), and that the expression of these genes is gradually downregulated during their maturation process between P3 and P10, in a physiological and developmental manner. This constitutive transcription is in line with the small scale and extent of the open chromatin changes of these genes that we observe at P5 (Fig. S2D).
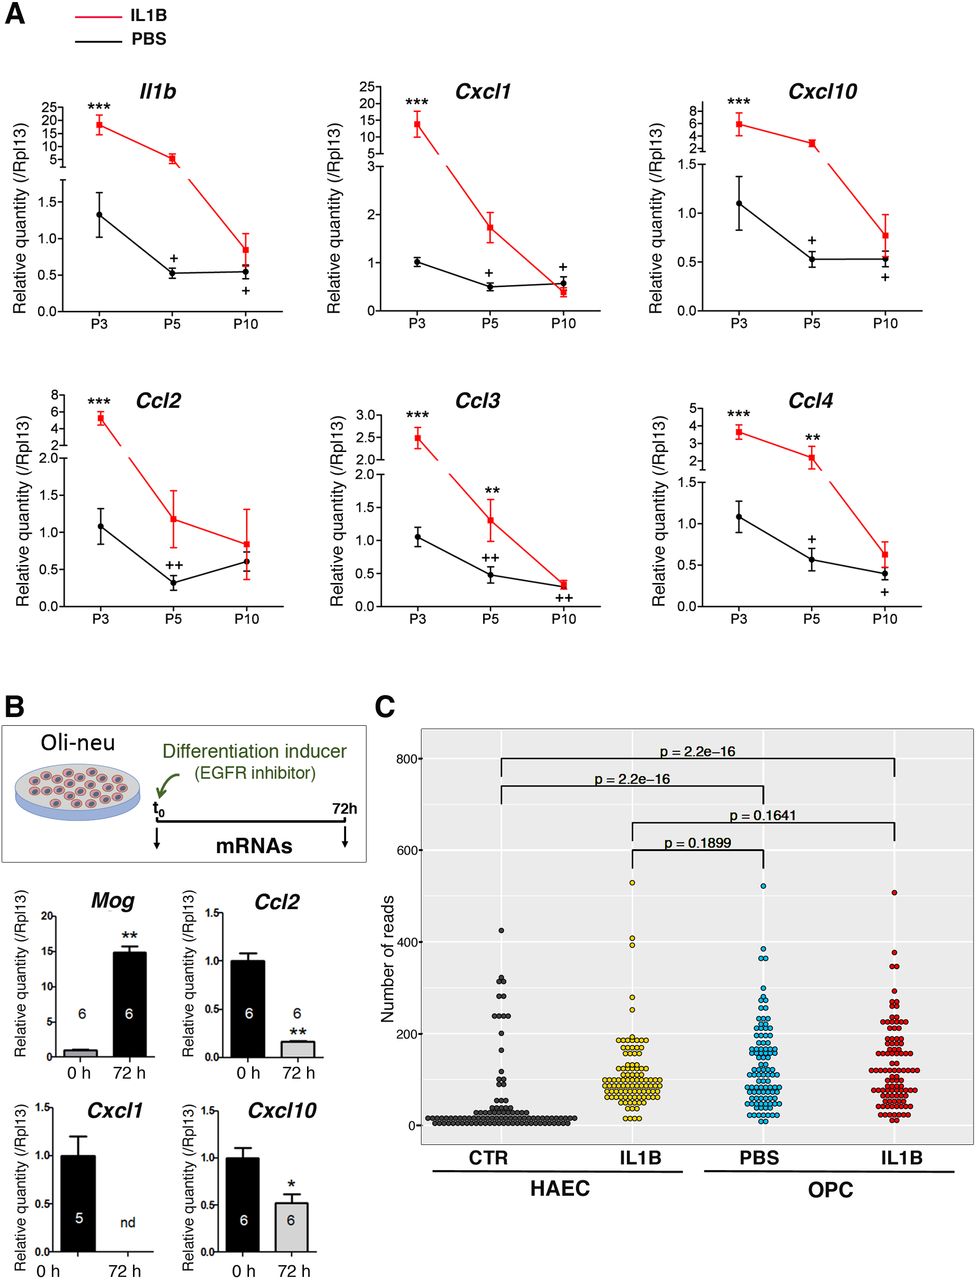
(A) RT-qPCR analyses in P3, P5, and P10 O4+ OPCs. N= 5 to 6 independent experiments. Two-way ANOVA followed by Bonferroni - Post Hoc Test was performed: * and +, p < 0.05; ** and, ++ p < 0.01; ***, p < 0.001. *, **, or ***, correspond to comparison between PBS and IL1 conditions for a given postnatal stage; + (or ++), correspond to comparison between P5 (or P10) to P3.
(B) RT-qPCR analyses in the Oli-neu cell line before or after 72 hours of differentiation triggered by PD174265, a potent, cell-permeable inhibitor of the tyrosine kinase activity of the epidermal growth factor receptor (EGFR). This in vitro paradigm shows the same pattern of higher inflammatory mediator expression in immature oligodendrocytes, which decreases with maturation to myelin producing oligodendrocytes. Numbers of independent experiments are indicated on the graph bars. *, p < 0.05; **, p < 0.01. nd: not detected.
(C) Cross-species comparison reveals presence of an inflammation-like signature in the chromatin landscape of both control and IL1B treated O4+ OPC samples. Read number distribution of peaks upon IL1B treatment in the HAEC (public) and OPC datasets. Reads were normalized for each set of peaks against the total number of reads present in all (7,739) matched peaks and converted into reads per million. Distributions were compared using a one-sample Wilcoxon rank test.
To further confirm our findings, we formulated and performed an additional analysis, taking advantage of an existing public ATAC-seq dataset from a similar control versus treatment study, which used IL1B stimulus on human adult aortic endothelial cells (HAECs) isolated from aortic trimmings of donor hearts (16; “HAEC dataset”; NCBI Gene Expression Omnibus; accession no: GSE89970). Through a cross-species comparison, our aim was to explore global chromatin landscape similarities (or lack thereof) between both control and IL1B-treated, HAEC and O4+ OPC, samples. First, both datasets were limited to chromatin regions annotated with matching 1-to-1 gene orthologs and located within ±2 kb of a TSS as described in Material and Methods. In total we were able to match 7,739 peaks, between the two datasets, including 100 regions, which were found to be differential between the control and IL1B conditions, in the HAEC dataset. Subsequent cross-comparison of these regions reported no significant difference between both O4+ OPC samples and the HAEC IL1B-treated sample. In contrast, both O4+ OPC samples showed significant differences (p-value < 10−15) to the HAEC control sample (Fig. 7C; Fig. S7D; Table S10). These findings reveal a characteristic IL1B pattern in the chromatin profiles of OPCs isolated from both inflammation-exposed and control mice, which is indicative of an inflammation-like signature that is already present at basal level in developing OPCs. The results thereby reinforce our findings about cytokine and chemokine gene expression in unstressed and stressed O4+ OPCs.
DISCUSSION
Overall, our results indicate that the remarkable capacities of premyelinating O4+ OPCs to produce immunomodulators constitute one route of entry for the impact of neuroinflammation on OPC maturation. Indeed, the developmental control of their synthesis is highjacked by neuroinflammation and this process occurs with limited effects on chromatin accessibility. Rather, we observe that neuroinflammation mainly takes advantage of the presence of open chromatin regions corresponding to active transcriptional programs, of which the constitutive expression of genes of the immune and inflammatory pathways, in normal conditions, is the most prominent target for neuroinflammation-induced disturbances.
The impact of neuroinflammation can thus be interpreted in the following way: by markedly increasing the levels of cytokine and chemokine gene expression at P3 and P5, neuroinflammation produces a delay in the normal downregulation of these genes at P5, and, therefore, maintains abnormally elevated levels of these players at this stage. This suggests that one major mechanism for neuroinflammation-induced OPC maturation blockade operates by interfering with the normal stage-dependent expression and downregulation of players of the inflammation pathway, along the OPC maturation trajectory.
Our data also nurture an underlying and emerging concept: molecules that have been historically identified and studied as key mediators of stress responses and guardians of cell or organism homeostasis are also pivotal in physiological conditions for normal development. Emblematic examples are represented by TF families, like NFkB (17) and HSF (Heat Shock Factors) and their target genes encoding the heat shock proteins (HSPs; 18; 19; 20). Whether these two apparently distinct functions might have emerged concomitantly in evolution or not is unclear, but for technical and practical reasons, the roles of these molecules in normal development have been understudied. The production of inflammatory players by prenatal OPCs and its role in brain formation is therefore less unexpected than it appears.
Accordingly, it has been extensively reported in the literature that OPCs and mature oligodendrocytes of the adult brain can express key players of immune and inflammatory pathways in pathological conditions. This includes studies of patients affected by multiple sclerosis (MS) or in in vivo models of experimental autoimmune encephalomyelitis (EAE; reviewed in 21). Here, we show that P5 O4+ OPCs express genes and proteins associated with inflammatory pathways in normal conditions. As such, OPCs during normal development thus display properties similar to that ascribed to adult OPCs and mature oligodendrocytes, which can shape the inflammatory environment, or in the perspective brought by the new concept mentioned above, that they perform a trophic role on their environment at defined time-windows. Our results are also in line with previous results showing that OPCs, derived in vitro from neurospheres, can activate cytokine genes in an EAE model (23). In a more original manner, we also unravel the physiological, constitutive expression of cytokine and chemokine genes in normal O4+OPCs at an early postnatal stage. In line with our findings, Zeis et al. (21), revisited published microarray data sets (23) and pointed out the expression of genes belonging to the GO:term “immune system process”, in PDGFRa+ unstressed OPCs, which reinforces our data.
Only a limited number of genes belonging to the immune system and inflammatory pathways, and whose expression is dysregulated by exposure to neuroinflammation undergo significant chromatin remodeling. Hypoxia-Inducible Factor 3, Hif3a, is one of them and was shown to be regulated, in an oxygen-independent manner, in two distinct models of inflammation, in non-neural cells (24,25). Interestingly, in parallel of our data, Cuomo et al. (25) established that proinflammatory cytokines are responsible for the activation of the Hif3a gene, through epigenetic changes and the involvement of NFκB. Nevertheless, another possibility is that the bulk of genes of the immune and inflammatory pathways, which show no major alteration in chromatin confirmation, could exhibit minor, but crucial differences in nucleosomal positioning that would correlate with major increase in transcription (positioning of the first nucleosome and phasing of the following ones). Such subtle modifications, but no major changes in chromatin accessibility, have been strikingly identified during ES cell differentiation along diverse cell lineages (for example, 26). Future studies will determine whether the restricted impact of neuroinflammation on chromatin accessibility in the premyelinating OPC reflects an intrinsic robustness of the epigenome. Alternatively, the epigenome might have been perturbed at earlier stages and have already recovered at P5. In both cases, the molecular bases underlying this robustness or recovery capacities remain to be explored.
Another question is the functional impact of the opening or closing of the chromatin in response to neuroinflammation, in regions that we have identified by ATAC-Seq. As already mentioned, most of them do not correlate with major transcriptional changes. This raises three interpretations. Firstly, the transcriptomic impacts of these epigenomic modifications might be “buffered”/minimized, thanks to the binding of different sets of TFs, which would deserve further investigations. Secondly, TFs, which are multifaceted drivers, remodel the chromatin state and genome topology, often before changes in gene expression can be observed, as was demonstrated in studies on the molecular basis of cell fate (27). These modifications of the chromatin landscape could thus constitute an Achilles’ heel for transcriptomic disturbances, that would occur either at later maturation stages, at temporal distance from the insult, or upon a second hit of neuroinflammation. The occurrence of additional inflammatory insults is relevant because, besides exposure to prenatal inflammatory insults - which is mimicked by our model -, preterm babies also face a heavy burden in terms of postnatal inflammatory insults, representing additional neuroinflammatory hits (28). Thirdly, one other exciting possibility is that, in the genome, these TFs involved in immune and inflammatory pathways might also work at long-distance from their dysregulated target genes, which would involve remodeling at multiple architectural levels (chromatin looping, TADs (tolopogically associated domains) connectivity etc.).
Besides these considerations, the entry route for neuroinflammation is represented by the constitutive and stage-dependent synthesis of cytokines and chemokines by premyelinating OPCs in normal conditions, which empowers neuroinflammation to impact OPC maturation. This entry route can thus be envisioned as recapitulating and intermingling both injurious and developmental aspects, as already expected from the field (29). Indeed, by counteracting the tightly regulated physiological expression of cytokines and chemokines by O4+ OPCs at P3, that is programmed to gradually decrease in a developmental, stage-dependent manner (here shown between P3 and P10), the neuroinflammatory insult might compromise the premyelinating OPC cell fate. In line with our results, Moyon et al. (30) pointed out the role of IL1B and CCL2 production by premyelinating OPCs in modulating their motility capacities and eventually differentiation (see also 25). In addition, this production could regulate the recruitment by OPCs of other cells (like microglia; 32,33) that are known to influence OPC maturation. Notably, as it is the case for other pathways historically identified as stress-responsive, like the HSF pathway, which is also involved in unstressed conditions during physiological brain development, the order of magnitude of the up- or downregulation of target gene expression (here chemokines and cytokines) is lower during development than it is in response to stress exposure (Fig. 7A).
In conclusion, in the context of a chronic perinatal systemic inflammation, the epigenome seems globally preserved in premyelinating OPCs, in terms of chromatin accessibility, and the contribution to OPC blockade is mostly driven by transcriptomic disturbances. These transcriptomic perturbations concern transcriptional programs that are already open at the time of exposure, and most prominently the immune system and inflammatory pathways. Our results have important therapeutic consequences: because of the striking intertwining between the injurious and developmental facets of these inflammatory mediators, we should reconsider that global targeting of this pathway might constitute a therapeutic option. One conclusion emerging from our study is that the TFs involved in response to neuroinflammation in OPCs seem to be already at play in normal OPCs to control the developmental transcription of these genes. In addition, they work in combination as suggested by their pairing profiles. Our work thus paves the way of future studies that would allow the design of a therapeutic strategy, based on subtle manipulation of the activity of TFs, using appropriate cocktails of low-dose modulators.
MATERIALS AND METHODS
Animal Model
Experimental protocols were approved by the institutional review committee and met the guidelines for the United States Public Health Service’s Policy on Humane Care and Use of Laboratory Animals (NIH, Bethesda, MD, USA). Sex was determined at birth, and confirmed by abdominal examination at sacrifice. This animal model is similar to the human in that males are more affected and, as such, only male OF1 pups were used, as female OPCs maturation is not altered (8). IL1B injections were performed as described (8,9). Five µL volume of phosphate-buffered saline (PBS) containing 10µG/kG/injection of recombinant mouse IL1B (R&D Systems, Minneapolis, MN) or of PBS alone (control) was injected intraperitoneally (i.p.) twice a day on days P1 to P4 and once a day on day P5 (see Fig. 1). Pups were sacrificed four hours after the morning injection of IL1B at P3 or P5, and at a similar time at P9, or P10. ATAC-Seq data were produced from 3 independent biological replicates for each condition (PBS or IL1B; Fig. 1). Microarray data were produced from 6 independent biological replicates for each condition (PBS or IL1B; Fig. 1), using the same animals that were also analysed for CD11B+ microarrays (9).
O4+ magnetic and microglial activated cell sorting in mouse
O4+ cells were isolated at P3, P5, P9, or P10 by Magnetic Activated Cell Sorting (MACS, Miltenyi Biotec, Bergisch Gladbach, Germany), according to the manufacturer’s protocol and as previously described (34). Briefly, brains were collected without cerebellum and olfactory bulbs, pooled (3 brains per sample) and dissociated using the Neural Tissue Dissociation Kit containing papain. O4 + cells were then enriched by MACS, using the anti-O4 MicroBeads. For microarray and RT-qPCR analysis, the eluted isolated cells were centrifuged for 5 min at 600g and conserved at - 80°C. CD11+ microglial cells were isolated as described (9). The unlabeled fraction mainly contained astrocytes (see Fig. S1A). For the ATAC-seq experiment, 50,000 cells were immediately lysed and their nuclei submitted to Tn5 activity. The purity of the eluted O4-positive fraction was verified using qRT-PCR for Myelin Basic Protein (Mbp), ionizing calcium binding adapter protein (Iba1), glial fibrillary acid protein (Gfap) and neuronal nuclear antigen mRNAs (NeuN; Fig. S1A).
OPC culture and differentiation
OPCs were prepared from newborn OF1 mice as described (35,36). In brief, forebrain cortices were removed from postnatal day 0–2 mouse pups and freed from meninges. Minced tissues were enzymatically digested with 0.125% trypsin (Sigma) and 0,0025% DNase I (Sigma) for 15 min at 37°C and then mechanically dissociated. Cells were filtered through a 100-μm-pore-size cell strainer (BD), centrifuged 10 min at 1800 rpm, resuspended in minimum essential Eagle’s medium (Sigma) supplemented with 10% FBS (Gibco), 1% Glutamax (Gibco), 1% penicillin-streptomycin (P/S) solution (Sigma), and 0.5% glucose and plated in T75 flasks at a density of 2 × 10⁵/cm2. Mixed glial cell cultures were grown until confluence for 9-11 days (medium was replaced every 48-72h) and shaken for 1.5 h at 260 rpm to detach microglia. These detached microglia were then collected and removed together with the media. Remaining cells were shaken for additional 18h to detach the OPCs from the astrocyte base layer, and were simultaneously treated with 100 µg/ml liposomal clodrosome suspension (Clodrosome®, Encapsula Nanosciences, Brentwood, USA) which selectively eliminates any residual microglia. The detached OPC cell suspension was filtered through a 20-µM-pore-size filter (Millipore) and incubated in an untreated Petri dish for 10 min at 37°C to allow attachment of any remaining microglia. Purified OPCs were then seeded onto poly-D-lysine-coated 12-multiwell plates at a density of 3 × 10⁴/cm2 in OPC proliferation medium composed of Neurobasal medium (Gibco), 2% B21 (Miltenyi biotec), 1% P/S (Sigma) and 1% Glutamax (Gibco), supplemented with growth factors consisting in 10nG/mL FGFα(Sigma) and 10nG/mL PDGFα(Sigma). After 72h, OPC differentiation was initiated by growth factor withdrawal and addition of 40 nG/mL of T3 (Sigma). At the same time, OPCs were treated with 50nG/mL IL1B (R&D Systems, Minneapolis, MN) or PBS for 4h, treatment was removed, new media provided and cells were grown in differentiation medium until 72h (Fig. 5A).
Oli-neu cell line culture and differentiation
The immortalized murine OPC cell line, Oli-neu, was kindly provided by Dr Sheila Harroch (Pasteur Institute, Paris, France). Oli-neu was established from OPC-enriched murine primary cultures from E16 brains transformed with a provirus containing the oncogene T-Neu (37). Various differentiation protocols have been established, among which treatment with PD174265, a selective inhibitor of the activity of Epidermal Growth Factor receptor (ErbB) tyrosine kinase, has been shown to induce MBP expression (38). These cells were cultured in Dulbecco’s modified Eagle’s minimum essential medium (DMEM) containing Glutamax 1X and high glucose (4.5 G/L) (Gibco 31966), supplemented with 1 mG/mL insulin (Sigma), N2 supplement (Gibco), 100 μG/mL T4 and T3 (Sigma), 1% horse serum (Gibco), and 1% P/S (Sigma). At confluence, the cells were mechanically detached and seeded in 12-multiwell plates at a density of 15,000 cells/cm². After 24h, differentiation was induced by addition of 1µM PD174265 (ChemCruz) diluted in DMSO at 1 mM. Medium was replaced after 48h and differentiation was stopped after 72h. Another differentiation protocol using one third of conditioned medium from primary neuronal culture was also used (39; Fig. S7C).
RT-qPCR analysis and Luminex assay
Preparation of samples for quantitative reverse-transcriptase polymerase-chain reaction (qRT-PCR), primer design PCR protocol and luminex assay were similar to that previously described (39). Primer sequences are given in Table S11. Gapdh (glyceraldehyde-3-phosphate dehydrogenase gene) and Rpl13 (Ribosomal Protein L13) were chosen to standardize the quantitative experiments based on reference gene suitability testing.
ATAC-Seq analysis in O4+ OPCs
ATAC-seq protocol was performed as described (12) with slight modifications. In brief, cells were immediately lysed after cell sorting and a total of 50,000 nuclei were subjected to Tn5-mediated transposition for 30 min, resulting in ‘tagmented’ DNA fragments. Tagmented DNA was purified on MinElute colums (Qiagen) and amplified/tagged in two steps using NEBnext High-Fidelity 2x PCR master mix (New England Biolabs). Amplified DNA was purified twice with 1.8 volumes of NucleoMag NGS Clean-up and Size Select beads (Macherey Nagel). DNA was quantified using the Qubit dsDNA HS Assay Kit and the quality of each library determined on Agilent 2100 Bioanalyzer DNA High Sensitivity ChIPs. Libraries demonstrating appropriate nucleosomal profiles were multiplexed and subjected to Illumina NextSeq500 sequencing (IGenSeq Platform, ICM, Paris, France). Fastq files are available in Dataset S1. The main steps of sequence analyses are summarized in Fig. S1C. After quality controls (Fastqc and Trimmomatic 0.33), reads were aligned on the mm10 genome with Bowtie 2 (Galaxy tool version 2.3.4.1 (41; default parameters) (Table S1; Fig. S1C). Peak calling was performed with MACS2.2.0; default parameters; q<0.05) separately for the two conditions, using a pooled (n=3) bam file of control samples and a pooled (n=3) bam file of IL1B samples. The two resulting bed files were merged and, after removing the mm10 blacklist (http://mitra.stanford.edu/kundaje/akundaje/release/blacklists/mm10-mouse/mm10.blacklist.bed.gz), 213,246 DNA regions (peaks) significantly detected in at least one condition were delimitated (Table S2). The number of reads was determined in each peak for each sample using Bedtools coverage (version 2.19.1) and normalized to the library sizes. Principal component analysis was performed on log transformed read count values of the top 500 most variable peaks, using the prcomp function in R. Differential peak detection between the three PBS and the three IL1B samples was performed with the Bioconductor software package EdgeR (3.22.3; 40) using R studio (0.98.1103; http://www.rstudio.com). Statistical comparison was performed using the exact test function followed by False Discovery Rate (FDR) determination by the Benjamini-Hochberg method.
Linking of HAEC and OPC ATAC-Seq datasets
We used a public ATAC-Seq dataset of human aortic endothelial cells (HAECs; 16; NCBI Gene Expression Omnibus; accession no: GSE89970) and processed the raw reads (using the hg19 reference genome) to obtain a set of peaks. Both sets of peaks (control and IL1B-treated samples) were annotated using HOMER’s annotatePeaks function. Next, HAEC peaks were matched to mouse OPC peaks through gene annotations, by taking only those peaks annotated with matching orthologous genes (only 1-to-1 orthology was considered). Matching was further restricted to promoter regions (peaks with a relative maximum distance of 2kb from the TSS). In order to ensure that peaks were true matches, this set was further restricted to a relative distance of 500 bp from each other in relation to the TSS. Using this approach, a total of 7,739 peaks were matched between the HAEC and OPC datasets, including 100 peaks identified as differential in the HAEC dataset using DESeq2. Next, the number of reads mapped to matched peaks were obtained by counting the number of reads at the summit ± 50bp using the featureCounts package of the Subread software (v1.6.0) and the counts were normalized against the total number of reads present in all matched peaks and converted into reads per million. Normalized read number distributions of the two datasets were compared using the one-sample Wilcoxon rank test with continuity correction.
Microarrays of mouse O4+ OPC gene expression and data preprocessing
Microarray analysis was performed on six control and six IL1B samples (O4+ cells isolated at P5 after in vivo PBS or IL1B treatment) using Agilent Whole Mouse Genome Oligo Microarrays 8×60K (Agilent). Raw data are available in Dataset S2. All the steps, from RNA extraction to statistical analysis, were performed by Miltenyi Biotec, as previously described (34). In brief, intensity data were subjected to quantile normalization, unpaired t-tests (equal variance) were conducted to compare intensities between the two groups for each probe and p-values were adjusted through FDR determination by the Benjamini-Hochberg method. Fold changes correspond to the median ratios (median[IL1B]/median[PBS]). When FC<1, the FC was expressed as a negative value using the formula FC(neg)=-1/FC. For example, if FC=0.5, the indicated FC is −2. Probes with FDR <0.05 were considered significant. An additional fold change (FC) threshold was chosen at +/− 1.5 (corresponding to FC>1.5 and <0.666).
Heat map representation
Heat maps were created using Morpheus (https://software.broadinstitute.org/morpheus). The Log2 median-centered data were visualized using a fixed (nonrelative) color pattern. The color scales are indicated on each heatmap. Rows and columns were submitted to hierarchical clustering with the following criteria: metric = one minus Pearson correlation, linkage method = average.
TFBS motif enrichment analysis, and TF footprint analysis
The 213,246 significant peaks detected by MACS2 in at least one condition (PBS or IL1B) were annotated with the HOMER annotatePeaks function. The list was restricted to the peaks located between −8000 and +8000 bp from the closest TSS (“TSS-All” list). Among this list, peaks were selected, which were annotated with a gene name and for which the gene expression was modulated in the microarray analysis (FDR<0.05 and FC>1.5 or <-1.5). The full list of peaks and lists restricted to up or down-regulated genes were submitted to motif enrichment analysis using HOMER FindMotifsGenome with the options “-size given” and “-mask”. The “TSS-All” list was used as background. Six motifs corresponding to the top 5 motifs enriched in the full list of peaks (ISRE, IRF1, IRF2, Nfkb-p65 and PGR, Figure S5B) and the 15th motif enriched in the list restricted to up-regulated genes (PU1:IRF8, Figure S5B) were localized in the full list of peaks (UP+DOWN) with HOMER FindMotifs. For each of these motifs, the average profile of Tn5 activity was visualized using pyDNAse dnase_average_profile.py (14). This profiling was performed using a pooled bam file of PBS samples, or a pooled bam file of IL1B samples separately, and a pooled bam file of the two conditions (“both”) together.
Testing for enrichment of paired motifs
2319 ATAC-Seq peaks corresponding to 1266 upregulated genes (886 different gene names) and 946 ATAC-seq peaks corresponding to 454 downregulated (336 different gene names) were tested for significantly enriched pairs of TFBS relative to a universe containing all the peaks located +/− 8 kb around the closest TSS. For each individual motif from the homer database, all peaks in the universe were ranked by motif occupancy using a binomial score. Then for every possible pair of motifs, peaks containing both motifs were identified using the overlap between top 5000 ranked peaks for each of the individual motifs. A hypergeometric test was used to calculate the enrichment score (p-value) for the overlap between each test set and the peaks containing both motifs. The resulting p-values were corrected using the Benjamini-Hochberg correction.
Statistical analysis
All in vivo and in vitro experiments were performed using an alternating treatment allocation. All analyses were performed by an experimenter blinded to the treatment groups. The results of qRT-PCR and Luminex analyses are expressed as mean +/− SEM of at least four independent experiments; the number of analysed samples is indicated in the figure legends or on the graphs. Statistical analysis was done using the non-parametric Mann-Whitney t-test with Graphpad 5.0 software (San Diego, CA, USA). Significance is shown on the graphs (*, p < 0.05; **, p < 0.01; ***, p < 0.001). Specific statistical analyses for ATAC-seq and microarray analyses are detailed in the dedicated sections of Material and Methods. The significance of intersection between the two datasets was evaluated by hypergeometric test (Phyper function) in R studio.

(A) Quality assessment of the O4+ OPC cell purification process. RT-qPCR experiments on the O4+ OPC, CD11+ microglia (9), (3 PBS samples and 3 IL1B samples) and unlabeled cell populations, showing that, in contrast to microglia and astrocytes (unlabeled), O4+ OPCs, used in this study, express the Mbp gene, but very low mRNA levels of the microglia marker CD11 (encoded by the Itgam gene), the astrocyte marker Gfap, or of the neuronal marker NeuN. Note that NeuN is very lowly expressed, even in the unlabeled population, which mainly contains astrocytes, because neurons poorly survive our MACS protocol.
(B) Validation of OPC maturation arrest in the model. RT-qPCR analysis of the expression of myelination and progenitor markers in OPCs.
Myelin markers: Mbp, Myelin binding protein; Mog, Myelin oligodendrocyte glycoprotein; Mag, Myelin-associated glycoprotein. Plp1, proteolipid protein 1, a transmembrane, predominant component of myelin; Cnp, 2’,3’-Cyclic Nucleotide 3’ Phosphodiesterase, abundant protein in myelin in the central nervous system. Progenitor (OPC) markers: Id2, Inhibitor of differentiation 2; Pdgfra, Platelet Derived Growth Factor Receptor Alpha, a marker of OPCs. Number of independent experiments: n = 7 for Cnp, Mag, and Pdgfra; and n = 15 for Mbp, Mog, and Id2. ns: not statistically significant; *, p < 0.05; ***, p < 0.001.
(C) Schematic representation of the bioinformatics and statistics workflow used for the analysis of ATAC-Seq data
(D) Fragment length distributions in ATAC-Seq samples. Insert size distribution shows visible large periodicity of the nucleosome-free, mononucleosomal and dinucleosomal fragments, as well as the expected ~10.4bp periodicity, resulting from steric hindrance of the helical twist of the DNA on the nucleosome surface.

(A) Multidimensional Scaling (MDS) plot of distances between the 3 PBS samples and the 3 IL1B samples, using EdgeR.
(B) Scatter plots representing the dispersion (logfold change) as the number of reads (logCPM), for each individual analyzed peak (across 3 PBS samples and 3 IL1B samples). In red, peaks showing differential chromatin accessibility with FDR < 0.05. The upper left plot is identical to Fig 2B and is included here for comparison. Upper right, lower left, and lower right: scatter plots for analyses with permuted sample labels, created by swapping of one of the PBS samples with one other IL1B samples or, vice-versa. Mixing PBS and IL1B samples led to very reduced numbers of differential peaks, confirming that differential peaks found with correct sample labels are not statistical artefacts
(C) Distribution of the total number of peaks and of the 524 differential open peaks (right-hand side) in various genomic regions.
(D) Examples of peaks showing reduced or unchanged chromatin accessibility: the cytokine C-C Motif Chemokine Ligand 2 gene (Ccl2; upper panel), or C-X-C Motif Chemokine Ligand 1 and 10 genes (Cxcl1 or Cxcl10; Lower panels), respectively.
(E) GO analysis, using DAVID6.8, using genes with TSS that is annotated with one or more differentially accessible chromatin regions (total of 524 ATAC-Seq peaks).

(A) Quality control of the samples used for microarray analysis. Microarray analysis of fold change (FC) in gene expression of myelin markers that start to be expressed at P5 and of OPC markers.
(B) GO analysis corresponding to the TOP-10 genes, downregulated upon IL1B treatment, using DAVID6.8.

OP4+ OPCs exhibit profiles of transcriptomic modifications globally very different from that of CD11+ microglial cells. Examples of genes encoding cytokines and chemokines are pointed out by rectangles. Most of them are not upregulated in CD11+ microglial cells at P5, in contrast to what happens in O4+ OPCs. Fold change ([-2.0; +2.0]; IL1B/PBS).

(A) The induction of cytokine and chemokine mRNA levels, upon IL1B exposure, is reproduced in MACS-isolated ex vivo cultured OPCs during differentiation. RT-qPCR experiments on OPCs collected after 72h of differentiation. Number of independent experiments: n = 6 per condition (PBS or IL1B). *, p < 0.05; **, p < 0.01; ***, p < 0.01.
(B) TFBS motifs identified in significant ATAC-seq peaks adjacent to differentially regulated genes, using HOMER known motifs.
(C) TFBS motifs identified in significant ATAC-seq peaks adjacent to upregulated genes, using HOMER known motifs.

Average footprint profiles at TF motifs plotted at base pair resolution, located within accessible chromatin loci adjacent to any differentially regulated genes (down or upregulated) for the following TF or binding site (A): Isre, IRF1, IRF2, NFκB in PBS-treated or IL1B-treated samples, indicating that these TFs might already bind DNA. (B) for PU.1-IRF8 or PGR factors, from PBS-treated, IL1B-treated samples or from both conditions (PBS plus IL1B), the average footprints showing sharp internal spikes are suggestive of transposase insertion bias.

(A) RT-qPCR analyses in P3, P5, and P10 O4+ OPCs showing the expected increase in the expression of genes associated with myelination between P5 and P10 in normal conditions and expected impairment of this increase upon IL1B exposure. Note that in this set of experiments the downregulation of myelination genes was not observed at P5, a stage at which these genes only start to be expressed.
(B) RT-qPCR experiments comparing O4+ OPC from naïve (no injection), PBS-injected and IL1B-injected pups, showing that PBS injection does not induce expression of cytokines and chemokine genes, since transcripts levels are equivalent in both PBS and naïve conditions, in contrast to what is observed upon IL1B treatment.
(C) RT-qPCR analyses in the Oli-neu cell line before or after 72 hours of differentiation triggered by exposure to conditioned medium from primary neuron culture.
(D) Cross-species comparison confirms global similarities in the chromatin landscapes of HAEC and O4+ OPC datasets. Read number distribution of peaks upon IL1B treatment in the HAEC and OPC datasets. Reads were normalized for each set of peaks against the total number of reads present in the 7,739 matched peaks and converted into reads per million.
The alignment statistics of the samples is in line with what is expected from ATAC-Seq samples. Losing in the region of 10% of reads to mitochondrial alignment is normal for this type of data.
Table S2: Coordinates of the 213,246 peaks (mm10) detected in PBS and/or IL1B samples
MACS2 peak calling was run separately on PBS and IL1B pooled samples (n=3/group). The two resulting peak files (almost 200,000 peaks in each condition) were merged and the mm10 blacklist removed, leading to a list of 213,246 peaks detected in at least one condition (mm10 coordinates).
Table S3: List and annotation of the 524 differentially accessible peaks
Reads were counted in each of the 213,246 peaks (Table S2) for each sample individually (3 PBS and 3 IL1B samples). Comparison and statistical analysis with EdgeR (exact test and FDR by Benjamini-Hochberg method) identified 524 peaks with differential accessibility (FDR<0.05). Peaks were annotated using HOMER annotatePeaks.
Table S4: GO-term Biological Pathway analysis of the 524 differentially accessible peaks
GO-term Biological Pathway enrichment analysis was performed on the list of gene names (478) associated with the 524 peaks (Table S3) using David6.8.
Table S5: List of the differentially expressed probes from the microarray analysis
Agilent microarray data from 6 PBS and 6 IL1B samples (O4+, P5) were submitted to t-test and FDR by Benjamini-Hochberg method. Probes with FDR<0.05 and FC>1.5 (or <-1.5) are listed in the table (Sheet 1). Up-regulated (Sheet 2) and down-regulated (sheet 3) probes are also presented separately. Red flags (columns F and G) indicate the number of undetectable samples (0 means that all samples were detected). Red and green fold change values (column K) correspond to FC>2.0 and FC<-2.0, respectively. Individual values (N to Y columns) are normalized median-centered Log2 intensities.
Table S6: GO-term Biological Pathway analysis of the UP and DOWN-regulated genes
GO-term Biological Pathway enrichment analysis was performed using David6.8 on significantly up-regulated (Sheet 1) and down-regulated genes (Sheet 2) from the microarray analysis (Table S5).
Table S7: Genes whose alterations in expression correlate to opening or closing of the chromatin
Table S8: Genes whose alterations in expression correlate to opening or closing of the chromatin in region located +/− 8kb around the TSS.
Table S9: ATAC-Seq peaks associated with upregulated genes and revealing the existence of paired TFBS motifs
Table S10: Hogan (HAECS) (list of human gene names and the corresponding orthologue genes in mice, that have been used for the cross-species comparison.
Table S11: List of the RT-qPCR primers
ACKNOWLEDGEMENTS
We are grateful to Dr. Kevin Cheeseman (UMR7216) for helpful discussions and comments on the manuscript. This work benefited from equipment and services from the iGenSeq core facility, at the Institut du Cerveau et de la Moëlle (Paris, France). We are particularly grateful to Yannick Marie, the Head of iGenSeq core facility) and Emeline Mundwiller. We are grateful to Dr Sheila Harroch (Pasteur Institute, Paris, France) for the kind gift of the Oli-neu cell line. The authors acknowledge the support of the Freiburg Galaxy Team.
Footnotes
FUNDING Information
VM was funded by CNRS, Université Paris Diderot, Agence Nationale de la Recherche (« HSF-EPISAME », SAMENTA ANR-13-SAMA-0008-01) and FRA 2015/16. DSD was funded by Paris Diderot University for travel grant for SO. ALS was supported by a postdoctoral fellowship by SAMENTA ANR-13-SAMA-0008-01. PG was funded by Inserm, Université Paris Diderot, ANR-13-SAMA-0008-01, Fondation Grace de Monaco, PremUP, Fondation des Gueules Cassées, ARSEP, and an additional grant from “Investissement d’Avenir-ANR-11-INBS-0011-“ NeurATRIS. BF acknowledges support from Cerebral Palsy Alliance, Australia. PG and BF acknowledge financial support from the Department of Health via the National Institute for Health Research (NIHR) comprehensive Biomedical Research Centre award to Guy’s & St Thomas’ NHS Foundation Trust in partnership with King’s College London and King’s College Hospital NHS Foundation Trust. JL, CR, and KWA were funded by the Biotechnology and Biological Sciences Research Council (UK) through the Midlands Integrative Biology Training Partnership (MIBTP). The supporting bodies played no role in any aspect of study design, analysis, interpretation or decision to publish this data.
This version has been updated in order to precise Authors affiliation, give a clearer title and correct some typos errors. Some supplemental tables have been added
REFERENCES


