

Abstract
Brassinosteroids (BRs) form a group of steroidal hormones essential for plant growth, development and stress responses. Here, we report that plant-specific TETRATRICOPEPTIDE THIOREDOXIN-LIKE (TTL) proteins are positive regulators of BR signaling functioning as scaffold for BR signaling components in Arabidopsis. TTL3 forms a complex with all core components involved in BR signaling, including the receptor kinase BRASSINOSTEROID INSENSITIVE1 (BRI1), the transcription factor BRASSINAZOLE RESISTANT1 (BZR1) and the phosphatase BRI1-SUPPRESSOR1 (BSU1), but excluding the co-receptor BAK1. TTL3 is mainly localized in the cytoplasm, but BR treatment increases its localization at the plasma membrane, where it strengthens the association with BR signaling components. Consistent with a role in BR signaling, mutations in TTL3 and related TTL1 and TTL4 genes cause reduced BR responsiveness. We propose a mechanistic model for BR signaling, in which cytoplasmic/nuclear BR components bound to TTL proteins are recruited to the plasma membrane upon BR perception, which in turn allows the assembly of a BR signaling complex, leading to the de-phosphorylation and nuclear accumulation of the transcription factors BZR1 and BES1.
Introduction
Plants live in constantly changing environments that are often unfavorable or stressful for growth and development. In these conditions it is essential to balance growth and stress responses to ensure proper allocation of resources 1. While an active growth causes the generation of new roots and leaves, allowing a better exploitation of environmental resources, it can also cause the depletion of resources that could be important for the survival under stress episodes 23. Brassinosteroids (BRs) are a family of growth-promoting hormones having essential roles in a wide range of developmental and physiological processes 2,4,5 However, in addition to their well-established function in growth, essential roles in the trade-off between growth and tolerance to biotic and abiotic stress episodes are now being unveiled 6–9
BRs are perceived at the plasma membrane by ligand-induced heterodimers of the receptors kinases BRASSINOSTEROID INSENSITIVE1 (BRI1) and SOMATIC EMBBRYOGENESIS RECEPTOR KINASE (SERK) protein family-members, which activates an interconnected signal transduction cascade, leading to the transcriptional regulation of BR-responsive genes 5. BRI1 KINASE INHIBITOR 1 (BKI1) dissociates from activated BRI1, which phosphorylates the kinases BR-SIGNALING KINASE1 (BSK1) and the CONSTITUTIVE DIFFERENTIAL GROWTH1 (CDG1), which in turn phosphorylate the phosphatase BRI1-SUPPRESSOR1 (BSU1). Then, the active (phosphorylated) BSU1 lead to dephosphorylation and inactivation of the glycogen synthase kinase 3 (GSK3)-like BRASSINOSTEROID INSENSITIVE2 (BIN2), a key regulator in BR signaling. In the absence of BRs, BIN2 is active and phosphorylates the two homologous transcription factors BRASSINAZOLE RESISTANT1 (BZR1) and BRI1-ETHYL METHANESULFONATE SUPPRESSOR 1 (BES1/BZR2), which results in their inactivation and degradation. In contrast, when BR is present, BIN2 is inactivated and degraded by the proteasome, which leads to both the stabilization and activation of BZR1 and BES1, and therefore to transcriptional regulation of BR-responsive genes 5,10.
In Arabidopsis, the TETRATRICOPEPTIDE THIOREDOXIN-LIKE (TTL) gene family is composed of four members (TTL1 to TTL4) and mutations in TTL1, TTL3, and TTL4 genes cause reduced growth under abiotic stresses such as salinity and drought 11–13. This stress hypersensitivity is exacerbated in double and triple ttl mutants 12 The TTL2 gene is specifically expressed in pollen grains and does not have a role in stress tolerance, but it is important for male sporogenesis 12 TTL genes encode proteins with a common modular architecture containing six Tetratricopeptide Repeat (TPR) domains distributed in specific positions throughout the sequence and a C-terminal sequence with homology to thioredoxins 11,12 TPR domains are well-described protein-protein interaction modules, however how TTL proteins function mechanistically in stress tolerance remains elusive.
Several evidences point to a role of TTL proteins in BR responses, which open the possibility of a direct link between stress tolerance and BR-signaling by the TTL proteins. First, the TTL3 protein, whose gene is the most expressed among the TTL gene family, was identified as an interacting partner of the activated (phosphorylated) cytoplasmic domain of VASCULAR HIGHWAY1/BRI1-LIKE RECEPTOR KINASE2 (BRL2). Although BRL2 cannot bind BRs (Belkhadir, 2015), it is a receptor-like kinase homologous to BRI1 with a role in vascular development 13 Second, a ttl3 mutant showed altered growth in the presence of exogenous BRs 13. Third, TTL proteins are predicted to interact and function as co-chaperones of Hsp90 14, which has been recently identified to have important roles in BR signaling by interacting with specific BR signaling components 15–18. Fourth, a triple ttl1 ttl3 ttl4 mutant in TTL1, TTL3, and TTL4 shows defects in vasculature development and male sporogenesis, hallmarks of BR defective mutants 12,19. Finally, TTL1, TTL3, and TTL4 genes are specifically induced by BR application but not by other hormones 14.
Based on phenotypic and molecular analyses we show that TTL1, TTL3, and TTL4 genes, in addition to their reported role in abiotic stress tolerance, are positive regulators of BR signaling. The well-described TPR protein interaction modules of TTL proteins and their role in the assembly of multiprotein complexes 20–22 led us to hypothesize that these proteins could function as scaffold for BR signaling. Indeed, we show that TTL3 interacts with BRI1, BSU1 and BZR1 and associates in vivo with the majority of BR signaling components but not with BAK1. We also show that a functional TTL3 tagged with a Green Fluorescent Protein (GFP) shows a dual cytoplasmic and plasma membrane localization that is dependent on endogenous BR content. Furthermore TTL3 highly enhances the interaction between BSK1 and BZR1. Taking together these results, we reveal that TTL proteins function in BR-regulated stress tolerance in plants and propose a model in which TTL proteins function in optimizing BR signal transduction by acting as a scaffold of BR signaling components.
Results
TTL3 interacts with a BAKI-independent phosphomimetic BRI1 mutant
The TTL3 protein (also known as VIT1) has been identified as an interactor of the activated (phosphorylated) cytoplasmic domain of BRL2 13, a receptor kinase of the BRI1 family with a role in vascular development 13,23 TTL3 belongs to a family of 4 genes (from TTL1 to TTL4) in Arabidopsis 11,12. We confirmed defects in vein formation using a different ttl3 mutant allele (Supplementary Fig. 1a), and showed that mutations in TTL1 and TTL4, but not TTL2, also caused venation defects that were markedly enhanced in a triple ttl1 ttl3 tt4 mutant (from now on referred to as ttl134) (Supplementary Fig. 1a).
TTL3 has been proposed as an adaptor protein of BRL2 that, through association with other proteins modulate vein formation 13 TTL3, as other TTL proteins from other plant species 11,12, are characterized by the presence of 6 tetratrico peptide repeats (TPR) and a C-terminal domain with homology to thioredoxins. An in silico structural analysis of TTL3 predicts the presence of an intrinsically disordered region (IDR) at the N-terminus (Supplementary Fig. 2) with the rest of the protein forming a horseshoe-shaped structure composed of multiple helix-turn-helix motifs (Fig. 1a). This structure is consistent with TTL3 being involved in protein-protein interactions and the assembly of multi-protein complexes 20–22.

a The structural model of the TTL3 protein predicted in silico using I-TASSER server 69 and processed by PyMOL (Schrödinger). IDR, interisticaly disorder region; TPR, tetratricopeptide repeats; and TPRX thioredoxin-like domain with homology to thioredoxins; N; N-terminus; C; C-terminus.
b Schematic representation of BRI1 protein and the nine Serine/Threonine residues of the juxta-membrane and carboxyl-terminal domains that were substituted by Aspartic Acid in the BAK1-independent BRI1-constitutive (phosphomimetic) active form BRI1cytJMCT9D 70.
c Schematic representations of full-length and different truncated versions of TTL3 protein. Numbers indicates first and last amino acids of TTL3 truncated proteins. IDR, interisticaly disorder region; TPR, tetratricopeptide repeats; TPRX, thioredoxin-like domain with homology to thioredoxins; domains and protein fragments interspacing the conserved domains are represented with the same color code as in a.
d TTL3ΔN1 interacts with BRI1cytJMCT9D in vitro, as shown by GST-pull down assay. GST-TTL3ΔN1 and GST-TTL3ΔN3 were detected with nti-GST antibody. MBP-BRI1cyt and MBP-BRI1cytJMCT9D were detected using specific anti-BRI1 antibodies 71. Pull-down reflects 20% of the total pulled-down proteins. Unbound reflects 1% of the total unbound fraction.
e BRI1-HA co-immunoprecipitates with GFP-TTL3 full length and GFP-TTL3 truncated versions ΔN1, ΔN2 and ΔC1. Numbers indicate first and last amino acids of TTL3 truncated proteins. BRI1-HA was transiently co-expressed in N. benthamiana with GFP-TTL3 full length and truncated versions and GFP tagged protein was immunoprecipitated using anti-GFP Trap beads. Total (input), immunoprecipitated (IP) and Co-Immunoprecipitated (CoIP) proteins were analyzed by western blotting. Equal loading was confirmed by Coomassie blue staining (CBB) of input samples. GFP and HA tagged proteins were detected with anti-GFP and anti-HA antibody, respectively.
f Bimolecular fluorescent complementation (BiFC) confirms the association of TTL3 with BRI1 but not with BAK1. Leaves of N. benthamiana were infiltrated with the Agrobacterium strains harboring constructs to express TTL3 and BRI1 proteins fused to the N-terminus of the YFP and, BRI1 and BAK1 proteins fused to the C-terminus of the YFP. Using the same settings in the confocal microscope, YFP fluorescence is observed when TTL3-nYFP is co-expressed with BRI1-cYFP, but no YFP fluorescence is detected when TTL3-nYFP is coexpressed with BAK1-cYFP. A weak YFP fluorescence is observed when BRI1-nYFP is co-expressed with BAK1-cYFP. From left to right columns, images show BiFC YFP fluorescence in green, bright field, and 4× magnification of BiFC YFP fluorescence of the region delimited by the yellow square. Scale bars represent 20 μm. All experiments were repeated at least three times with similar results.
A previous report indicated a role for TTL3 in BR responses 13, and the similarity between BRL2 and BRI1 kinase domains (Supplementary Fig. 3) suggested that TTL3 could also interact with the BRI1 cytoplasmic domain. We therefore tested the in vitro direct interaction of TTL3 with the BRI1 cytoplasmic region, which includes the juxta-membrane (JM), the kinase domain and the carboxy-terminal (CT) domain (BRI1cyt) (Fig. 1b). While BRI1cyt was soluble when fused to an MBP tag (Supplementary Fig. 4), we were unable to produce full-length TTL3 protein fused to GST despite many attempts (data not shown) probably due to low stability caused by the IDR 24 We could however produce in E. coli two different soluble fragments: TTL3 lacking the N-terminus IDR (TTL3ΔN1) and TTL3 containing the TRLX domain (TTL3ΔN3) (Fig. 1c; Supplementary Fig. 4). Using an in vitro GST pull-down assay we did not detect interaction of BRI1cyt with either TTL3ΔN1 or TTL3ΔN3 (Fig. 1c, d). Because the activation of BRI1 is dependent on BRI1-ASSOCIATED KINASE 1 (BAK1) transphosphorylation on specific residues at the JM and CT (Wang et, 2008) we used a BAK1-independent BRI1 constitutively-active (phosphomimetic) form BRI1cytJMCT9D in which nine serines and threonines have been substituted by aspartic acid at the JM and CR domains (Wang et al., 2008) (Fig. 1b). In this case, BRI1cytJMCT9D was pulled down by TL3ΔN1, but not by TTL3ΔN3 (Fig. 1c, d). This indicates that TTL3 predominantly interacts with active BRI1 form that is independent of BAK1 activation, and that this interaction occurs between the TPR domains, but not the TRLX domain of TTL3.
Next, we investigated this interaction in vivo by performing co-immunoprecipitation (Co-IP) assays after transient expression of tagged full-length TTL3 and BRI1 in Nicotiana benthamiana. After immunoprecipitation of GFP-TTL3 and free GFP using GFP-Trap beads, we detected a strong specific interaction between GFP-TTL3 and BRI1-HA (Fig. 1e. Lanes 1 and 2). Additional Co-IP experiments using a C-terminally GFP tagged TTL3 protein (TTL3-GFP) co-expressed with BRI1-HA (Supplementary Fig. 5a) and BRI1-GFP co-expressed with TTL3-HA (Supplementary Fig. 5b) further confirmed the specificity of TTL3-BRI1 interaction and indicated that the position and tag used in the Co-IP experiments does not affect their interaction in planta.
We further used Co-IP assays to map the interaction domains of TTL3 required for the interaction with BRI1. We performed this analysis in planta in order to determine the possible role of the IDR domain in the interaction, which was not possible using in vitro assays. We generated a series of truncated TTL3 fragments with deletions at the N-terminus (TTL3ΔN1, TTL3ΔN2, TTL3ΔN3) and at the C-terminus (TTL3ΔC1, TTL3ΔC2), transcriptionally fused to GFP at the N-terminus (Fig. 1c) and co-expressed with BRI1-HA in N. benthamiana leaves. Expression analysis of the truncated proteins indicated that all accumulated at the expected molecular size (Fig. 1e, Input). TTL3ΔC1 and TTL3ΔC2 constructs, both lacking the TRLX domain, showed lower accumulation than the other constructs, suggesting that TRLX is important for protein stabilization.
Three of the five truncated TTL3 proteins, i.e. GFP-TTL3ΔN1 and GFP-TTL3ΔN2 and GFP-TTL3ΔC2 co-immunoprecipitated BRI1-HA with different efficiency - all having in common TPR3 to TPR6 (Fig. 1c) - indicating that these domains are essential for the interaction, which is consistent with the in vitro data (Fig. d). In order to better evaluate the interaction of the different TTL proteins fragments and BRI1, the amount of co-immunoprecipitated BRI1-HA was normalized relative to the amount of protein input (Fig. 1e). The strongest interaction occurs with the full-length TTL3 protein, indicating that all domains contribute to stabilize the interaction with BRI1. A lower but similar interaction was observed with GFP-TTL3ΔN1 and GFP-TTL3ΔN2, both containing the TRLX domain, indicating that this domain is important for a stable interaction although it is not sufficient to interact with BRI1 in vitro or in vivo (Fig. 1c, e). Consistent with this result, removing the TRLX region in GFP-TTL3ΔC2 greatly reduced the interaction between TTL3 and BRI1 (Fig. 1c, d, e).
Finally, the interaction between BRI1 and TTL3 was also investigated using bimolecular fluorescence complementation (BiFC) assays in N. benthamiana leaves, which provide additional information about the subcellular localization of the interaction. As shown in Fig. 1f, co-expression of TTL3-nYFP with BRI1-cYFP or BRI1-nYFP with TTL3-cYFP (Supplementary Fig. 5c) reconstituted functional YFP proteins at the plasma membrane, which confirm the interaction and is consistent with the plasma membrane localization of BRI1.
BAK1, also known as SERK3, and other SERK proteins are transmembrane kinases that function as BR co-receptors 25. Similar Co-IP experiments using TTL3-GFP and BAK1 transiently co-expressed in N. benthamiana indicated that, contrary to BRI1, TTL3 does not associate in vivo with BAK1 (Supplementary Fig. 5d). This result was verified by BiFC assays in N. benthamiana leaves. Confocal microscopic analyses revealed that coexpression TTL3-nYFP with BAK1-cYFP (Fig. 1f) and also BAK1-nYFP with TTL3-cYFP (Supplementary Fig. 5c) did not reconstitute functional YFP proteins. To confirm that BiFC BAK1 constructs were functional, we performed BiFC between BRI1 and BAK1 resulting in positive signals (Fig. 1f; Supplementary Fig. 5c)
ttl mutants show defects in BR responses
The interaction of TTL3 with BRI1 supports a role of TTL3 in BR signaling. Quantitative RT-PCR analyses indicate that the expression of TTL1, TTL3, and TTL4 is induced by BR 14, which is also supported by available transcriptomic data (Supplementary Fig 6a). This up-regulation of the TTL genes in response to BR was confirmed at cellular level by analyzing transgenic plants transformed with the reporter β-glucuronidase gene driven by each of the TTL promoters (Supplementary Fig 6b).
Next, we analyzed the sensitivity to exogenous epibrassinolide (eBL) by measuring root growth in the presence or absence of 100 nM eBL in single ttl mutants, the triple ttl134 mutant and bak1-4, a well-established mutant affected in BR responses 26–29. Single ttl mutants, the ttl134 mutant, and the bak1-4 mutant showed a similar root growth to Col-0 in control conditions (Fig. 2a; Supplementary Fig. 7a). However, bak1-4, ttl1, ttl3, and ttl4 show increased root length than Col-0 control or ttl2 in the presence of eBL (Fig. 2a; Supplementary Fig. 7b). This decreased sensitivity to eBL of single ttl mutants was strongly enhanced in the ttl134 (Fig. 2a; Supplementary Fig 7b). Root growth sensitivity to eBL of the ttl134 mutant was then compared, in addition to bak1-4, to well characterized genotypes affected in BR responses such as serk1-1 and the double serk1-1 bak1-4 mutant26 In control conditions, all genotypes grew similarly, with the exception of serk1-1 bak1-4, which showed reduced root growth (Fig. 2b; Supplementary Fig 7c) as previously reported 30,31. In the presence of 100 nM eBL, the root growth reduction of the Col-0 control was significantly higher than for the rest of the genotypes, including ttl134 (Fig. 2b; Supplementary Fig 7d), while serk1-1 bak1-4 double mutant was almost insensitive to eBL, as it showed a similar root growth in control and eBL-supplemented media (Fig. 2b; Supplementary Fig 7c, d).

a ttl1, ttl3, ttl4 and ttl134 show root growth hyposensitivity to BR. Statistical analysis of root length measurements of Col-0, ttl, and bak1-4 mutants in control conditions (MS) and in response to BL. Seedlings were grown in long days for 4 days in half-strength MS agar solidified medium and then transferred to half-strength MS agar solidified medium (MS) or half-strength MS agar solidified medium supplemented with 100 nM of Brassinolide (MS + 100 nM eBL) and root length was measure 6 days later. Asterisks indicate statistical differences between mutant vs Col-0 determined by the unpaired t-test (* P ≤ 0.05, ** P ≤ 0.01, *** P ≤ 0.001 **** P < 0.0001). Data represent mean values, error bars are SEM, n≥35 seedlings per experiment. The experiment was repeated three times with similar results.
b. Root length responses to eBL of wild-type Col-0, ttl134 and BR perception mutants. Seedlings were grown and root length was analyzed as described in a. Asterisks indicate statistical differences between mutant vs Col-0 as determined by the unpaired t-test (*** P ≤ 0.001 **** P ≤ 0.0001). Data represent mean values, error bars are SEM, n=30 seedlings per experiment. The experiment was repeated three times with similar results.
c Defective hypocotyl elongation in ttl mutants. Col-0, ttl3, ttl134 and bak1-4 seedlings were grown for 4 days in long-day photoperiod in half-strength MS agar solidified medium. Seedlings with the same size were then placed in the dark and hypocotyl elongation was measure 3 days later. Asterisks indicate statistically difference significances between Col-0 vs the indicated genotype as determined by the unpaired t-test (**** P ≤ 0.0001), values are mean, error bars are SEM, n = 80 seedlings per experiment. The experiment was repeated twice with similar results.
d BR-responsive genes DWF4 and CPD show induced expression in ttl134 and bak1-4 relative to Col-0 seedlings. Seeds were germinated in half-strength MS agar solidified medium and grown vertically in long-day photoperiod conditions. 5-day-old seedlings were transferred to half-strength MS liquid medium and after 5 days of acclimation, relative expression level of DWF4 and CPD was measured by quantitative reverse transcriptase PCR (qPCR). The expression of DWF4 and CPD was first normalized to the expression of ACTIN2 gene and represented relative to the expression of Col-0. The data are shown as mean ± SEM from at least three independent biological replicates. Asterisks indicated statistically significant differences between the indicated genotype vs Col-0 as determined by the unpaired t-test (* P ≤ 0.05, ** P ≤ 0.01). The experiment was repeated three times with similar results.
e Phosphorylation status of BES1 in response to exogenous applied BR in Arabidopsis Col-0 and ttl134. Ten-day-old seedlings pre-treated for 3 days with the BR biosynthetic inhibitor brassinazole (BRZ) to deplete the endogenous pool of BRs were submitted to 10 nM eBL treatment for 0, 30 and 60 minutes. Total proteins were analyzed by an immuoblotting assay with a specific anti-BES1 antibody 72. The upper band corresponds to phosphorylated BES1 (pBES1) and the lower one to dephosphorylated BES1 (BES1). The experiment was repeated two times with similar results.
Hypocotyl elongation in the dark is dependent on active BR signaling 32 We analyzed hypocotyl elongation in the dark of ttl3, ttl134 and bak1-4 as a read-out of defective BR signaling 33. As previously reported, bak1-4 showed a reduction in hypocotyl elongation relative to Col-0 34,35(Fig. 2c; Supplementary Fig 8). Similar to bak1-4, ttl3 and ttl134 mutants presented shorter hypocotyls than Col-0 (Fig. 2c; Supplementary Fig 8).
To investigate the contribution of TTL genes to BR responses at the molecular level, we first studied the expression of the BR-regulated genes CPD1 and DWF4 in Col-0, bak1-4, and the triple ttl134 mutants. As shown in Fig. 2d, DWF4 and CDP1 expression was around two-fold higher in ttl134 and bak1-4 compared to the Col-0 control. This increased CPD1 and DWF4 expression has been reported for BR signaling mutants such as bri1-5 36, bri1-301 26 and bik1 37, and is caused by a lack of feedback regulation in the expression of these biosynthetic genes 38–40. Second, we investigated the phosphorylation status of BES1 in Col-0 and the ttl134 mutant in response to eBL. Because the BR biosynthetic genes DWF4 and CDP1 are induced in ttl134, and to fully capture the BR signaling capacity of ttl134, we first pretreated the seedlings with BR biosynthesis inhibitor brassinazole (BRZ). Without BR treatment, a strong phosphorylated BES1 (pBES1) band and a weak unphosphorylated (BES1) band are present in Col-0 and ttl134 (Fig. 2e). As expected, BR treatment caused an increase of dephosphorylated BES1 in Col-0 due to activation of the pathway. However, eBL caused little dephosphorylation of pBES1 in ttl134 seedlings (Fig. 2e), confirming a defective BR signaling in ttl134.
BRs regulate the cytoplasmic/plasma membrane localization of TTL3
To further explore how TTL3 functions in BR signaling we analyzed its subcellular localization. Although the BiFC interaction of TTL3 with BRI1 suggests a plasma membrane localization of TTL3, expression of a C-terminal GFP-tagged TTL3 in N. benthamiana indicated a predominant cytoplasmic localization in basal conditions (Supplementary Fig. 9a). However, plasmolyzed cells show the presence of GFP-TTL3 in Hechtian strands, indicative that TTL3 also associated with the plasma membrane (Supplementary Fig. 9b). In order to gain further insight into TTL3 localization, a genomic fragment including a 1.7 kb TTL3 promoter region upstream of the start codon was transcriptionally fused to GFP to generate the TTL3p::TTL3g-GFP construct and transformed into ttl3 and ttl134 mutants using A. tumefaciens. After confocal analysis of a large number of independent stable transgenic lines, we selected two homozygous lines, one in ttl3 background (hereafter referred to as TTL3-GFP 1.2) and another in ttl134 background (TTL3-GFP 2.4), which presented noticeable fluorescence signals. Venation defects of ttl3 and ttl134 were restored to levels similar to Col-0 in TTL3-GFP 1.2 and TTL3-GFP 2.4, (Supplementary Fig.1b). Furthermore, root growth of TTL3-GFP 1.2 (Supplementary Fig.10a, b) and TTL3-GFP 2.4 (Fig. 3a, b, c) were restored to wild type levels in the presence of eBL, indicative of a functional TTL3-GFP protein.

a-c The root growth responses to eBL of the ttl134 triple mutant are complemented in the TTL3-GFP 2.4. Seedlings were grown for 4 days in halfstrength MS agar solidified medium and then transferred to half-strength MS agar solidified medium (a) or half-strength MS agar solidified medium supplemented with 100 nM of Brassinolide (b). a Representative picture of seedlings 6 days after treatment. Scale bar represents 1 cm. c Statistical analysis of root length of Col-0, ttl134 and the complementation line TTL3-GFP 2.4. Asterisks indicate statistically significant differences between the indicated genotype vs Col-0 as determined by the unpaired t-test (**** P ≤ 0.0001). Data represent mean values, error bars are SEM, n=30 seedlings per experiment. The experiment was repeated three times with similar results.
d Expression pattern of TTL3-GFP in 3-day-old TTL3-GFP 2.4 Arabidopsis seedlings. Image was captured using conventional wide field fluorescence microscopy with a GFP filter. Scale bar represents 500 μm.
e-f Longitudinal median section of root tips of a 3-day-old Col-0 (e) and TTL3-GFP 2.4 as observed by laser scanning confocal microscopy (f). Images show a merge of green channel showing TTL3-GFP expression and red channel showing plasma membrane stained with FM4-64. Scale bar represents 20 μm.
g-i Confocal images showing localization of TTL3-GFP in epidermal cells from root meristematic zone in 4-day-old Arabidopsis TTL3-GFP 2.4 in half-strength MS agar solidified medium, in control conditions (1 hour treatment with eBL solvent) (g) or after 1 hour of 1 μM eBL treatment (h) in half-strength MS agar liquid medium. Scale bar represents 10 μm (horizontal bar). i Quantification of fluorescent protein signal in plasma membrane vs cytoplasm. Line scan measurements spanning membrane and cytoplasm were carried out (represented in g and h as a vertical white line), and representative plot profiles of sample measurements are presented.
j-k Quantification of the cytoplasmic and PM localization of TTL3-GFP in 4-day-old Arabidopsis TTL3-GFP 2.4 seedlings treated for 1 hour with 1 μM eBL (j), or pre-treated for 12 hour with 5 μM BRZ prior to 1 μM eBL application for 1 hour (k). Analyses were carried out counting the number of cells with dual cytoplasmic/plasma membrane localization in meristematic and transition zone for each analyzed root using confocal microscopy. Seedlings were grouped in categories according to the number of cells that presented this dual localization, and the percentage of seedlings displaying each category depicted at right side panel was calculated. Represented categories (right side panel) indicate the number of cells per seedling with dual cytoplasmic/plasma membrane localization. At least 16 seedlings per treatment, and approximately 200 cells from epidermis, cortex and endodermis per seedling of the meristematic region of the root tip were analyzed.
We then used TTL3-GFP 2.4 (which showed a stronger fluorescence signal than 1.2) to analyze the cellular and subcellular localization of TTL3. Examination under a stereomicroscope indicated that TTL3-GFP accumulated mainly at the root tip and the hypocotyl of Arabidopsis seedlings (Fig. 3d). This accumulation coincides with cells that undergo strong BR signaling leading to active growth, and highly resembles the accumulation pattern of BRI1-GFP 41–43. Cellular analysis using confocal microscopy was performed in 3-day-old roots, simultaneously localizing TTL3-GFP with the FM4-64, a lipophilic red dye that labels the plasma membrane and tracks plasma membrane-derived endosomes 44 In Col-0 control roots, no GFP signal was detected (Fig. 3e), while analysis of TTL3-GFP 2.4 revealed the presence of TTL3-GFP in all cell files of the root apical meristem (Fig. 3f). Further up, in the meristematic region, TTL3-GFP showed a predominant localization in the outer cell layers (epidermis and cortex) (Fig. 3f).
At the subcellular level, TTL3-GFP mostly showed a cytoplasmic localization in the root meristematic cells (Fig. 3g). However, we sometimes observed seedlings that, in addition to the cytoplasmic GFP localization, showed GFP signal at the plasma membrane. Therefore, we quantified the plasma membrane localization of TTL3-GFP (see Figure legend and Methods section for details) in control conditions and found that in ~30% of the seedlings some cells showed plasma membrane localization of TTL3-GFP (Fig. 3j).
Interestingly, treatment with 1 μM eBL, a concentration previously used to analyze short-term BKI1 dynamics 45, increased the amount of TTL3-GFP protein (Supplementary Fig. 11) and caused a relocalization of TTL3-GFP from the cytoplasm to the plasma membrane (Fig. 3h, j; Supplementary Fig. 12a, b). A detailed quantification indicated that eBL treatment cause a drastic increase in the amount of seedlings and the number of cells per seedling with plasma membrane-localized TTL3-GFP (Fig. 3j). eBL treatment also caused the appearance of GFP-labeled intracellular structures (Fig. 3h), although these intracellular TTL3-GFP structures do not colocalize with FM4-64 (Supplementary Fig. 12), discarding the possibility that they may correspond to plasma membrane-derived endosomes, and thus their identity remains elusive.
Consistent with the possibility that the plasma membrane localization of TTL3-GFP in seedlings grown in control medium was caused by endogenous BRs, the percentage of seedlings with plasma membrane signal decreased from ~30% to ~5% after treatment with BRZ (Fig. 3k). Further treatment of these seedlings with eBL reverted this effect and increased the plasma membrane localization of TTL3-GFP (Fig. 3k).
TTL3 associates with the BR signaling components BSK1, BSU1 and BIN2 and directly interacts with BSU1
Our previous analyses indicate that TTL3 is involved in BR signaling probably through the scaffolding of BR signaling components. Using Co-IP and BiFC in N. benthamiana we investigated the possible association of TTL3 with other core components of BR signaling. TTL3 strongly associates with BSK1 in both Co-IP and BiFC assays (Fig. 4a, b). BiFC between TTL3 and BSK1 was also obtained when we exchanged nYFP and cYFP tags (Supplementary Fig. 13) and consistent with the plasma membrane localization of BSK1, the BiFC signal for BSK1-TTL3 was observed at the plasma membrane. TTL3 also associates with BSU1 and BIN2 in both Co-IP and BiFC assays (Fig. 4b, c, d). Although BSU1 and BIN2 present a dual nuclear and cytoplasmic localization 46,47, BiFC signals were only observed in the cytoplasm for both TTL3-BSU1 and TTL3-BIN2, which is consistent with the lack of TTL3 protein in the nucleus (Fig. 4b). A cytoplasmic BiFC signal was also obtained when YFP halves were interchanged among TTL3-BSU1 and TTL3-BIN2 (Supplementary Fig. 13). Two BSU1 bands with different mobility in SDS-polyacrylamide gel electrophoresis were obtained after expression in N. benthamiana. This apparent difference in size is likely caused by a different phosphorylation status (Fig. 4c), and interestingly, TTL3 mainly associated with the faster mobility BSU1 band (Fig. 4c). Reducing endogenous BRs by BRZ treatment decreased the relative amount of the lower band (Supplementary Fig. 14), suggesting that this band corresponds to the active (dephosphorylated) BSU1 form.

a BSK1 co-immunoprecipitates with TTL3. BSK1-HA and GFP-TTL3 were transiently expressed in N. benthamiana. GFP-TTL3 was immunoprecipitated with anti-GFP Trap beads. Total (input), immunoprecipitated (IP) and Co-Immunoprecipitated (CoIP) proteins were analyzed by western blotting. Equal loading was confirmed by Coomassie blue staining (CBB) of input samples. GFP-TTL3 and BSK1-HA were detected with anti-GFP and anti-HA antibody, respectively.
b BiFC assays confirm the association of TTL3 with BSK1, BSU1 and BIN2. Leaves of N. benthamiana were agroinfiltrated with the Agrobacterium strains harboring a construct to express TTL3 protein fused to the N-terminus half of the YFP and BSK1, BSU1 and BIN2 protein fused to the C-terminus half of the YFP. Using the same settings in the confocal microscope, YFP fluorescence is observed when TTL3-nYFP is co-expressed with BSK1-cYFP, BSU1-cYFP or BIN2-cYFP. From left to right columns, images show BiFC YFP fluorescence in green, bright field, and 4× magnification of BiFC YFP fluorescence of the region delimited by the yellow square. Scale bars represent 20 μm.
c BSU1 co-immunoprecipitates with TTL3. GFP-TTL3 and BSU-HA proteins were transiently expressed in N. benthamiana, immunoprecipitated and analyzed as described in a. GFP-TTL3 and BSU1-HA were detected with anti-GFP and anti-HA antibodies, respectively.
d Yeast-two-hybrid assays to determine the interaction of full-length TTL3, the TTL3 fragment TTL3ΔN1 (amino acid 204-691) and the TTL3 fragment TTL3ΔN2 (amino acid 371-691) with BIN2 and BSU1. Growth on plasmid-selective media (left column) and interaction-selective media (lacking adenine, right column) are shown.
e BIN2 co-immunoprecipitates with TTL3. BIN2-HA and GFP-TTL3 proteins were expressed in N. benthamiana, immunoprecipitated and analyzed as described in a. GFP-TTL3 and BSU1-HA were detected with anti-GFP and antiHA, respectively.
Next, we investigated possible direct interactions between TTL3 and the cytoplasmic BR signaling components BSU1 and BIN2, using yeast two-hybrid assays. Using a full-length TTL3 protein, we did not find interactions with any of the investigated BR components, despite obtaining previously positive reported interactions such as BIN2 with BSU1 and with BES1 (Fig. 4e). Western blot analysis indicated that BD-TTL3 fusion protein was not detected (Supplementary Fig. 15), similar to what previously occurred in E. coli. Therefore, we generated additional yeast two-hybrid constructs using the TTL3ΔN1 and TTL3ΔN2 fragments (Fig. 1c). As shown in Fig. 4e, TTL3ΔN1 but not TTL3ΔN2 interacted with BSU1, indicating that the six TPR domains are required for the interaction. In contrast to BSU1, BIN2 did not interact with TTL3ΔN1 (Fig. 4e), despite the positive interactions of BIN2 with BSU1 or BES1 were detected (Fig. 4e). These data indicate that the six TPR of TTL3 are required for the in vitro interaction with BSU1 while in vivo data suggests that TTL3 preferentially associates with the active (phosphorylated) BSU1.
TTL3 interacts with the transcription factors BZR1 and BES1 and affects BZR1 cytoplasmic/nuclear localization
In the absence of BRs, BIN2 phosphorylates and inactivates BZR1 and BES1, which are the two major transcription factors mediating BR-induced transcriptional changes 5. TTL3 associates with BZR1 in Co-IP experiments in N. benthamiana (Fig. 5a) and in Arabidopsis mesophyll protoplasts (Fig. 5b). Phosphorylated and dephosphorylated BZR1 and BES1 proteins show a marked difference in mobility in SDS-PAGE upon expression in N. benthamiana, (Fig. 5a, b, Supplementary Fig. 16a, b) or in Arabidopsis protoplasts (Fig. 5b) 48,49. Interestingly, only the phosphorylated BZR1 (pBZR1) was co-immunoprecipitated with TTL3 (Fig. 5b, Supplementary Fig. 16a) indicating a preferential association of TTL3 with pBZR1. Similarly, TTL3 only co-inmunoprecipitated the phosphorylated BES1 (pBES1) (Supplementary Fig. 16b). BiFC assays further confirmed the in vivo association of BZR1 and BES1 with TTL3 (Fig. 4c, Supplementary Fig. 13). While the BiFC signal of TTL3 with plasma membrane BR components results in a smooth YFP fluorescence signal at the plasma membrane (Fig. 1f, Supplementary Fig. 5c, Fig. 4b, Supplementary Fig. 13), the BiFC signal of TTL3 with the cytoplasmic components appear punctated (Fig. 4b, Supplementary Fig. 13, Fig. 5c). A similar punctate BiFC signal has been previously reported for BZR1 with BRZ-SENSITIVE-SHORT HYPOCOTYL1 (BSS1) 50 or BES1 with DOMINANT SUPPRESSOR OF KAR 2 (DSK2) 7, although its significance remains unknown.

a TTL3 co-immunoprecipitates with BZR1. TTL3-HA and BZR1-GFP were transiently expressed in N. benthamiana. BZR1-GFP was immunoprecipitated with anti-GFP Trap beads. Total (input), immunoprecipitated (IP) and Co-Immunoprecipitated (CoIP) proteins were analyzed by western blotting. Equal loading was confirmed by Coomassie blue staining (CBB) of input samples. BZR1-GFP and TTL3-HA were detected with anti-GFP and anti-HA, respectively. The upper band corresponds to phosphorylated BZR1 (pBZR1-GFP) and the lower one to dephosphorylated BZR1 (BZR1-GFP).
b Co-immunoprecipitation of BZR1-HA with TTL3-GFP expressed in transfected Arabidopsis Col-0 protoplasts. Samples were analyzed as in a. Protoplasts cotransfected with free GFP and BRI1-HA, were used as a negative control for Co-IP. Equal loading was confirmed by Ponceau staining of input samples. TTL3-GFP and free GFP were detected with anti-GFP antibody and BRI1-HA was detected with anti-HA antibody. Asterisk indicates GFP that results from proteolytic cleavage of TTL3-GFP. Red arrow indicates an artefact from imaging blot with high sensitivity using Azure c300 Chemiluminescent Western Blot Imaging System
c BiFC confirms the association between TTL3 and BZR1. Leaves of N. benthamiana were agroinfiltrated with the Agrobacterium strain harboring a construct to express the TTL3 protein fused to the N-terminus half of the YFP and the BZR1 or BES1 protein fused to the C-terminus half of the YFP. YFP fluorescence is observed when TTL3-nYFP is co-expressed with BZR1-cYFP or BES1-cYFP using confocal microscopy. From left to right columns, images show BiFC YFP fluorescence in green, bright field, and 4× magnification of BiFC YFP fluorescence of region delimited by the yellow square. Scale bars represent 20 μm.
d Yeast-two-hybrid assays to determine the interaction of BZR1 with TTL3, the TTL3 fragment TTL3ΔN1 (amino acid 204-691), the TTL3 fragment TTL3ΔN2 (amino acid 371-691), BES1 and BIN2. Interaction of BZR1 with a fragment of SV40 large T-antigen (AD-AgT) was also included to show BD-BZR1 selfactivation capacity. Growth on plasmid-selective media (left column) and interaction-selective media (lacking adenine, right column) are shown.
e-f TTL3 abolishes the cytoplasmic retention of BZR1 by BIN2. Subcellular localization of BZR1-GFP alone, co-expressed with BIN2-HA, and with BIN2-HA and TTL3-HA in N. benthamiana leaves (e) and in NahG-Arabidopsis leaves (f). Images of the GFP signal were obtained by using laser scanning confocal microscopy. Images show a single equatorial plane in N. benthamiana leaves (e), and a maximum Z-projection of seven 1 μm spaced focal planes from the cell equatorial plane to the cell surface in NahG-Arabidopsis leaves (f). Scale bars represent 20 μm.
g Western blot analysis of the BZR1-GFP proteins transiently expressed alone, co-expressed with BIN2-HA, and co-expressed with BIN2-HA and TTL3-HA in N. benthamiana leaves observed by confocal microscopy in e. Proteins were analyzed by western blotting. Equal loading was confirmed by Coomassie blue staining (CBB) of input samples. BZR1-GFP was detected with anti-GFP antibody, while TTL3-HA and BIN2-HA were detected with anti-HA antibody. In the anti-GFP blot, the upper band corresponds to phosphorylated BZR1 (pBZR1-GFP) and the lower one to dephosphorylated BZR1 (BZR1-GFP).
Next we performed a yeast two-hybrid assay between TTL3 and the transcription factor BZR1. As expected (see Fig. 4e), a full-length TTL3 protein did not interact with BZR1, despite detecting the previously described positive interaction between BZR1 and BIN2 51 (Fig. 5d). However we could detect the direct interaction between TTL3ΔN1 (Fig. 1c) and BZR1 (Fig. 5d) and contrary to BSU1, TTL3ΔN2 (Fig. 1c) also interacted with BZR1 (Fig. 5d) indicating that the TPR3 to TPR6 region is sufficient for the TTL3-BZR1 interaction (Fig. 5d).
We next analyzed the effect of TTL3 on the nuclear and cytoplasmic localization of BZR1-GFP. As previously reported, BZR1-GFP in N. benthamiana is mainly localized in the nucleus (Fig. 5e), while co-expression of BIN2 together with BZR1-GFP promotes its phosphorylation and its cytoplasmic retention (Fig. 5e) 52. Co-expressing TTL3-HA with BZR1-GFP and BIN2-HA suppressed the cytoplasmic retention of BZR1-GFP promoted by BIN2 (Fig. 5e). We also used Arabidopsis plants expressing the salicylate hydroxylase (NahG) gene, as these plants are efficiently transiently transformed using A. tumefaciens 53. Similar to N. benthamiana, coexpressing BIN2-HA together with BZR1-GFP increased its cytoplasmic accumulation, which was further abolished by TTL3-HA (Fig. 5f). This BZR1 nuclear/cytoplasmic localization correlates with the dephosphorylation status of BZR1 (Fig. 5g), indicating that TTL3 negatively regulates BIN2 phosphorylation of BZR1 and regulates its activity.
TTL3 acts as a scaffold by enhancing BZR1-BSK1 interaction
Next, we investigated a possible scaffold function of TTL3 in BR signaling and investigated whether TTL3 affects the association of the plasma membrane-localized BSK1 with cytoplasmic components of BR signaling using BiFC. As shown in Fig. 6a, strong BiFC signal was obtained for BSK1 with BRI1, BSU1 and BIN2 while a weak signal was obtained for BSK1 with BZR1. The strong BiFC signal detected for BSK1 with BRI1 and with BSU1 is expected since this BR signaling components direct interact with BSK1 52. BIN2, although mainly localizes at the nucleus and cytosol, also localizes at the plasma membrane 47 and direct interaction with several plasma membrane-localized BSKs in yeast two-hybrid assays was previously reported 54 The weak BSK1-BZR1 association is consistent with a previous proteomic study that identified BSK1 as an interactor of BZR1 55. Importantly, when we co-expressed TTL3-HA together with BSK1-nYFP and BZR1-cYFP the BiFC signal was strongly enhanced (Fig. 6b) indicating that TTL3 increases the association between BSK1 and BZR1 at the plasma membrane. Further Co-IP experiments also showed that the amount of BSK1-HA that was immunoprecipitated with BZR1 - GFP was also enhanced upon co-expression of TTL3-mCherry (Fig. 6c). This result strongly supports a scaffolding role of TTL3 that would help bringing a cytoplasmic component such BZR1 with BR signaling components at the plasma membrane such BSK1.

a BiFC shows strong association of BSK1 with BRI1, BSU1, BIN2 and weak association with BZR1. N. benthamiana leaves were co-agroinfiltrated with the Agrobacterium strains harboring a construct to express the BSK1 protein fused to the N-terminus half of the YFP and the BRI1, BSU1, BIN2 or BZR1 proteins fused to the C-terminus half of the YFP and observed under the laser scanning confocal microscope. Strong fluorescence signals are observed when BSK1-nYFP is co-expressed with BRI1-cYFP, BSU1-cYFP or BIN2-cYFP. Faint YFP signal is observed when BSK1-nYFP is co-expressed with BZR1-cYFP. From left to right columns, images show BiFC YFP fluorescence in green and bright field. Scale bars represent 20 μm.
b Expression of TTL3 increases the weak BiFC association of BSK1 and BZR1. N. benthamiana leaves were co-agroinfiltrated with the Agrobacterium strains harboring the corresponding constructs to express the BSK1 protein fused to the N-terminus half of the YFP and the BZR1 protein fused to the C-terminus half of the YFP. N. benthamiana leaves were pre-treated with 5 BL for 3 hours before confocal imaging analysis. Co-expression of TTL3-HA together with BSK1-nYFP and BZR1-cYFP highly enhances GFP signal. From left to right columns, images show BiFC YFP fluorescence in green and bright field. Scale bars represent 20 μm.
c TTL3 increases the amount of BSK1 immunoprecipitated by BZR1. Tagged BSK1-HA and BZR1-GFP proteins were transiently expressed in N. benthamiana. BZR1-GFP and BSK1-HA were co-expressed with or without TTL3-mCherry in N. benthamiana leaves and were pre-treated with mock or 5 BL for 3 hours as indicated in the figure. BZR1-GFP was immunoprecipitated with anti-GFP Trap beads. Total (input), immunoprecipitated (IP) and Co-Immunoprecipitated (CoIP) proteins were analyzed by western blotting. Equal loading was confirmed by Coomassie blue staining (CBB) of input samples. Co-expression of TTL3-mCherry enhanced the amount of BSK1-HA that CoIP with BZR1-GFP. BZR1-GFP and BSK1-HA were detected with anti-GFP and anti-HA antibody, respectively.
DISCUSSION
Our study reveals that plant-specific TTL proteins function as positive regulators of BR signaling. The expression of TTL genes is induced by BRs and TTL3 shows its highest expression at the root elongation zone and at the hypocotyl, which are areas of high BR activity 32,56 A functional TTL3-GFP is mainly localized in the cytoplasm but also shows plasma membrane localization dependent on BR concentration. The ttl134 mutant is hyposensitive to BR in root growth assays, shows reduced hypocotyl elongation under darkness, has increased expression of BR marker genes CPD1 and DWF4 in normal growth conditions, and exhibits reduced BES1 dephosphorylation levels after BR treatment. Furthermore, co-expression of TTL3 together with BZR1 and BIN2 abolishes the BIN2-directed BZR1 cytoplasmic retention in Arabidopsis and N. benthamiana. Thus, TTL3 negatively regulates BIN2-phosphorylation and subcellular localization of BZR1 48,49,52,57.
TTL3 protein associates in vivo with all core BR signaling components, with the exception of BAK1, and shows direct interaction with BRI1, BSU1 and BZR1. TTL3 contains several defined domains: an IDR at the N-terminus followed by 6 TPR domains involved in protein-protein interactions and assembly of multiprotein complexes, and a region with homology to thioredoxins at the C-terminus. With the exception of the IDR, most of the protein is predicted to form helix-turn-helix. Mapping the interaction domains of TTL3 with BRI1 indicates that the last four TPRs are essential for this interaction, the TRLX domain is important for protein stabilization, and that both TRLX and the IDR contribute to strengthen the interaction. The presence of an IDR in TTL proteins can provide additional advantages in their scaffolding and regulatory function. It was previously reported that IDRs allow their interaction with a large number of interaction partners due to their ability to adopt different conformations thus allowing the assembly of multiple proteins 58. We also found that interaction of TTL3 with BSU1 requires all 6 TPRs while only the last four TPR domains are required for the interaction with BZR1.
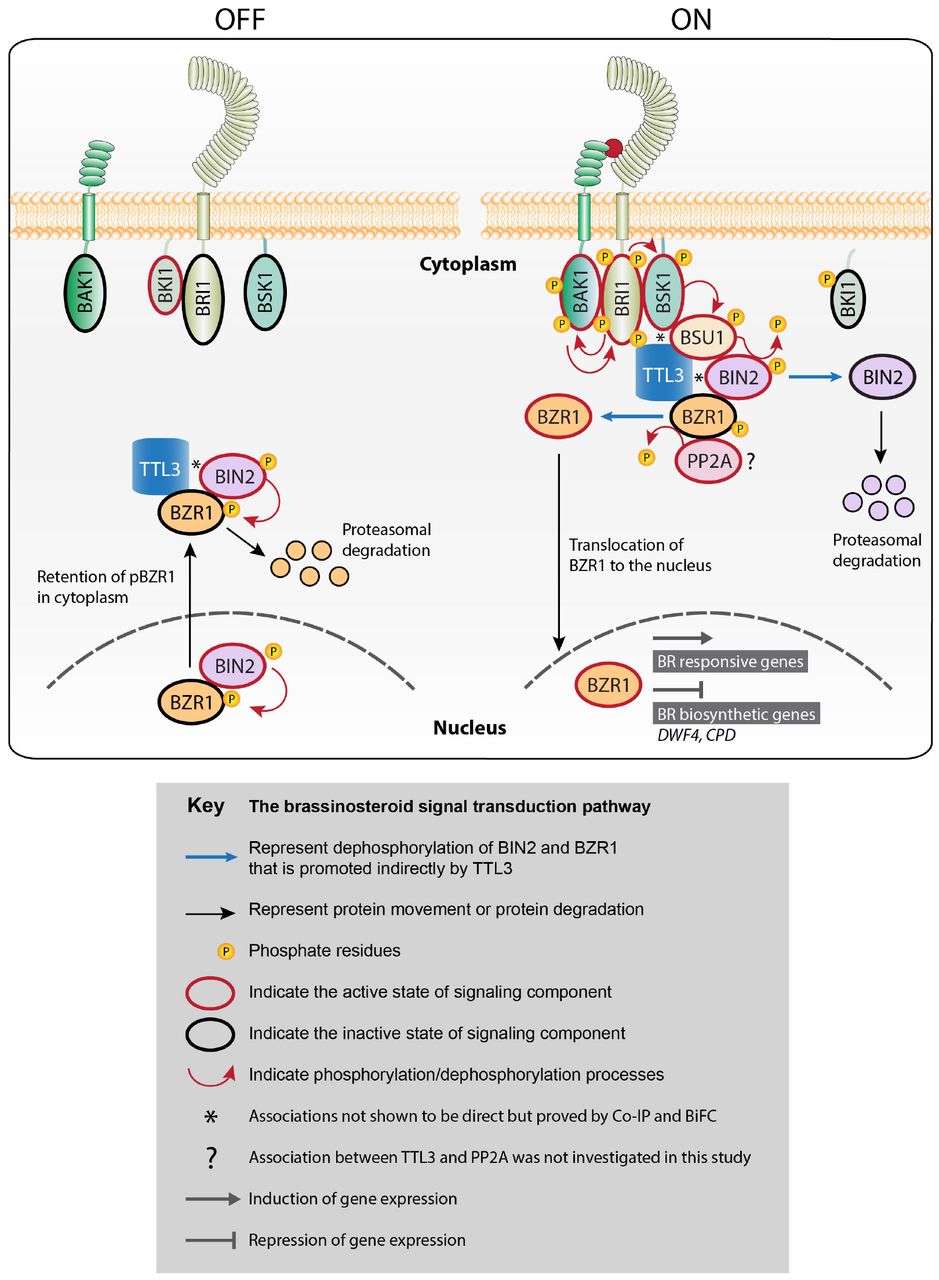
The BR-related phenotypes, together with the structure of TTL3 and the interactions here described, led us to propose a model in which TTL3 (and probably other TTLs) functions as a scaffold for BR signaling components (Fig. 7). In the absence of BR, TTL3 is localized in the cytoplasm where it forms a complex with phosphorylated BZR1 and BIN2. In these conditions BZR1 is continuously phosphorylated by BIN2, keeping it inactive. Upon BR perception, the activation of BRI1 by BAK1 causes the re-localization of TTL3-GFP to the plasma membrane, which in turn, brings the TTL3-associated BR cytoplasmic components to the plasma membrane causing the assembly of the pathway components (Fig. 7). The small amount of plasma membrane-localized TTL3 in control conditions probably reflects basal BRI1 signaling induced by endogenous BR, as demonstrated by the reduced plasma membrane localization of TTL3 after BRZ treatment (Fig. 3k). The TTL3-dependent assembly of cytoplasmic BR components at the plasma membrane would then promote the inactivation of BIN2 by the BSU1 phosphatase 52 Inactivation of BIN2 by active BSU1 (which is preferentially bound by TTL3) will, in turn, cause the dephosphorylation of BZR1 by PP2A. Because dephosphorylated BZR1 do not interact with TTL3, it will be released from the complex and subsequent activation of BR dependent genes in the nucleus will take place (Fig. 7).
The present study reveals that TTL3 acts as a positive regulator of brassinosteroid (BR) signaling. Our data show that TTL3 presents mainly a cytoplasmic localization in the absence of BR but accumulates at the plasma membrane in response to BR perception. We show that TTL3 directly interacts with BRI1, BSU1 and BZR1, and associates with BSK1 and BIN2 to assemble a BR perception protein complex at the plasma membrane in order to optimize the BZR1 dephosphorylation and active BR signaling.
Inactive pathway (OFF) represents the absence of BR and activated pathway (ON) the presence of BR. OFF: In the absence of BR, BRI1 is inactivated by BKI1 and the other plasma membrane components, BAK1 and BSK1, do not associate with BRI1 to form an active complex. In the cytoplasm and in the nucleus, BIN2 phosphorylates BZR1, promoting the inhibition of its DNA-binding activity and its cytoplasmic retention and subsequent degradation in a proteasome-dependent manner. ON: BR binding to the extracellular domain of BRI1 induces not only its dissociation with BKI1 but also its association with the co-receptor BAK1, which functions as a co-receptor of BR. This leads to the activation of BRI1 by trans-phosphorylation events. BAK1 activated BRI1 phosphorylates BSK1 kinase and also causes re-localization of TTL3 to the plasma membrane. There, TTL3 preferentially associates with the active (phosphorylated) BSU, facilitating the dephosphorylation and inactivation of BIN2, which is subsequently degraded by the proteasome. This BIN2 inactivation causes BZR1 dephosphorylation by PP2A and translocation to the nucleus to regulate the transcription of BR target genes.
TTL3, TETRATRICOPEPTIDE THIOREDOXIN-LIKE 3; BRI1, BRASSINOSTEROID INSENSITIVE 1; BAK1, BRI1-ASSOCIATED KINASE 1; BKI1, BRI1 KINASE INHIBITOR 1; BSK, BRI1 SUBSTRATE KINASE; BSU1, BRI1 SUPPRESSOR 1; BIN2, BRASSINOSTEROID INSENSITIVE 2; PP2A, PROTEIN PHOSPHATASE 2A; BZR1, BRASSINAZOLE-RESISTANT 1.
Although in current models of BR signaling phosphorylation/de-phosphorylation of transcription factors take place exclusively in the cytoplasm and the nucleus 559, a survey of the literature provides evidence that the plasma membrane could be an active site of BR signaling, from perception of the hormone to dephosphorylation of the transcription factors: (1) a significant amount of phosphorylated BZR1 located at the plasma membrane is greatly reduced upon BR treatment 48; (2) several BSKs that are plasma membrane-bound interact with BIN2, suggesting that dephosphorylation of BZR1 and BIN2 is also taking place at the plasma membrane 46,54; (3) BSK1 has been identified as an interactor of BZR1 using non-targeted proteomics, which led the authors to propose that BR-signaling components exist in the plasma membrane as a multi-protein complex 55. We show that BZR1 and BSK1 weakly interact at the plasma membrane and that coexpression of TTL3 greatly increases this association, supporting a role of the plasma membrane in BR signaling.
BR signaling mediated by TTL3 resembles that of Wnt/β catenin signaling which controls many biological processes in metazoans, including cell fate determination, cell proliferation, and stem cell maintenance 60–62. In both cases, extracellular ligands are perceived by transmembrane receptors and the signal is transduced through phosphorylation events where GSK3 type kinases phosphorylate effector proteins (either β-catenin in Wnt/β catenin signaling or BZR1/BES1 in BR signaling), resulting in their stabilization or degradation 5,60–62. Interestingly, an essential component of this so-called destruction complex involves the central scaffold protein Axin1, which, similar to TTL3, interacts with the core signaling components. In resting conditions GSK3 phosphorylates and degrades β-catenin, although upon Wnt perception the Axin complex is relocalized from the cytoplasm to the plasma membrane, where it suppresses ubiquitination of β-catenin, leading to saturation of complex by accumulation of phospho-β-catenin. As a result, newly synthesized β-catenin can accumulate in the cytosol and translocate to the nucleus, where it promotes transcription 61,62.
The basic function of scaffolding proteins is the assembly of signaling components to enhance the efficiency of the signaling cascade by increasing their local concentrations as well as the localization of the signaling reaction to a specific area of the cell. This could be particularly important in BR signal components because some of these proteins are expressed at vanishingly low levels like BSU1 and BIN2 63,64 This scaffolding function of TTL proteins might also have a role in enhancing signaling specificity by preventing spurious interactions by BR signaling components and generating BR specificity. This is important because some components of the BR pathway have been reported to participate in signaling pathways different from the BR one. For example, BAK1 and related SERK co-receptors are involved in numerous signaling pathways 25 in addition to its role in BR signaling, and BIN2 shows multiple targets that result in different signaling outcomes 65,66. Another example is BSK1, which was originally identified as a BR signaling component by proteomic studies 67 but was later found regulate also immune signaling 68. Because TTL1, TTL3, and TTL4 genes were previously reported to play a role in abiotic stress tolerance and there is an increasing evidence for the co-ordination of BR-promoted growth and abiotic stress responses 7–9, we cannot exclude that function of TTL3 (and probably other TTLs) as a scaffold of BR signaling components contribute to this cross-talk.
Our work uncovers an essential component of BR signaling and fills a gap in our understanding of signaling cascades from the plasma membrane to the nucleus in plant cells. The characterization of other possible scaffold proteins, with a function equivalent to TTLs, will be key to understand how signaling components are assembled in other signaling cascades to ensure the timely signal transduction upon perception of extracellular signals.
Supplemental Tables
List and description of primers used for cloning into pENTR. Restriction sites included in some primers are highlighted in bold and enzyme is indicated in the primer name. CACC sequence include in Fw primers to clone in pENTR/D-TOPO (Invitrogen) is underlined. STOP codon in primers sequence is highlighted in gray.
List of primers used for quantitative RT-PCR.
METHODS
Plant Material and Growth Conditions
All Arabidopsis thaliana plants used in the present study were Columbia-0 ecotype (Col-0). Arabidopsis mutants lines used in this study have been previously described: ttl1 (AT1G53300) Salk_063943; ttl2 (AT3G14950) Salk_106516; ttl3 (AT2G42580) Sail_193_B05; ttl4 (AT3G58620) Salk_026396; ttl134: ttl1 ttl3 ttl4 triple mutant 12; bak1-4 (SALK_116202) 28; serk1-1 (SALK_044330) 74 and serk1-1 bak1-4 double mutant (obtained by crossing serk1-1 with bak1-4). Transgenic lines TTL1p::GUS; TTL2p::GUS; TTL3p::GUS and TTL4p::GUS 12 were also previously described. Generation of transgenic lines TTL3-GFP 1.2 (TTL3p::TTL3g-GFP line 1.2 in ttl3 background) and TTL3-GFP 2.4 (TTL3p::TTL3g-GFP line 2.4 in ttl134 background) is described in the Generation of Transgenic Plants section.
Plant Manipulation and Growth Conditions
Arabidopsis standard handling procedures and conditions were employed to promote seed germination and growth. Seeds were surface sterilized and cold treated for three days at 4°C. Then, seeds were sowed onto half-strength Murashige-Skoog agar solidified medium (0.6% (w/v) agar for horizontal growth and 1% (w/v) for vertical growth) containing 1.5% sucrose, unless otherwise stated. Plates were placed either vertically or horizontally in a culture chamber at 22 ± 1°C, under cool white light (120 μmol photon m−2 s−1) with a long-day photoperiod (16-h light/8-h dark cycle) unless otherwise stated. When required, seedlings were transferred to soil after seven days of in vitro growth and watered every two days. In soil, plants were grown in a mixture of organic substrate and vermiculite (4:1 v/v) under controlled conditions: 23 ± 1°C °C, 16-h light/8-h dark cycle (~120 μmol photon m−2 s−1). Freshly harvested seeds were used for all the phenotypic analysis.
Plasmid Constructs
A genomic fragment spanning the 1.7 kb TTL3 promoter (TTL3p) region upstream of the start codon and the TTL3 genomic region (TTL3g) without stop codon was PCR amplified using the primers detailed in Table S1 and cloned into pCR8 ENTRY vector (Invitrogen).
The coding DNA sequence (CDS) without the stop codon of TTL3, BSK1 and BES1 (BES1-S, the canonical BES1 isoform), as well as the CDS with stop codon of wild-type BRI1 cytoplasmic domain (residues 814-1196), BRI1 cytoplasmic domain JMCT9D (BRI1cytJMCT9D residues 250-662), and TTL3 truncated version TTL3ΔN1 (residues 204-691), TTL3ΔN2 (residues 371-691), TTL3ΔN3 (residues 567-691), TTL3ΔC1 (residues 1-306) and TTL3ΔC2 (residues 1-595) was PCR amplified using the primers detailed in Table S1 and cloned into the pENTR/D-TOPO vector using the pENTR Directional TOPO cloning kit (Invitrogen). The pUNI51 (Salk Institute) cDNA clone was used as template to PCR amplify TTL3 CDS without the stop codon. Total RNA from Arabidopsis Col-0 was used to generate cDNA that was then employed as template to PCR amplify BSK1 CDS without the stop codon. The destination vector pGADT7(GW)BES1 32 was a gift from Salomé Prat (CNB-CSIC), and it was used as template to PCR amplify BES1 (BES1-S, the canonical BES1 isoform correspond to the BES1-6 transcript). The expression clone pMAC-flag-BRI1-CD-JMCT9D 70 was used, as template to PCR amplification of BRI1cytJMCT9D and it was a gift from Xiaofeng Wang (College of Horticulture Northwest, A&F University, Yangling Shaanxi).
pENTR vectors including CDS without stop codon of BRI1, BAK1, BIN2, BSU1 and BZR1, were obtained by Gateway BP-reaction (Invitrogen) using an expression clone for each gene of interest (containing attB sites) and the pDONR/Zeo vector. Expression clones, used as templates for cloning BRI1, BAK1, and BZR1 in pENTR/D-Topo by Gateway BP-reaction, were previously published 29,75 The expression clones used to clone BSU1 63 and BIN2 32 in pENTR/D-Topo by Gateway BP-reaction, were a gift from Santiago Mora Garcia (Fundación Instituto Leloir and IIBBA) and Salomé Prat (CNB-CSIC), respectively.
All the resulting pENTR clones were verified by diagnostic PCR, restriction analysis and sequencing. These pENTR clones in combination with the appropriate destination vectors (pDEST) were used to create the final Gateway-expression constructs, by LR-reaction (Invitrogen). The pETG-30A and pETG-30A vectors were provided by the European Molecular Biology Laboratory (EMBL) and were used as pDEST to generate GST and MBP N-terminus fusion proteins for GST-pull-down assays. The pGWB4, 5, 6 and 14, from the pGWBs vectors series, were provided by Tsuyoshi Nakagawa 76 (Department of Molecular and Functional Genomics, Shimane University), and were used as pDEST for the transient expression in N. Benthamiana in the Co-IP and coexpression assays (pGWB5, 6 and 14) or for generating stable transgenic Arabidopsis lines (pGWB4). The pDEST-GW-VYNE and pDEST-GW-VYCE 77 were used for BiFC assays. The Gateway destination vector pUC19(35S::GW-GFP) and pBSSK(35S::GW-HA) were used to transfect protoplast for transient expression and Co-IP assays. The pUC19(35S::GW-GFP) was provided by Jose Alonso (Department of Plant and Microbial Biology, North Carolina State University), and contains pGWB5 cassette between HindIII-SacI restriction sites in pUC19 vector backbone. The pBSSK(35S::GW-HA) was generated in this work by cloning the pGWB14 cassette between HindIII-SacI in the pBSSK vector backbone. The pGADT7(GW) and pGBKT7(GW) destination vectors were provided by Salomé Prat (CNB-CSIC) and used for yeast two-hybrid assay. All the expression clones were verified by diagnostic PCR and restriction analysis.
Generation of Transgenic Plants
Expression constructs were transformed into Agrobacterium tumefaciens strain GVG3101::pMP90 through electroporation and confirmed by diagnostic PCR. The pGWB4 harboring the TTL3p::TTL3g-GFP construct, was transformed into Arabidopsis plants by floral dip 78 to generate stable transgenic plants. TTL3p::TTL3g-GFP was transformed into both the ttl3 single mutant and the ttl134 triple mutant. T3 or T4 homozygous transgenic plants were used in this study.
Phenotypic Analysis
Venation pattern phenotype
Cotyledons (embryonic leaves) from two-week-old seedlings were cleared and observed under a light microscope to analyze vascular patterning and the percentage of cotyledons displaying each venation pattern categories is depicted in Supplementary Fig. 1. Approximately 200 cotyledons per genotype were analyzed. Representative images of each observed venation pattern categories were acquired using the Nikon AZ100 Multizoom microscope system.
For clearing cotyledons, the two-week-old seedlings were immersed sequentially in 50% ethanol for 1 hour, 99% ethanol overnight, and 50% ethanol for 1 hour, and finally transferred to ddH2O. Seedlings were mounted on slides in 50% glycerol and visualized under a light microscope or using the Nikon AZ100 Multizoom microscope system as described above.
BL Sensitivity Determined by Root Growth Inhibition
Seedling were grown vertically in long-day photoperiod for 4 or 5 days in halfstrength MS agar solidified medium supplemented with 1.5% (w/v) sucrose, and then transferred to half-strength MS agar solidified medium supplemented with 1, 5% (w/v) sucrose containing either mock (eBL solvent as control) or 100 nM eBL (PhytoTechnology Laboratories) and photographed 6 or 8 days later. The eBL (PhytoTechnology Laboratories) was added from a 5 mM stock solution freshly prepared in 80% (v/v) ethanol.
To determine the eBL sensitivity of Col-0 and mutants, the root length of 10 or 13-day-old seedlings grown vertically as described above was measured and the data were analyzed as described in “Quantification and Statistical Analysis” section.
BL Sensitivity Determined by Phosphorylation status of BES1
Seedling were grown vertically in long-day photoperiod for 7 days in halfstrength MS agar solidified medium supplemented with 1.5% (w/v) sucrose, and then transferred to half-strength MS liquid medium supplemented with 1,5% (w/v) sucrose containing 2.5 μM BRZ (TCI Europe) and grown for 3 more days. To determine the eBL sensitivity of Col-0 and ttl134, the seedlings were treated with either mock (eBL solvent as control) or 10 nM eBL (PhytoTechnology Laboratories) and frozen in liquid nitrogen 0, 30 and 60 minutes after the treatment. Total protein was extracted as described in “Extraction of Total Protein from Arabidopsis” section and analyzed by immunoblotting using an anti-BES1 antibody (dilution 1:500) (Yu et al., 2011) as described in the “Western Blot Analysis” section.
Hypocotyl elongation in dark
Freshly harvested seeds were surface sterilized and cold treated for three days at 4°C. Then, seeds were sowed individually onto half-strength Murashige-Skoog 1% (p/v) agar solidified medium containing 1.5% sucrose for vertical growth. Seedlings were grown for 4 days in long-day photoperiod, and then placed in dark condition (vertical growth in a culture chamber at 22 ± 1°C). Seedlings were photographed and hypocotyl length was measured 3 days after placing plates in dark conditions.
Total RNA Extraction and Semi-quantitative RT-PCR Analysis
Ten-day-old seedlings (10 seedlings per biological replicate) grown for five days on half-strength MS agar solidified medium were transferred to half-strength MS liquid medium supplemented with 1% (w/v) sucrose (grown for 5 extra days), treated with or without 1 μM eBL for 1 hour, were used to total RNA extraction. The eBL (PhytoTechnology Laboratories) was added from a 5 mM stock solution freshly prepared in 80% (v/v) ethanol. Plant tissue was grounded to a fine powder in liquid nitrogen. Approximated 100 mg of ground tissue per sample were homogenized in 1 mL of the commercial reagent TRIsure (Bioline), and total RNA was extracted following the manufacturer’s instructions. The RNA concentration and purity was determined spectrophotometrically (Nanodrop ND-1000 Spectrophotometer). RNA samples (10μg per sample) were DNase-treated with Turbo DNA-free DNase (Ambion) and 1 μg of RNA per sample was run on a 1% agarose gel to confirm RNA integrity. First-strand cDNA was synthesized from 1 μg of RNA by using the iScript cDNA synthesis kit (BioRad), according to the manufacturer’s instructions. cDNAs were amplified in triplicate by quantitative PCR by using SsoFast EvaGreen supermix (BioRad) and the MyiQ Thermal cycler (Bio Rad). The relative expression values were determined by using ACTINE 2 as a reference gene and plotted relative to Col-0 mock treated expression level. Primers used for quantitative RT-PCR are listed in Table S2.
Transient Expression in N. benthamiana
For transient expression in Nicotiana benthamiana, Agrobacterium tumefaciens (GV3101::pMP90) carrying the different constructs were used together with the p19 strain 79 for infiltration into 4- to 5-week-old N. benthamiana leaves at the abaxial side of the leaf lamina. After infiltration, all plants were kept in the greenhouse and analyzed 2 days later. Agrobacteria cultures were grown overnight in LB medium containing rifampicin (50 μg/mL), gentamycin (25 μg/mL) and the construct specific antibiotic. Cells were then harvested by centrifugation (15 minutes, 3000g in 50 mL falcon tubes), pellets were resuspended in agroinfiltration solution (10 mM morpholineethanesulfonic acid (MES) pH 5.6, 10 mM MgCl2, and 1 mM acetosyringone) and incubated 2 hours in dark conditions at room temperature. For double infiltration experiments, Agrobacterium strains were infiltrated at optical density at 600 (OD600) of 0.4 for the constructs and 0.2 for the p19 strain. For triple infiltration experiments, Agrobacterium strains were infiltrated at OD600 of 0.26 for the constructs and at OD600 of 0.2 for the p19 strain. An Agrobacterium strain harboring an empty vector (or GUS-HA expressing vector) was used as a negative control to equal the final optical density, in order to obtain a total OD600 of approximated 1 in all the infiltration experiments.
For eBL treatment analysis, leaves were pre-treated with 5 μM BL for 3 hours prior to samples collection. N. benthamiana leaves were infiltrated with water or 5 μM eBL (PhytoTechnology Laboratories) infiltration solution (10 μL eBL 5mM stock solution in 10 mL H2O), made from a 5 mM stock solutions freshly prepared in 80% (v/v) ethanol.
For brassinazole (BRZ) treatment experiments, the agroinfiltration solution was supplemented with either mock (BRZ solvent as control) or 5 μM BRZ (TCI Europe). After infiltration, N. benthamiana plants were kept in the greenhouse and analyzed 2 days later.
Transient Expression in Arabidopsis NahG plants
Agrobacterium tumefaciens-mediated expression in Arabidopsis NahG plants 53 was performed as described for transient expression in N. benthamiana with some modifications. Agrobacterium strains were resuspended with an equal OD600 in infiltration solution to obtain a total OD600 of 0.05 for injection into abaxial leaves side of 4 to 5-week-old Arabidopsis plants. At least 6 plants per co-infiltration mixture and 4 leaves per plant were used per experiment.
Recombinant Protein Purification and In Vitro Pull-down Assay
The coding sequences of wild-type BRI1 cytoplasmatic domain (residues 8141196), BRI1 cytoplasmatic domain JMCT9D (residues 250-662), TTL3ΔN1 (residuos 204-691) and TTL3ΔN3 (residuos 567-691) were cloned as described in Plasmid Constructs section to generate MBP-BRI1cyt, MBP-BRI1cytJMCT9D, GST-TTL3ΔN1 and GST-TTL3ΔN3 constructs. Recombinant proteins were expressed in E. coli strain BL21 (DE3) and extracted using Buffer A (140mM NaCl, 2.7mM KCl, 10mM Na2HPO4, 1.8mM KH2PO4, 1% Triton X-100, pH 8, supplemented with 1 mM PMSF, 0.2 μL/10 mL of Benzonase Nuclease (Sigma), and 1 mg/mL Lisozyme). MBP and GST fusion proteins were purified with Glutathione Sepharose 4B GST-tagged protein purification resin (GE Healthcare) or MBP binding protein coupled to agarose beads (MBP-Trap_A, Chromotek), respectively, according to the manufactures.
To investigate protein-protein interactions, the GST-tagged proteins were first capture by the glutathione agarose-coated beads and then incubated with the MBP-tagged proteins in dilution/wash buffer [50 mM Tris-HCl, pH 7.5; 150 mM NaCl; 10% glycerol; 10 mM EDTA, pH 8; 10 mM DTT; 0,5 mM PMSF; 1% (v/v) P9599 protease inhibitor cocktail (Sigma)] at 4°C during 1 hour in a end-over-end rocker. Protein-protein interaction complexes bound to the glutathione agarose-coated beads were pulled down, washed three times with the dilution/wash buffer and analyzed by western blot as described in the western blot section.
Immunoblotted GST and MBP-tagged protein were detected using an anti-GST antibody (Sigma G7781; Dilution 1:10000) and a specific anti-BRI1 antibody 71 (Dilution 1:2000) as described in the “Western Blot Analysis” section.
Protein extraction and Co-Immunoprecipitation in N. benthamiana
Protein extraction and Co-Immunoprecipitation in N. benthamiana were performed as previsouly described 80 with some modifications. Briefly, Four-week-old N. benthamiana plants were used for transient expression assays as described in Transient expression in N. benthamiana section. Leaves were grounded to fine powder in liquid nitrogen. Approximated 0,5g of grounded leaves per sample were used and total proteins were then extracted with extraction buffer [50 mM Tris-HCl, pH 7.5; 150 mM NaCl; 10% glycerol; 10 mM EDTA, pH 8; 1 mM NaF; 1 mM Na2MoO4·2H2O; 10 mM DTT; 0,5 mM PMSF; 1% (v/v) P9599 protease inhibitor cocktail (Sigma); Nonidet P-40, CAS: 903619-5 (USB Amersham life science) 0,5% (v/v) for CoIP involving transmembrane proteins BRI1 and BAK1, and 0,2% (v/v) for the rest of CoIP] added at 2 mL/g of powder using an end-over-end rocker during 30 minutes at 4°C. Samples were centrifuged 20 minutes at 4 °C and 9000 g. Supernatants (approximated 4 mg/mL protein) were filtered by gravity through Poly-Prep Chromatography Columns (#731-1550 Bio-Rad) and 100 μL were saved to analyze by western blot as input. The remaining supernatants were incubated 2 hours at 4 °C with 15 μL GFP-Trap coupled to agarose beads (Chromotek) in an end-over-end rocker. During incubation of protein samples with GFP-Trap beads the final concentration of detergent (Nonidet P-40) was adjusted to 0,2% (v/v) in all cases to avoid unspecific binding to the matrix as recommended by the manufacturer. Following incubation, the beads were collected and washed four times with the wash buffer (similar to extraction buffer but without detergent). Finally, beads were resuspended in 75 μL of 2x concentrated Laemmli Sample Buffer and heated at 60°C 30 minutes (for CoIP involving transmembrane proteins BRI1 and BAK1) or (70°C for 20 minutes (for the rest of CoIPs) to dissociate immunocomplexes from the beads. Total (input), immunoprecipitated (IP) and Co-Immunoprecipitated (CoIP) proteins were separated in a 10% SDS-PAGE gel, and analyzed as described in the Western Blot Analysis section.
Bimolecular Fluorescence Complementation (BiFC) Assays
Leaves were co-agroinfiltrated as described in the Agrobacterium-Mediated Transient Expression in Nicotiana benthamiana section with the Agrobacterium strain harboring a construct to express a given protein (Protein A) fused to the N-terminus half of the YFP (Protein A-nYFP) and the BiFC partner protein (Protein B) fused to the C-terminus half of the YFP (Protein B-cYFP), and the other way around (Protein A-cYFP and Protein B-nYFP) to test both BiFC directions. Leaves were observed under the confocal microscope two days after infiltration, as described in Confocal Imaging of Arabidopsis and Nicotiana benthamiana section.
Confocal Imaging of Arabidopsis and N. benthamiana
Arabidopsis seedlings were germinated in half-strength Murashige-Skoog agar solidified medium (1 % agar (w/v) for vertical growth) supplemented with 1.5% sucrose. For eBL treatment analysis, 4-day-old seedling were incubated in 2 mL of half-strength Murashige and Skoog medium supplemented with 1,5% (w/v) sucrose containing either mock (eBL solvent as control) or 1 μM eBL (PhytoTechnology Laboratories). For BRZ/eBL treatment analysis, seedling with three days and an half were incubated in 2 mL of half-strength Murashige and Skoog medium supplemented with 1% (w/v) sucrose, containing either mock (BRZ solvent as control) or 5 μM BRZ (TCI Europe) for 12 hours (overnight).
The next morning samples were further treated with mock or 1 μM eBL (PhytoTechnology Laboratories) for another 1 hour before being analyzed by confocal microcopy. The eBL (PhytoTechnology Laboratories) and BRZ (TCI Europe) were added from a 5 mM stock solutions freshly prepared in 80% (v/v) ethanol. For visualizations of plasma membrane, seedlings were incubated in 1 μL ddH2O containing 1 Mg/mL FM4-64 (Invitrogen Molecular Probes) prepared from a 1 mg/mL stock solution for 3-4 minutes, rinsed in ddH2O to remove the excess of stain and visualized under confocal microscopy.
For confocal imaging of Nicotiana benthamiana leaves in co-expression and BiFC experiments, GFP or YFP fluorescence of the lower epidermis of leaf was visualized with the confocal 2 days after infiltration.
Confocal imaging of Arabidopsis NahG plants was performed as described for Nicotiana benthamiana, but in this case, images are a maximum Z-projection of seven 1 μm spaced confocal planes from the cell equatorial plane to the cell surface.
All confocal images were obtained using a Leica TCS SP5 II confocal microscope equipped with a 488-nm argon laser for GFP and YFP, and a 561nm He-Ne laser for FM4-64. Leica LAS AF Lite platform and the Java-based image-processing program FIJI 81,82 were used in the processing of all microscopy images.
Stereo Microscopy of Arabidopsis Seedlings
Representative images of Arabidopsis seedlings were acquired using the Nikon Eclipse Ti basic Fluorescence Microscope system with filter for GFP. Wilde-type Col-0 Arabidopsis seedlings were used as negative control for GFP autoflorescence.
GUS Staining Assay
Four-day-old seedlings were transferred to a medium containing 0,2 μM eBL (PhytoTechnology Laboratories) during 24 hours and then stained for GUS activity. Plant tissues were immersed in histochemical GUS staining buffer (100mM NaPO4 pH7, 0.5 mM Ks[Fe(CN)a], 0.5 mM K4[Fe(CN)e], 20% Methanol, 0.3% Triton X-100 and 2 mM 5-Bromo-4-chloro-3-indoxyl-beta-D-glucuronide cyclohexylammonium (X-gluc) (Gold Biotechnology, USA)) on multi-well plates, vacuum-infiltrated (60 cm Hg) for 10 minutes three times, and then wrapped in aluminum foil and incubated at 37°C for 12 hours. Samples were then washed several times with 95% ethanol until complete tissue clarification, stored in 50% glycerol and photographed using the Nikon AZ100 Multizoom microscope system.
Protoplasts Transient Expression Assays
Protoplasts extraction and transfection was performed as previously described 83 Briefly, leaves from 5-week-old Arabidopsis Col-0 grown at 10-hour daylight photoperiod were cut to strips and digested for 3 hours in the darkness at room temperature. Protoplasts were then washed and resuspended to a concentration of 5×10⁵ protoplasts/mL before PEG-mediated transfection for 10 minutes. Twenty microliters μl of plasmid expressing GFP or 100 μl of plasmids expressing TTL3-GFP/BZR1-HA were used to transfect 2 mL protoplasts for each transfection. All the plasmids were used at a concentration of 1 μg/ul. The transfected protoplasts were incubated for 6 hours at room temperature and collected for protein extraction and immunoprecipitation, as described for N. benthamiana samples.
Yeast Two-Hybrid Assay
The Gal4-based yeast two-hybrid system (Clontech Laboratories Inc.) was used for testing the interaction between TTL3 and different components of the brassinosteroid signalling pathway. The bait and prey constructs are explained in the “Plasmid Constructs” section. The bait and prey plasmids were transformed into Saccharomyces cerevisiae strain AH109 as previously described 84 and transformants were grown on plasmid-selective media (SD/-Trp-Leu). Plates were incubated at 28 °C for 4 days and independent colonies for each bait-prey combination were resuspended in 200 μl of sterile water. 10-fold serial dilutions were made and 5 μl of each dilution were spotted onto three alternative interaction-selective medium (SD/-Trp-Leu-His+3-AT (3-amino-1, 2, 4-triazole, 2mM), SD/-Trp-Leu-Ade, and SD/-Trp-Leu-Ade+3-AT). Plates were incubated at 28 °C and photographed 3 or 7 days later.
Yeast Two-Hybrid Protein Extraction
For inmunoblot analysis, one or two independent yeast co-transformants (a and b) for each bait-prey plasmid combination were grown in 50 mL of SD/-Leu-Trp to an OD600 of 0.7-1. Cultures were centrifuged at 4.000 rpm for 3 minutes.
The resulting pellet was washed once with cold water and resuspended in 200 μl of RIPA buffer (2 mM sodium phosphate buffer pH 7, 0,2% Triton X-100, 0,02%-w/v-SDS, 0,2 mM EDTA pH 8, 10 mM ClNa) containing protease inhibitor (1 tablet/10mL, cOmplete, Mini, EDTA-free Protease Inhibitor Cocktail, Roche) Glass beads (500 μl, 425-600 um, Sigma) were added and the sample was vortexed in FastPrepTM FP120 (BIO 101) at power setting 5.5 for two 15 seconds intervals separated by 1 minute intervals on ice. Then 400 μl RIPA buffer with protease inhibitors were added and the sample was vigorously vortexed. The supernatant was recovered, and the protein concentration was determined using Bradford assays. Total protein (50 μg) was resolved on 10% polyacrylamide/SDS gels and analyzed by immunoblotting using a anti-Myc Tag (1:2000, Abgent) which is transcriptionally fused to Gal4BD, as described in the “Western Blot Analysis” section
Extraction of Total Protein from Arabidopsis
Arabidopsis tissue was grounded to fine powder in liquid nitrogen. Approximated 100 mg of grounded tissue per sample were used for total proteins extraction. Denatured protein extracts were obtained by homogenizing and incubating plant material in 200 μL of 2X Laemmli buffer [125 mM Tris-HCl pH 6.8; 4% (w/v) SDS; 20% (v/v) Glycerol; 2% (v/v) Beta-mercaptoethanol; 0, 01% (w/v); Bromophenol blue] for 5 minutes at 95°C, centrifuged (5 minutes, 20 000 g) and the total proteins from supernatant were separated in a 10% SDS-PAGE gel, and analyzed as described in the Western Blot Analysis section.
Western Blot Analysis
Proteins separated by SDS-PAGE polyacrylamide gel electrophoresis were electroblotted using Trans-blot Turbo Transfer System (BioRAD) onto polyvinylidene difluoride (PVDF) membranes (Immobilon-P; Millipore) following instructions by the manufacturer (preprogramed protocols optimized for the molecular weight of the proteins of interest). PVDF membranes, containing electroblotted proteins, were then incubated with the appropriate primary antibody followed by the appropriate secondary second peroxidase-conjugated antibody. In addition to the primary antibodies described in the previous methods section, the following primary antibodies were used for detection of epitope-tagged proteins: mouse monoclonal anti-GFP clone B-2 (1:600; Santa Cruz Biotechnology); mouse monoclonal anti-HA clone HA-7 (1:3000; Sigma-Aldrich); rabbit polyclonal anti-mCherry (1:3000 GeneTex). The secondary antibodies used in the present study were: anti-mouse IgG whole molecule-Peroxidase (1:80000; Sigma-Aldrich) and anti-rabbit IgG whole molecule-Peroxidase (1:14000 or 1:80000; Sigma-Aldrich)
Proteins and epitope-tagged proteins on immunoblots were detected by using the Clarity ECL Western Blotting Substrate or SuperSignal West Femto Maximum Sensitivity Substrate according to the manufacturer’s instructions, and images of different time exposures were acquired by using the Chemidoc XRS+System (Biorad). SDS-PAGE polyacrylamide gels and immunoblotted PVDF membranes were stained with Coomassie blue for confirming equal loading of the different samples in a given experiment.
QUANTIFICATION AND STATISTICAL ANALYSIS
Arabidopsis eFP Browser Data Analysis
Gene expression level data from hormone responses was retrieved from Arabidopsis eFP Browser (Hormone Series) web site available from the following link: http://bar.utoronto.ca/efp/cgi-bin/efpWeb.cgi 85 Data used for the analysis was obtained from 7-day-old wild-type seedlings. Differential expression was calculated by dividing the expression value of each gene in a given hormone treatment by the corresponding mock control (fold-change of hormone treatment relative to the mock). Hormone gene expression response calculation and Heatmap was obtained using Microsoft Office Excel (Microsoft). Heatmap red colors represent induction and blue colors represent repression as response to the indicated hormone.
Quantification of Fluorescent Protein Signal
For quantification of fluorescent protein signal in plasma membrane vs cytoplasm all images were analyzed using FIJI software 81,82. To measure the ratio between nuclear and cytoplasmic signals, a small area of fixed size (8 pixels) was drawn, and measurements of integrated densities were taken from representative areas within the plasma membrane and cytoplasm of each cell. To delimitate de plasma membrane area, FM4-64 was used to stain the cells. Average ratios between plasma membrane and cytoplasmic signal intensities were calculated based on measures from 3 cells per plant. n=10 plants analyzed (3 cells per plant). This experiment was repeated twice with similar results.
Additionally, for quantification of fluorescent protein signal, lines scan measurements spanning membrane and cytoplasm were carried out from images using FIJI 81,82 software, and representative plot profiles of sample measurements are presented in Figure 3I.
Statistics
Band intensity quantification of protein signal detected by western blot, integrated densities from representative areas within the plasma membrane and cytoplasm of each cell analyzed by confocal imaging, as well as Arabidopsis root and hypocotyl lengths were measured from images using FIJI 81,82 software. The data for qRT-PCR were gathered with MyiQ optical system software (Bio Rad). For statistical analysis unpaired t-test was performed using GraphPad Prism version 6.00 for Mac (GraphPad Software, La Jolla California USA, www.graphpad.com). Asterisks indicate statistical differences between mutant vs Col-0, unless otherwise specified, as determined by the unpaired t-test (* P ≤ 0.05, ** P ≤ 0.01, *** P ≤ 0.001 **** P ≤ 0.0001). Data represent mean values, error bars are SEM. In figure legends, n means number of plants for phenotypic analysis, numbers of biological replicates (3 technical replicates per biological replicate) for qRT-PCR analysis, or number of cells (3 independent measurements per performed per cell) analyzed for quantification of fluorescent protein signal in plasma membrane vs cytoplasm. The experiments were repeated at least three times with similar results.
In silico Three-Dimensional Structural Model of TTL3
The in silico protein structure prediction for TTL3 protein was built by submitting primary sequences to the I-TASSER server 69 and processed by PyMOL (Schrödinger). Intrinsically disordered regions (IDRs) were predicted using GlobPlot 2, available in the web page (http://globplot.embl.de/).
Tetratricopeptide Repeat (TPR) and thioredoxin-like (TPRX) domains were predicted using SMART/Pfam server and were previously described 12.
Author contributions
All authors designed the experiments. V.A-S., A.G-M., A.C., N.L., J.P-S., Y.L., A.E-V., D.P., J.P-R., and A.P.M. performed the experiments and analyzed the data. V.A-S., A.P.M., and M.A.B. wrote the manuscript. All authors commented on the manuscript.
Acknowledgements
This work was supported the Ministerio de Economía y Competitividad (cofinanced by the European Regional Development Fund; grants no. BIO2014-55380-R and BIO2017-82609-R to M.A.B) and by a Formación del Personal Investigador Fellowship from the Ministerio de Economía y Competitividad (FPI-BES 2015-071256 to A. G-M). A.P.M. was funded by the Shanghai Center for Plant Stress Biology (Chinese Academy of Sciences) and the Chinese 1000 Talents Program, and by grants from the Gatsby Charitable Foundation and the European Research Council (grant ‘PHOSPHinnATE’) to C.Z., while working in the C.Z. laboratory.
We thank Yanhai Yin and Michael Hothorn for generously providing the anti-BES1 and the anti-BRI1 antibodies, respectively.
We are grateful to Salomé Prat (BIN2 and BES1 expression clones), Santiago Mora Garcia (BSU expression clone), José Alonso (GFP-tagged GW vector for expression in protoplasts) and Xiaofeng Wang (pMAC-flag-BRI1-CD-JMCT9D, BRI1 phosphomimetic mutant) for providing expression clones and vectors used in the present study.
Footnotes
↵9 Lead Contact
REFERENCES
- 1.↵
- 2.↵
- 3.
- 4.↵
- 5.↵
- 6.↵
- 7.↵
- 8.
- 9.↵
- 10.↵
- 11.↵
- 12.↵
- 13.↵
- 14.↵
- 15.↵
- 16.
- 17.
- 18.↵
- 19.↵
- 20.↵
- 21.
- 22.↵
- 23.↵
- 24.↵
- 25.↵
- 26.↵
- 27.
- 28.↵
- 29.↵
- 30.↵
- 31.↵
- 32.↵
- 33.↵
- 34.↵
- 35.↵
- 36.↵
- 37.↵
- 38.↵
- 39.
- 40.↵
- 41.↵
- 42.
- 43.↵
- 44.↵
- 45.↵
- 46.↵
- 47.↵
- 48.↵
- 49.↵
- 50.↵
- 51.↵
- 52.↵
- 53.↵
- 54.↵
- 55.↵
- 56.↵
- 57.↵
- 58.↵
- 59.
- 60.↵
- 61.↵
- 62.↵
- 63.↵
- 64.↵
- 65.↵
- 66.↵
- 67.↵
- 68.↵
- 69.↵
- 70.↵
- 71.↵
- 72.↵
- 73.
- 74.↵
- 75.↵
- 76.↵
- 77.↵
- 78.↵
- 79.↵
- 80.↵
- 81.↵
- 82.↵
- 83.↵
- 84.↵
- 85.↵


