

Introductory paragraph
Cell wall glycopolymers on the surface of Gram-positive bacteria are fundamental to bacterial physiology and infection biology. These structures have also gained interest as vaccine antigens, in particular for the human pathogens Group A Streptococcus (GAS) and Streptococcus mutans. Streptococcal cell wall glycopolymers are considered to be functional homologues of wall teichoic acids but surprisingly lack the biologically-relevant and characteristic anionic charge. Here we identify gacH, a gene of unknown function in the GAS Group A Carbohydrate (GAC) biosynthetic cluster, in two independent transposon library screens for its ability to confer resistance to zinc and susceptibility to the bactericidal enzyme human group IIA secreted phospholipase A2. To understand the underlying mechanism of these phenotypes, we determined the structure of the extracellular domain of GacH and discover that it represents a new family of glycerol phosphate (GroP) transferases that is evolutionarily distinct from lipoteichoic acid synthase. Importantly, we demonstrate the presence of GroP in both the GAC and the homologous Serotype c Carbohydrate (SCC) from S. mutans, which is conferred by gacH and sccH products, respectively. NMR analysis of GAC released from cell wall by non-destructive methods reveals that approximately 30% of the GAC GlcNAc side-chains are modified by GroP at the C6 hydroxyl group. This previously unrecognized structural modification impacts host-pathogen interaction and has implications for vaccine design.

Gram-positive bacteria are surrounded by a thick cell wall that consists of a complex network of peptidoglycan with covalently attached proteins and glycopolymers. Cell wall glycopolymers comprise a large family of structurally diverse molecules, including wall teichoic acid (WTA), mycobacterial arabinogalactans and capsular polysaccharides. From these, WTA is perhaps the most widespread and certainly the best-studied molecule. This polyanionic, phosphate-rich glycopolymer is critical for functions such as cell division, antibiotic resistance, metal ion homeostasis, phage-mediated horizontal gene transfer and protection of bacteria from host defense peptides and antimicrobial enzymes 1–3. As such, these structures and their biosynthetic pathways are attractive targets for therapeutic intervention, such as antibiotic development and vaccine design. Interestingly, many streptococci lack expression of classical WTA and instead express functionally homologous glycopolymers that are characterized by the presence of L-rhamnose (Rha), but lack the anionic charge due to the apparent absence of phosphate 4. These structures, referred to as Streptococcal Rhamnose Polysaccharides (SRPs), comprise about 40-60% of the bacterial cell wall mass 5, and are historically used for serological grouping of streptococci 6. The glycopolymers of two human streptococcal pathogens, Group A Streptococcus (GAS; Streptococcus pyogenes) and Streptococcus mutans, share a characteristic [→3)a-Rha(1→2)a-Rha(1→] polyrhamnose backbone, but are distinguished based on their specific glycosyl side-chain residues, i.e. N-acetyl-β-D-glucosamine (GlcNAc) at the C3 position of Rha in GAS 7 and α-glucose (Glc) at the C2 position of Rha in S. mutans c serotype 8. These conserved glycopolymers, referred to as the Lancefield group A Carbohydrate (GAC) and Serotype c specific Carbohydrate (SCC), play significant roles in the cell physiology and pathogenesis of GAS and S. mutans, respectively. SCC-defective mutants show aberrant cell morphology and division 9, increased susceptibility to certain cell wall targeting antibiotics 10, defects in biofilm formation 11 and reduced ability to induce infective endocarditis compared to the parental strain 12. Biosynthesis of the rhamnan-backbone of GAC is essential for GAS viability 13,14. Moreover, GAS mutants deficient in the GAC GlcNAc side-chain are viable but more susceptible to innate immune clearance by neutrophils and antimicrobial agents, resulting in significant loss of virulence in animal models of GAS infection 13,15. Importantly for both pathogens, GAC and SCC have been evaluated as vaccine antigens. Indeed, immunization with GAC or SCC induces opsonophagocytic antibodies that enhance killing of GAS and S. mutans, respectively 8,16,17 In addition, GAC has proven efficacious as a vaccine antigen through active immunization in mice 16,17.
The GAC and SCC biosynthetic pathways are encoded by 12-gene clusters 4,13, herein designated as gacABCDEFGHIJKL and sccABCDEFGHMNPQ (Fig. 1a), respectively. The first seven genes in both operons are conserved in many streptococcal species and they participate in polyrhamnose backbone synthesis and transport 18. In GAS, we have demonstrated that gacI, gacJ, gacK and gacL encode the machinery to generate and add the immunodominant GlcNAc side-chain to the polyrhamnose backbone 13,19. In S. mutans, sccM and sccN are required for immunoreactivity with serotype c-specific antiserum suggesting a function for these genes in Glc side-chain attachment to the polyrhamnose backbone 20. In addition to these streptococcal species, similar gene clusters are present in a wide variety of streptococcal, lactococcal and enterococcal species, although the corresponding glycopolymer structures have not all been elucidated 4. Within this wider collection of species, one of the conserved genes present in the SRP biosynthetic clusters encodes a homolog of lipoteichoic acid (LTA) synthase (LtaS) 21–23 and LTA primase, LtaP 24,25. LtaS and LtaP are glycerol phosphate (GroP) transferases that polymerize long chains of LTA, a membrane-anchored anionic polymer consisting of a 1,2-polyglycerol-phosphate backbone linked to a glycolipid membrane anchor. The sn-glycerol-1-phosphate (sn-Gro-1-P) head group of phosphatidylglycerol functions as the GroP donor for polymer synthesis occurring on the extracellular side of the plasma membrane 26. The biological function of these LtaS/LtaP homologues in the biosynthesis of SRP is currently unknown.

(a) Schematic representation of GAC and SCC biosynthetic gene clusters. SCC gene cluster smu824-835 was renamed sccABCDEFGHMNPQ. Sequence identity (%) between homologous proteins is indicated. Sequences of GAS 5005 and S. mutans UA159 were used for comparison. (b-d) gacH is identified in Tn-seq screen for hGIIA resistance and its deletion confers resistance to hGIIA. (b) Transposon gene location in 47 hGIIA resistant mutants after exposure of Krmit mutant transposon library to lethal concentrations of hGIIA. (c) Deletion of gacH in GAS 5448 and (d) the gacH-homologous gene sccH in S. mutans increases hGIIA resistance more than 10-fold. Data represent mean +/- SD of three independent experiments. *, p < 0.05; **, p < 0.01; ***, p < 0.001.
Recently, we employed the Krmit GAS transposon mutant library 14 and identified gacI and gacH as genes that confer sensitivity of GAS to human group IIA secreted phospholipase A2 (hGIIA) (https://www.biorxiv.org/content/early/2018/02/23/269779) 27, an important bactericidal protein of the innate immune defense against Gram-positive pathogens 28. Complementary, we now present the data that gacH was the only valid hit when exposing the Krmit library to a lethal concentration of hGIIA. Using the same transposon library, gacH was also identified as a gene providing resistance to zinc toxicity. In pursuit of the underlying mechanisms for GacH-mediated hGIIA resistance and protection against zinc toxicity, we have characterized the function of GacH at the genetic, biochemical and structural level. Our study identified a previously overlooked GroP modification on both GAC and SCC, and demonstrated a function of GacH homologs in the transfer of GroP to SRP. GroP is attached to the GlcNAc side-chains of GAC at the C6 hydroxyl group as shown by NMR analysis. These new insights into the structure, biosynthesis and function of GAC and SCC justify a re-examination of the chemical structures of cell wall glycopolymers in other streptococcal species. Furthermore, the discovery of GroP modification of GAC and SCC offers the potential for future vaccine development and provides a framework for investigation of the function of this modification in bacteria.
Results
GacH is required for full hGIIA bactericidal activity against GAS and S. mutans
We previously identified gacH in a GAS transposon library screen against the bactericidal activity of hGIIA 27. Complementary to this susceptibility screen, we also exposed the Krmit GAS transposon library 14 to a lethal concentration of recombinant hGIIA to identify resistant mutants. Only 47 colonies were recovered after exposure. Sequencing identified that 43% of the recovered mutants (20 out of 47) had a transposon insertion in gacH, and 26% in M5005_Spy_1390 (12 out of 47) (Fig. 1b). M5005_Spy_1390 was also identified in the initial susceptibility screen as an artifact due to biased transposon insertions 27 and therefore not followed up further. To validate our finding for gacH, we generated a gacH deletion mutant in a GAS clinical isolate of the globally-disseminated serotype M1T1 clone 5448, creating 5448ΔgacH, and complemented the mutant with gacH on an expression plasmid, creating 5448ΔgacH:pgacH. Exposure of these strains to a concentration range of hGIIA revealed that deletion of gacH increased GAS resistance to hGIIA over 10-fold, which was restored back to wild-type (WT) in 5448ΔgacH:pgacH (Fig. 1c). The gacH-mediated hGIIA resistance was also observed in two different GAS backgrounds, 2221 (M1T1 GAS clone strain) and 5005 (clinical covS mutant isolate of M1T1 strain) (Supplementary Fig. 1), demonstrating that the effect is conserved across GAS strains of the M1T1 background and independent of CovRS status - a two-component system which regulates about 15% of the genes in GAS 29.
Since other streptococcal species possess a genetic homolog of gacH, we investigated whether the GacH-dependent hGIIA-resistance phenotype was conserved in different streptococci. To this end, we generated a deletion mutant of the gacH homolog sccH (previously known as orf7 20) in serotype c S. mutans (SMU) strain Xc, creating SMUΔsccH. Deletion of sccH rendered S. mutans completely unsusceptible to the tested hGIIA concentrations (Fig. 1d), which was restored to WT level by expression of sccH on a plasmid. However, heterologous expression of gacH in SMUΔsccH did not restore the hGIIA resistance phenotype, suggesting that the enzymes might target different substrates. Taken together, our data indicate that deletion of gacH homologs renders streptococci more resistant to the bactericidal activity of hGIIA and that GacH function is species-specific. Interestingly, lack of the GAC GlcNAc side-chain, by deletion of gacI, also increases hGIIA resistance, which is attributed to reduced cell wall penetration of hGIIA 27. These data suggest that similar to gacI, gacH might participate in a tailoring modification of GAC.
GacH and SccH provide protection from zinc toxicity. Recent evidence indicates that neutrophils deploy zinc poisoning as an antimicrobial strategy against GAS during phagocytosis 30. To resist Zn2+ toxicity, GAS expresses the zinc efflux system encoded by czcD 30. To search for additional GAS genes that confer resistance to zinc poisoning, we performed a Tn-seq screen of the GAS Krmit transposon library 14 using two Zn2+ concentrations, 10 and 20 μM, selected based on growth inhibition analysis (Supplementary Fig. 2a). Genomic DNA for Tn-seq analysis was collected after T2 and T3 passages (Supplementary Fig. 2b). In addition to the expected importance of czcD, we also observed that gacI and gacH transposon insertions were significantly reduced in the library (P-value of <0.05) after growth with 20 μM Zn2+ in both T2 and T3 passages compared to untreated controls indicating that the genes provide resistance against Zn2+ toxicity (Fig. 2a-d).

(a-d) Tn-seq volcano plots showing representation of czcD, gacH and gacI in GAS Krmit transposon library screens for Zn2+ tolerance. Log2 fold-change in fitness was plotted against adjusted P-value from Tn-seq analysis. The outline of the experiment is shown in Supplemental figure 2b. (a) 10 μM Zn2+ at T2, (b) 10 μM Zn2+ at T3, (c) 20 μM Zn2+ at T2, (d) 20 μM Zn2+ at T3. (e and f) Zn2+ sensitivity as tested in drop test assay using strains (e) 5448 WT, 5448ΔgacH and 5448ΔgacH:gacH; and (f) 5448 WT, 5448ΔgacI and 5448ΔgacI:gacI. 5448ΔczcD was included as a positive control in both panels. Strains were grown in THY to mid-exponential phase, adjusted to OD600 = 0.6, serial diluted and 5 μL spotted onto THY agar plates containing varying concentrations of Zn2+. Each drop test assay experiment was performed at least three times.
To confirm that gacI and gacH are required for GAS resistance to Zn2+, we grew 5448ΔgacH and 5448ΔgacI 13 on THY agar supplied with different concentrations of Zn2+ (Fig. 2e and 2f). The growth of both mutants was reduced in THY supplied with 1.25 mM Zn2+. Expression of full-length gacH in 5448ΔgacH, and gacI in 5448ΔgacI fully complemented the growth phenotypes of the mutants. To investigate whether this was a conserved function for gacH homologs, we extended our experiments to S. mutans. Similar to the GAS gacH deletion mutant, SMUΔsccH was more sensitive to Zn2+, in comparison to the parental strain and the phenotype can only be restored by sccH but not gacH (Supplementary Fig. 3). Hence, our results provide strong evidence that the unknown functions of GacH and SccH are important for protection of streptococci from Zn2+ toxicity.
Phylogenetic analysis of the GacH family of proteins. Taking into consideration the conserved function of GacH homologs in hGIIA activity and protection against zinc toxicity in GAS and S. mutans, we examined the distribution of the GacH family of proteins throughout the bacterial kingdom. Interestingly, with a few exceptions, GacH homologs were found predominantly in streptococcal species (Fig. 3a, Supplementary Fig. 4). In addition, we compared the evolutionary relatedness of GacH with the GroP transferase enzyme involved in biosynthesis of LTA, LtaS. LtaS is composed of an N-terminal domain with five transmembrane helices and a C-terminal extracellular catalytic domain 22–25. GacH is predicted to contain 11 transmembrane segments in its N-terminal domain, and a C-terminal extracellular domain (eGacH), that is likely to perform the enzymatic function. Based on just the extracellular domains of the proteins, GacH and LtaS-related proteins clustered into distinct clades based on phylogenetic analysis, suggesting that the proteins may fulfill different functions in bacteria (Fig. 3a).

(a) GacH homologues form a distinct clade of GroP transferases. Phylogenetic analysis by Maximum Likelihood method of the predicted extracellular domains of GacH and LtaS enzymes. A phylogenetic tree was generated of the predicted extracellular domains of 21 GacH (blue) homologues and of the predicted extracellular domains of 21 LtaS (red) homologues from the same species. The GAS and S. mutans proteins analyzed in this study are indicated in bold. The phylogenetic tree is drawn to scale as indicated by the scale bar, with branch lengths measured in the number of substitutions per site. (b) Predicted topology of GacH showing 11 transmembrane helices and structure of extracellular domain with the enzymatic active site oriented towards the cell membrane. (c) Structure of apo eGacH viewing at the active site with the Mn2+ ion shown as a violet sphere. (d) Structure of extracellular domain of S. aureus LtaS (PDB ID 2W5Q, 22) shown in the same orientation as GacH. (e) A close-up view of the active site GacH crystal structure in complex with sn-Gro-1-P. (f) Comparison of the active site of LtaS (PDB ID 2W5T, 22) with GroP in the active site.
GacH structure. To test the hypothesis that GacH is a GroP transferase, the extracellular domain of GacH (eGacH) was expressed and purified from E. coli and its crystal structures were determined in apo form and in complex with GroP (PDB IDs 5U9Z and 6DGM) at 2.0 Å and 1.49 Å, respectively (Fig. 3b-f). The apo- and GroP-containing eGacH structures belong to different crystal forms, with two molecules in the asymmetric unit. Analysis of the dimer interface and other crystal contacts revealed that the dimer interface has the largest surface of all the crystal contacts (1809 and 1894 Å2 in the two crystal forms) that scored below the stable complex formation criteria, and recombinant eGacH behaves as a monomer in solution. However, this does not exclude a possibility of a dimer formation in the context of the full-length GacH. The structures of the apo- and GroP-bound eGacH monomers are very similar with root mean square deviation of ~0.3 Å for 380 superimposed Cα atoms, as well as between the non-crystallographic copies. eGacH has an α/β core structure that is similar of the sulfatase protein family, with the closest similarity to LtaS 22,23 and LtaP 24 (Supplementary Table 1). The catalytic site of GacH contained a Mn2+ ion coordinated by residues E488, T530, D711 and H712, equivalent to residues E255, T300, D475 and H476 of S. aureus LtaS (Fig. 3e and 3f, Supplementary Fig. 5). The structure of GacH in complex with GroP revealed the position of the ligand in the active site with the phosphoryl group oriented towards the Mn2+ ion, and coordinated by residues G529, T530 and H650 (Fig. 3e). The glycerol 2- and 3-hydroxyl groups form hydrogen bonds with side-chains of residues R589, H580 and N586. The positions of GroP and coordinating residues are similar in eGacH and Staphylococcus aureus LtaS structures, for example, the glycerol moiety forms hydrogen bonds with residues H580 and R589 in GacH and equivalent residues H347 and R356 in S. aureus LtaS (Fig. 3e and 3f) 22. The structure of GacH in complex with GroP is consistent with the idea that GacH catalyzes GroP transfer to a substrate, similarly to the structurally related LtaS and LtaP proteins 22,24.
GacH homologs decorate respective SRPs with GroP. The genetic, bioinformatic and structural evidence presented in the preceding sections strongly suggest that gacH and sccH encode novel GroP transferases of unknown function in GAS and S. mutans (Supplementary Fig. 6). The presence of these genes in the GAC and SCC biosynthetic clusters implies that they may participate in polysaccharide synthesis in a previously undefined manner. To investigate the possibility that GacH and SccH function in the modification of the respective SRPs with GroP, we enzymatically released SRP from purified cell walls (free of LTA, lipids, proteins and nucleic acids) from GAS 5005, S. mutans WT, and corresponding gacH and sccH deletion strains by treatment with peptidoglycan hydrolases (as described in Methods). Subsequently, the enriched polysaccharide preparations were analyzed for glycerol and phosphate. Hydrolysis with HCl (2 N HCl, 100 °C, 1 hr) released a significant amount of glycerol from GAC and SCC isolated from WT bacterial strains (Fig. 4a, b, and Supplementary Fig. 7). Furthermore, we detected high levels of inorganic phosphate after incubation of these acid-treated samples with alkaline phosphatase (Fig. 4a, b). Of note, the treatment of intact GAC and SCC with alkaline phosphatase alone did not release detectable levels of phosphate (Supplementary Fig. 7), indicating that the phosphoryl moiety is present as a phosphodiester, presumably as GroP. In contrast to WT GAC and SCC, the SRPs isolated from the gacH and sccH mutants (5005ΔgacH and SMUΔsccH, respectively) contained a significantly reduced amount of GroP (Fig. 4a, b). Genomic complementation of 5005ΔgacH phenotype by expression of gacH on the mutant chromosome restored the WT levels of GroP in GAC (Fig. 4a). Similarly, complementation of SMUΔsccH with plasmid-expressed sccH restored GroP incorporation of the mutant to the level of the parental strain (Fig. 4b). In contrast but in accordance with our functional data, expression of gacH did not restore the GroP levels in SCC of SMUΔsccH (Fig. 4b). Importantly, analysis of the glycosyl composition of cell walls purified from the GAS and S. mutans strains demonstrated that the absence of GacH and SccH did not affect the Rha/GlcNAc and Rha/Glc ratios, respectively (Supplementary Fig. 8). Since the differences in GroP content for 5005ΔgacH and SMUΔsccH were not due to changes in the composition of GAC and SCC, our results are consistent with a role for SccH and GacH in modification of SRPs by GroP.

GacH and SccH modify SRPs with sn-Gro-1-P.
(a-d) Analysis of glycerol and phosphate content in GAC and SCC isolated from (a) the GAS 5005 WT, AgacH and complemented strain, (b) S. mutans WT, ΔsccH, and ΔsccH complemented with sccH or gacH gene, and (c and d) GAS 5005 mutants ΔgacL and ΔgacI that are devoid of GlcNAc side-chain. GAC and SCC were released from bacterial cell wall materials by PlyC and mutanolysin digestion, respectively, and subjected to acid hydrolysis as described in Methods. Phosphate was released from these samples by digestion with alkaline phosphatase and measured using the malachite green assay. Glycerol was measured using a colorimetric glycerol assay kit. The concentration of phosphate and glycerol is presented relative to the WT strain. Data are the mean ± standard deviation of three independent replicates. *, p < 0.05; **, p < 0.01 significance according to the Student’s t-test. (e) DEAE-Sephacel elution profile of GAC. Isolated GAC was loaded onto an 18 mL column of DEAE-Sephacel. The column was eluted with a 100 ml gradient of NaCl (0-1 M). Fractions were analyzed for carbohydrate by anthrone assay (Ȣ) and phosphate by malachite green assay (O). (f-h) Identification of the enantiomeric form of GroP associated with GAC. (f) The GroP isomers were recovered from GAC following alkaline hydrolysis and separated by liquid chromatography as outlined in Methods. The elution positions corresponding to standard Gro-2-P and sn-Gro-1-P/sn-Gro-3-P are indicated by the arrows. LC-MS analysis identifies two extracted ion chromatogram peaks for the molecular GroP ion m/z 171.004 [M-H]-, which eluted at (g) 9.48 and (h) 9.89 min. Based on the accurate mass and retention times, these two peaks were assigned as Gro-2-P and sn-Gro-1-P/sn-Gro-3-P respectively by comparison with authentic chemical standards.
Both structurally and functionally, we can only complement the SMUΔsccH mutant by expression of the native sccH, suggesting that the site of GroP attachment to SRPs might involve the species-specific side-chains (Glc vs. GlcNAc), rather than the identical polyrhamnose backbone. Consistent with this hypothesis, the glycerol and phosphate contents in the GAC isolated from two GlcNAc-deficient mutants, 5005ΔgacL and 5005ΔgacI 19 were significantly reduced, similarly to 5005ΔgacH (Fig. 4c, d).
To prepare bacterial polysaccharide for more detailed analysis, GAC was released from isolated cell walls by peptidoglycan hydrolase treatment and partially purified by a combination of size exclusion chromatography (SEC) and ion-exchange chromatography (Fig. 4e, Supplementary Fig. 9a). Fractions from both chromatography analyses were assayed for Rha and total phosphate. The majority of the rhamnose-and phosphate-containing material was bound to the ion-exchange column and eluted as a single coincident peak (Fig. 4e). Similarly prepared GAC purified from 5005ΔgacH did not bind to the column (Supplementary Fig. 9b). Interestingly, the GAC from 5005ΔgacH does appear to contain a small amount of phosphate, although its phosphate content is much lower than the GAC isolated from the WT strain. This data directly supports the conclusion that GAC is modified by the addition of GroP units donated by GacH.
Identification of the enantiomeric form of GroP associated with GAC. LTA is formed by the sequential addition of sn-Gro-1-P groups transferred by LtaS from the head group of the membrane lipid phosphatidylglycerol 31,32. In contrast, the Bacillus subtilis poly-GroP backbone of WTA consists of sn-Gro-3-P repeats that are synthesized on the cytoplasmic surface of the plasma membrane from CDP-glycerol before export to the periplasm and attachment to the cell wall 1. Since GacH and SccH are LtaS homologs, it is possible that the incorporated GroP is derived from phosphatidylglycerol yielding sn-Gro-1-P residues. To test this hypothesis, GroP was liberated from purified GAC by alkaline hydrolysis and separated from the polysaccharide by SEC. As explained in detail by Kennedy et al 33 for GroP-modified membrane oligosaccharides from E. coli, if GAC is modified by sn-Gro-1-P, alkaline hydrolysis of the phosphodiester bond should result in the formation of two cyclic intermediate compounds, Gro-1-cyclic phosphate and Gro-2-cyclic phosphate which further break up to a mixture of sn-Gro-1-P and Gro-2-P 33. If GAC is modified by sn-Gro-3-P, alkaline hydrolysis would yield a mixture of sn-Gro-3-P and Gro-2-P 33, whereas a phosphodiester of Gro-2-P would give a mixture of all three phosphates 33. Following alkaline hydrolysis the bulk of the carbohydrate still elutes in the void volume of the SEC column (Supplementary Fig. 10). However, the phosphate-containing fractions corresponding to the hydrolyzed GroP now elute in the inclusion volume (Supplementary Fig. 10). The enantiomeric composition of the GroP preparation was determined using a combination of LC-MS and an enzymatic method (see below). LC-MS revealed the presence of two GroP isomers, of approximately equal proportions, with LC retention times and major high molecular weight ions consistent with standard sn-Gro-1-P and Gro-2-P (Fig. 4f-4h, Supplementary Fig. 11). To resolve whether sn-Gro-3-P or sn-Gro-1-P is the substituent, the recovered GroP was characterized further by enzymatic analysis using a commercially available sn-Gro-3-P assay kit. Under reaction conditions in which 500 pmol of sn-Gro-3-P produced a robust enzymatic signal, incubation with either 500 pmol of sn-Gro-1-P or 500 pmol of the unknown Gro-P, recovered following alkaline hydrolysis, resulted in negligible activity (Supplementary Fig. 12). When a mixture containing 500 pmol of standard sn-Gro-3-P, and an equal amount of either sn-Gro-1-P or the unknown mixture of Gro-P isomers were tested, 85.8% and 90.0% of the activity detected with 500 pmol sn-Gro-3-P, alone, was found, demonstrating that the negative result using the unknown mixture, by itself, was not due to the presence of an unknown inhibitory compound in the GroP preparation. Taken together, our results indicate that GacH decorates GAC with sn-Gro-1-P, which is most probably derived from phosphatidylglycerol.
NMR spectroscopy confirms the presence of GroP at the C6 hydroxyl group of GlcNAc side-chains. To unambiguously prove the incorporation of GroP in GAC, the polysaccharide isolated from WT GAS as described above was employed for NMR analysis (Fig. 5 a-g). 1H and 13C NMR spectra of GAC confirmed the presence of Rha and GlcNAc in a 1.7:1 ratio as determined by a chemical analysis of its sugar components. Although the material was heterogeneous, initial analysis revealed that it would be possible to analyze the purified GAC at different levels of detail. The major component identifiable at the highest level of intensity in a multiplicity-edited 1H,13C-HSQC NMR spectrum (Supplementary Fig. 13), acquired by non-uniform sampling at the 25% level of coverage facilitating enhanced resolution to resolve spectral overlap 34, revealed the 1H NMR chemical shifts in agreement with the following structure →3)-α-L-Rhap-(1→2)[β-D-GlcpNAc-(1→3)]-α-L-Rhap-(1→· as its repeating unit; 7 the 1JHc-based correlations facilitated identification of the resonances of the proton-carrying 13C nuclei.

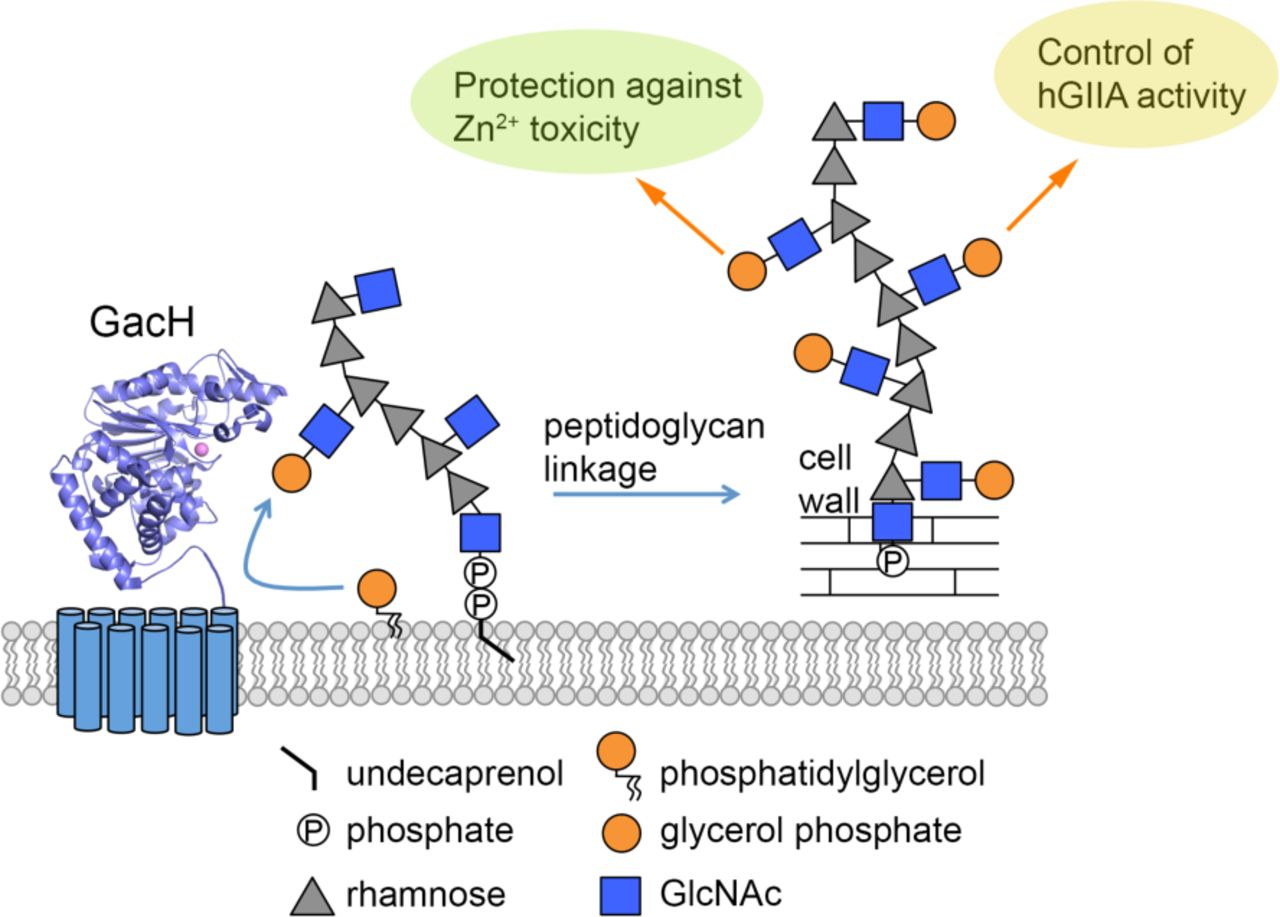
(a-g) Selected regions of NMR spectra of GAC. (a) Multiplicity-edited 1H,13C-HSQC in which methylene groups have opposite phase and are shown in red color, (b) 1H,13C-HSQC-TOCSY with an isotropic mixing time of 120 ms, (c) 1H,13C-HMBC with a mixing time of 90 ms, (d) 1H,31P-hetero-TOCSY with an isotropic mixing time of 80 ms, (e) 1H,13C-plane, (f) 13C, 31P-plane using a nominal nJCP value of 5 Hz, and (g) 1H, 31P-plane of a through-bond 3D 1H,13C,13P NMR experiment. Cross-peaks are annotated as GIII corresponding to the GlcNAc residue, GIII’ being the GroP-substituted GlcNAc residue and Gro as the glycerol residue. NMR chemical shifts of 1H (horizontal axis), 13C (left axis) and 31P (right axis and panel f) are given in ppm. (h) Schematic structure of the GAC repeating unit consisting of →3)-α-L-Rhap-(1→ 2)[β-d- GlcpNAc6P(S)Gro-(1→3)]-α-L-Rhap-(1→. (i) The mechanism and the roles of GroP cell wall modification in streptococci.
An array of 2D NMR experiments including 1H,1H-TOCSY, 1H,1H-NOESY, 1H,13C-HMBC and 1H,13C-HSQC-TOCSY led to the 1H and 13C NMR chemical shift assignments (Supplementary Table 2) and confirmed the structure of the trisaccharide repeating unit. A number of additional cross-peaks were visible at the second intensity level of the 1H,13C-HSQC spectrum, particularly in the spectral region of methylene groups, e.g. hydroxymethyl groups of hexopyranses 35. Besides the resonances from the hydroxymethyl group of the β-D-GlcpNAc residue at δΜ 3.78 and 3.94 correlated with a signal at δc 61.8, three more 13C signals together with corresponding 1H resonances were present at δc 63.1, 65.4 and 67.3 (Fig. 5a), readily identified from the multiplicity-editing applied in the experiment. In the 13C NMR spectrum two resonances at δc 67.3 and 71.6 were conspicuous in that they were split by 5.6 and 7.6 Hz, respectively. A 13C resonance observed as a doublet in this manner suggests scalar coupling to the NMR active nucleus 31P 36 and acquisition of a 31P NMR spectrum on GAC showed a prominent resonance at δρ 1.2. The 1H,1H-TOCSY NMR spectrum at the second intensity level revealed chemical shift displacements in the region for anomeric resonances (Supplementary Fig. 14), and in the 1H,13C-HSQC-TOCSY spectrum two correlations from the anomeric proton resonance at δΜ ~4.76 were observed to δc 61.8 (C6 in β-D-GlcpNAc) and to δc 65.4 (Figure 5b). Employing a 1H,31P-HMBC experiment revealed correlations to protons of the latter 13C at δΜ 4.10 and 4.19 as well as to δΜ 3.91 and 3.96, the 13C nucleus of which resonates at δc 67.3 (Figure 5c). Moreover, a 1H,31P-hetero-TOCSY experiment showed in addition to the just described proton correlations further correlations to δΜ 3.59, 3.64 and 3.70 (Figure 5d). Using the arsenal of 2D NMR experiments the resonances at the second level deviating from the parent structure were assigned (Supplementary Table 2). Thus, the GAC is partially substituted by a GroP residue at O6 of the side-chain β-D-GlcpNAc residue; based on integration of the cross-peaks for the anomeric resonances in the 1H,13C-HSQC NMR spectrum, the GAC preparation carries GroP groups to ~30 % of the GlcNAc residues. To validate the above results, a triple-resonance 1H,13C,31P NMR experiment based on through-bond 1JHC as well as 2JCP and 3JCP correlations 37 was carried out. The 3D NMR experiment revealed the 1H NMR chemical shifts of H5’ and the two H6’ protons of the β-D-GlcpNAc residue, as well as the two H1 ’ protons and H2’ of the Gro residue all correlated to 13C nuclei (Fig. 5e). The 13C NMR chemical shifts of C5’ and C6’ of the β-D-GlcpNAc residue as well as C1’ and C2’ of the Gro residue all correlated to the 31P nucleus (Fig. 5f), and the above protons correlated to the 31P nucleus (Fig. 5g). Taking into considerations the GacH-mediated mechanism of GAC modification by GroP as well as the biochemical experiments carried out herein, the substituent at O6 of β-D-GlcpNAc is an sn-Gro-1-P group (Fig. 5h).
Discussion
In Gram-positive bacteria, the common theme of most peptidoglycan-attached carbohydrate-based polymers is the presence of negatively charged groups in the repeating units 3. For example, canonical and non-canonical WTAs and Group B carbohydrate of Streptococcus agalactiae contain phosphodiester groups in the repeating units, peptidoglycan of B. subtilis grown in phosphate limiting conditions is decorated by a teichuronic acid containing glucuronic acid, and secondary cell wall carbohydrates of Bacillus anthracis are modified by pyruvyl groups 2–4. In bacteria lacking WTA such as the human pathogens GAS and S. mutans, it has been proposed that other polyanionic structures, such as LTA, fulfill similar functions during the bacterial cell cycle 4,38. Previous detailed studies using immunochemical methods, composition and linkage analyses and NMR methods deduced chemical structures of peptidoglycan-attached SRPs from both streptococcal species 7,8,39–43 but none mentioned the presence of anionic groups in these structures, except one overlooked study in which the presence of glycerol and phosphate in GAC has been detected 44. However, it was proposed that this GroP is part of the phosphodiester linkage connecting GAC to the N-acetylmuramic acid of peptidoglycan 44. Similarly, a number of reports identified substantial concentrations of phosphate in SRPs isolated from Streptococcus sanguis, Streptococcus gallolyticus, Streptococcus dysgalactiae, Streptococcus sobrinus serotype d and S. mutans serotype f 31,43,45,46. These phosphate-rich polymers were either disregarded as contamination with LTA 31, or further analyzed using 1H NMR or 13C NMR methods 7,8,41–43,47,48 that do not directly detect phosphoryl moieties in polysaccharides. With our report, we unambiguously confirm that SRPs of GAS and S. mutans are in fact polyanionic glycopolymers through decoration of their respective glycan side-chains with GroP (Figure 5i).
We identified and structurally characterized a new family member of GroP transferase enzyme, GacH, which is required for GAC modification by GroP in GAS. GacH homologs are present in the SRP biosynthetic loci of many streptococci suggesting that a large proportion of streptococcal species produce SRPs where glycosyl side-chains are decorated with GroP similar to our observations for S. mutans. GacH is predicted to be an extracellular protein anchored in the cytoplasmic membrane. It belongs to the alkaline phosphatase superfamily of which two GroP transferases involved in LTA synthesis, LtaS and LtaP, have been biochemically and structurally characterized to date 22–25. LtaS and LtaP are membrane proteins that use the membrane lipid phosphatidylglycerol as the GroP donor for the transfer reaction 49,50. Our structural analysis of GacH in complex with GroP indicates that the enzyme uses the catalytic T530 residue to participate in the formation of a GroP-enzyme intermediate. This corresponds to the structure of LtaS, where the GroP molecule is complexed in the active site in which a threonine residue functions as a nucleophile in phosphatidylglycerol hydrolysis 22–24. The observation that the GroP in GAC is the sn-Gro-1-P enantiomer, strongly suggests that GacH uses phosphatidylglycerol as its donor substrate, similar to LtaS (Figure 5i). Thus our data propose a catalytic mechanism in which GacH binds phosphatidylglycerol and T530 functions as a catalytic nucleophile to attack the GroP head group and cleave the phosphodiester bond. Diacylglycerol is released, leaving a covalent GroP-T530 intermediate. Next, the C6 hydroxyl group of the GAC GlcNAc target is deprotonated and then attacks the GroP-T530 enzyme, forming the GroP-GlcNAc product and returning the enzyme to the apo state.
In Gram-positive bacteria, the tailoring modification of WTA and LTA with D-alanine provides resistance against antibiotics, cationic antimicrobial peptides and small bactericidal enzymes including hGIIA, and promotes Mg2+ ion scavenging 1–3. It has been assumed that incorporation of positively charged D-alanine into teichoic acids decrease negative bacterial surface charge resulting in reduced initial binding of cationic antimicrobial peptides to the bacterial surface due to ionic repulsion 51,52. Our study demonstrates that addition of the negatively charged GroP group to SRPs protects streptococci from zinc toxicity but also renders bacteria more sensitive to hGIIA activity. A large body of published evidence indicates that phagocytic cells utilize Zn2+ intoxication to suppress the intracellular survival of bacteria 53. The mechanism of microbial susceptibility to zinc toxicity is mediated by extracellular competition of Zn2+ for Mn2+ transport and thereby mediating toxicity by impairing Mn2+ acquisition 54. Accordingly, the phenotypes of our mutants deficient in the GroP modifications and the GlcNAc side-chains could be explained either by “trapping” of Zn2+ in the WT cell wall as a consequence of zinc binding to negatively-charged GroP, or the increased Mn2+-binding capacity of GroP-modified bacterial cell wall which has been proposed to act as the conduit for the trafficking of mono-and divalent cations to the membrane 2.
Charge-dependent mechanisms are likely also underlying the increased hGIIA susceptibility of GAS and S. mutans expressing the GroP-modified SRPs. hGIIA is a highly cationic enzyme that catalyzes the hydrolysis of bacterial phosphatidylglycerol 55–57, ultimately leading to bacterial death. It has been suggested that traversal of this bactericidal enzyme across the Gram-positive cell wall to reach the plasma membrane is charge dependent because the absence of positively-charged D-alanine modifications in LTA and WTA severely compromises S. aureus survival when challenged with hGIIA 57,58. This phenotype was attributed to increased binding of hGIIA to the cell surface or modified permeability of the cell envelope. Similarly, the GacH/SccH-dependent GroP modifications on SRPs are required for hGIIA to exert its bactericidal effect against GAS and S. mutans, respectively. We have previously demonstrated that loss of the GlcNAc GAC side-chain strongly hampers trafficking of hGIIA through the GAS cell wall, with a minor contribution of reduced hGIIA binding to the cell surface 27. Since GroP-modifications were also lost in the GlcNAc side-chain deficient mutant, 5448ΔgacI, described in this study, we now assume that the mechanisms of the hGIIA-dependent phenotype are similar in the gacI and gacH mutants.
Another very important aspect of our study is the identification of a novel, potentially antigenic, epitope on the surface of streptococcal bacteria. GAS is a major human pathogen, and is associated with numerous diseases ranging from minor skin and throat infections such as impetigo and pharyngitis to life-threatening invasive diseases such as scarlet fever, streptococcal toxic syndrome and rapidly progressing deep-tissue infections, necrotizing fasciitis (i.e. the “flesh eating disease”), cellulitis and erysipelas 59. GAS infections are also responsible for post-infectious autoimmune syndrome, rheumatic fever (RF) and its sequelae, rheumatic heart disease (RHD) 59. Invasive GAS infections are difficult to treat with antibiotics and a GAS vaccine is urgently needed to combat this neglected disease. GAC is an attractive candidate for GAS vaccine due to its conserved expression in all GAS serotypes and the absence of the constitutive component of GAC, Rha, in humans 16,17. However, it has been proposed that the GAC GlcNAc side-chain can elicit the cross-reactive antibodies relevant to the pathogenesis of RF and RHD 60–62. Moreover, persistence of anti-GAC and anti-GlcNAc antibodies is a marker of poor prognosis in RHD 61,63. These clinical associations and the lack of understanding of the pathogenesis of GAS post-infectious RHD have hampered progress in the development of GAC-based vaccines against GAS. However, the GAC GlcNAc decorated with GroP might be a feasible candidate for GAS vaccine development because modified GlcNAc represents a unique epitope, that is absent from human tissues. Thus, our study has implications for design of a safe and effective vaccine against this important human pathogen for which a vaccine is not yet available. Finally, our work provides a framework for structure-function investigations of cell wall modifications in streptococci.
Methods
Bacterial strains, growth conditions and media
All plasmids, strains and primers used in this study are listed in Supplementary Tables 3 and 4. Streptococcal strains used in this study were the M1-serotype GAS strains, 5448 14, 2221 64 and 5005 64, and c serotype S. mutans Xc 65. GAS and S. mutans strains were grown in Todd-Hewitt broth supplemented with 1% yeast extract (THY) without aeration at 37 °C. S. mutans plates were grown with 5% CO2. For hGIIA-mediated killing experiments S. mutans strains were grown in Todd-Hewitt broth without yeast extract and with 5% CO2. E. coli strains were grown in Lysogeny Broth (LB) medium or on LB agar plates at 37 °C. When required, antibiotics were included at the following concentrations: ampicillin at 100 μg/mL for E. coli; streptomycin at 100 μg/mL for E. coli; erythromycin (Erm) at 500 μg/mL for E. coli and 5 μg/mL for GAS and S. mutans; chloramphenicol (CAT) at 10 μg/mL for E. coli and 2 μg/mL for GAS and S. mutans; spectinomycin at 200 μg/mL for E. coli, 100 μg/mL for GAS and 500 μg/mL for S. mutans.
To identify GAS genes providing resistance against zinc toxicity, we used chemically defined medium based on the formulation of RPMI 1640 medium 66, which mirrors the amino acid composition of the van de Rijn and Kessler formulation 67. This RPMI 1640 (without glucose) (Gibco) is supplemented with nucleobases guanine, adenine and uracil at a concentration of 25 μg/mL each, as well as D-glucose at a final concentration of 0.5% w/v and HEPES at 50 mM. Necessary vitamins for GAS growth are provided by 100X BME Vitamins (Sigma B6891). The final solution (mRPMI) is pH 7.4 and capable of supporting GAS growth without additional supplements.
Genetic manipulations
DNA techniques: Plasmids were transformed into GAS and S. mutans by electroporation or natural transformation as described previously 9,68. Chromosomal DNA was purified from GAS and S. mutans as described 69. All constructs were confirmed by sequencing analysis (Eurofins MWG Operon and Macrogen).
Genetic manipulation of GAS 5005 and 2221: For construction of the 5005ΔgacH and 2221ΔgacH strains, 5005 chromosomal DNA was used as a template for amplification of two DNA fragments using two primers pairs: 5005-f/gacHdel-r and gacHdel-f/5005-r. Primer gacHdel-f is complementary to primer gacHdel-r. The two gel-purified PCR products containing complementary ends were mixed and amplified using a PCR overlap method 70 with primer pair 5005-f/5005-r to create the deletion of gacH. The PCR product was digested with BamHI and XhoI and ligated into BamHI/SalI-digested plasmid pBBL740. The integrational plasmid pBBL740 does not have a replication origin that is functional in GAS, so the plasmid can be maintained only by integrating into the GAS chromosome through homologous recombination. The plasmid was designated pBBL740ΔgacH. The resulting plasmid was transformed into 5005 and 2221, and CAT resistant colonies were selected on THY agar plates. Five randomly selected colonies, that had the first crossover, were grown in liquid THY without CAT for ≥5 serial passages. Several potential double crossover mutants were selected as previously described 71. The deletion in each mutant was confirmed by PCR sequencing of the loci.
To construct the plasmid for in cis complementation of the 5005ΔgacH mutant, 5005 chromosomal DNA was used as a template for amplification of a wild-type copy of gacH using the primer pair 5005-f/5005-r. The PCR products were digested with BamHI and XhoI, and cloned in pBBL740 previously digested with the respective enzymes. The plasmid was designated pBBL740gacH. The plasmid was transformed into the 5005ΔgacH strain, and CAT resistant colonies were selected on THY agar plates. Double crossover mutants were selected as described above. Selected mutants were confirmed by PCR sequencing, yielding strain 5005ΔgacH:gacH.
Genetic manipulation of GAS 5448: For construction of the 5448ΔgacH strains, GAS 5448 chromosomal DNA was used to amplify up and downstream regions flanking gacH using the following primer pairs: 5448-f/5448CAT-r and 5448CAT-f/5448-r. Primers 5448CAT-f and 5448CAT-r contain 25 bp extensions complementary to the CAT resistance cassette. Up- and downstream were fused to the CAT cassette using 5448-f/5448-r, digested with XhoI and HindIII and ligated into XhoI/HindIII-digested plasmid pHY304, yielding plasmid pHY304ΔgacH. After transformation in electrocompetent GAS 5448, transformed colonies were selected in THY containing Erm at 30 °C. After confirmation by PCR, transformed colonies were shifted to the non-permissive temperature of 37 °C to allow plasmid integration. Serial passage at 30 °C in the absence of antibiotic enabled occurrence of double cross-over events, yielding 5448ΔgacH, which were identified by screening for Erm sensitivity and CAT resistance. Deletion of gacH was confirmed by PCR.
To complement 5448ΔgacH, we created an expression plasmid pgacH_erm. GacH was amplified from GAS 5448 chromosomal DNA using primer pair gacH-EcoRI-f/gacH-BglII-r, digested using EcoRI/BglII, and ligated into EcoRI/BglII-digested pDCerm. pgacH_erm was transformed into the electrocompetent 5448ΔgacH and selected for Erm resistance on THY agar plates. Transformation was confirmed by PCR, yielding strain 5448ΔgacH:pgacH.
Genetic manipulation of S. mutans Xc. For construction of the sccH deletion mutant (SMUΔsccH), S. mutans Xc chromosomal DNA was used to amplify up and downstream regions flanking using the following primer pairs: sccH-f/sccH-erm-r and sccH-erm-f /sccH-r. Primers sccH-erm-f and sccH-erm-r contain 25 bp extensions complementary to the Erm resistance cassette. Up and downstream PCR fragments were mixed with the Erm cassette and amplified as a single PCR fragment using primer pair sccH-f/sccH-r. The sccH knockout construct was transformed into S. mutans as described previously 9. Erm resistant single colonies were picked and checked for deletion of sccH and integration of Erm cassette by PCR using primer pair: sccH-c-f/sccH-c-r, resulting in SMUΔsccH. For complementation, sccH and gacH were amplified from S. mutans Xc and GAS 5448 chromosomal DNA, respectively, using primer pairs sccH-EcoRI-f/sccH-BglII-r and gacH-EcoRI-f/gacH-BglII-r. The PCR products were digested with EcoRI/BglII, and ligated into EcoRI/BglII-digested pDC123 vector, yielding psccH and pgacH_cm, respectively. The plasmids were transformed into SMUΔsccH as described 9. CAT resistant single colonies were picked and checked for presence of psccH or pgacH_cm by PCR, yielding strains SMUΔsccH.psccH and SMUΔsccH.pgacH, respectively.
Construction of the plasmids for E. coli expression of gacH: To create a vector for expression of extracellular domain of GacH, the gene was amplified from 5005 chromosomal DNA using the primer pair gacH-NcoI-f and gacH-XhoI-r. The PCR product was digested with NcoI and XhoI, and ligated into NcoI/XhoI-digested pET-NT vector. The resultant plasmid, pETGacH, contained gacH fused at the N-terminus with a His-tag followed by a TEV protease recognition site.
Protein expression and purification
For expression and purification of eGacH, E. coli Rosetta (DE3) cells carrying the respective plasmid were grown to an OD600 of 0.4-0.6 and induced with 0.25 mM isopropyl β-D-1-thiogalactopyranoside (IPTG) at 18 °C for approximately 16 hrs. The cells were lysed in 20 mM Tris-HCl pH 7.5, 300 mM NaCl with two passes through a microfluidizer cell disrupter. The soluble fractions were purified by Ni-NTA chromatography with washes of 20 mM Tris-HCl pH 7.5, 300 mM NaCl and 20 mM Tris-HCl pH 7.5, 300 mM NaCl, 10 mM imidazole, and elution with 20 mM Tris-HCl pH 7.5, 300 mM NaCl, 250 mM imidazole. The eluate was dialyzed into 20 mM Tris-HCl pH 7.5, 300 mM NaCl in the presence of TEV protease (1 mg per 20 mg of protein). The dialyzed sample was reapplied to a Ni-NTA column equilibrated in 20 mM Tris-HCl pH 7.5, 300 mM NaCl to remove the cleaved His-tag and any uncleaved protein from the sample. eGacH was further purified by size exclusion chromatography (SEC) on a Superdex 200 column in 20 mM HEPES pH 7.5, 100 mM NaCl, with monitoring for protein elution at 280 nm. Fractions collected during elution from the column were analyzed for purity by SDS-PAGE and concentrated to approximately 10 mg/mL.
For expression of seleno-methionine labeled eGacH, E. coli Rosetta (DE3) carrying eGacH was grown in LB at 37 °C until an optical density at 600 nm of approximately 0.5 was obtained. The bacteria were centrifuged and resuspended in M9 minimal media supplemented with seleno-methionine. After a significant increase in optical density, protein expression was induced with 0.25 mM IPTG, and the cultures were grown at 16 °C for approximately 16 hrs. Seleno-methionine labeled eGacH was purified as described above.
Crystallization, data collection and structure solution
eGacH crystallization conditions were initially screened using the JCSG Suites I—IV screens (Qiagen) at a protein concentration of 9 mg/mL by hanging drop vapor diffusion method. Crystals of Se-Met-substituted eGacH were grown in 0.1 M HEPES pH 7.5, 10% PEG8000, 8% ethylene glycol. Crystals were transferred into crystallization solution supplemented with 20% ethylene glycol and flash frozen in liquid nitrogen. The data were collected at APS 22-ID at a wavelength of 0.9793 Å. Crystals of GroP●eGacH complex were obtained using crystallization solution containing 0.2 M calcium acetate, 0.1 M MES pH 6.0, 20% PEG8000. sn-glycerol-1-phosphate (Sigma Aldrich) was mixed with eGacH at 10 mM prior to crystallization. Initial crystals of GroP●eGacH complex belonged to the same crystal form as apo GacH, however, crystals of different morphology grew epitaxially after several days. These crystals displayed better diffraction and were used for structure determination of GroP●eGacH complex. Crystals were cryoprotected in crystallization solution supplemented with 10 mM sn-glycerol-1-phosphate and 20% ethylene glycol and vitrified in liquid nitrogen. The data were collected at SSRL BL9-2 at a wavelength of 0.97946 Å.
All data were processed and scaled using XDS and XSCALE 72. The structure of eGacH was solved by Se single-wavelength anomalous diffraction method. Se atoms positions were determined using HySS module in PHENIX 73,74. The structure was solved using AutoSol wizard in PHENIX 75. The model was completed using Coot 76 and refined using phenix.refine 77. The final structure has two eGacH molecules in the asymmetric unit containing residues 444-822.
The structure of GroP●eGacH complex was solved by molecular replacement using Phaser 78 and the dimer of apo eGacH as a search model. The model was adjusted using Coot and refined using phenix.refine. Difference electron density corresponding to GroP molecules was readily identified after refinement. GroP molecules were modeled using Coot. The geometric restraints for GroP were generated using Grade Web Server (http://grade.globalphasing.org) (Global Phasing). The last several rounds of refinement were performed using 19 translation/libration/screw (TLS) groups, which were identified by PHENIX 79.
The structures were validated using Coot, MolProbity 80 and wwPDB Validation Service (https://validate.wwpdb.org) 81. Statistics for data collection, refinement, and model quality are listed in Supplementary Table 5. The structure factors and coordinates were deposited to the Protein Data Bank with accession codes 5U9Z (apo eGacH) and 6DGM (GroP●eGacH complex). Structure figures were generated using PyMOL v1.8.0.3 82.
Isolation of cell wall
Cell wall was isolated from exponential phase cultures by the SDS-boiling procedure as described for S. pneumoniae 83. Purified cell wall samples were lyophilized and used for carbohydrate composition analysis, phosphate and glycerol assays. Cell wall isolated from GAS 5005 was used for purification of GAC for sn-glycerol-1-phosphate identification and NMR analysis.
GAC purification
GAC was released from the cell wall by sequential digestion with mutanolysin (Sigma Aldrich) and recombinant PlyC amidase 19, and partially purified by a combination of SEC and ion-exchange chromatography. Mutanolysin digests contained 5 mg/mL of cell wall suspension in 0.1 M sodium acetate, pH 5.5, 2 mM CaCl2 and 5 U/mL mutanolysin. Following overnight incubation at 37 °C, soluble polysaccharide was separated from the cell wall by centrifugation at 13,000 × g, 10 min. Acetone (−20 °C) was added to a final concentration of 80% and the polysaccharide was allowed to precipitate overnight at −20 °C. The precipitate was sedimented (5,000 × g, 20 min), dried briefly under nitrogen gas and redissolved in 0.1 M Tris-Cl, pH 7.4 PlyC (50 μg/mL) was added to the GAC sample and the reaction was incubated overnight at 37 °C. Following PlyC digestion, GAC was recovered by acetone precipitation, as described above, redissolved in a small volume of 0.2 N acetic acid and chromatographed on a 25 mL column of BioGel P10 equilibrated in 0.2 N acetic acid. Fractions (1.5 mL) were collected and monitored for carbohydrate by the anthrone assay. Fractions containing GAC (eluting near the void volume of the column) were combined, concentrated by spin column centrifugation (3,000 MW cutoff filter) and desalted by several rounds of dilution with water and centrifugation. After desalting, GAC was loaded onto an 18 mL column of DEAE-Sephacel. The column was eluted with a 100 mL gradient of NaCl (0-1 M). Fractions were analyzed for carbohydrate by the anthrone assay and phosphate by the malachite green assay following digestion with 70% perchloric acid (see below). Fractions containing peaks of carbohydrate were combined, concentrated by spin column (3,000 MW cut off) and lyophilized.
Anthrone assay
Total carbohydrate content was determined by a minor modification of the anthrone procedure. Reactions containing 0.08 mL of aqueous sample and water were prepared in Safe-Lock 1.5 mL Eppendorf Tubes. Anthrone reagent (0.2% anthrone, by weight, dissolved in concentrated H2SO4) was rapidly added, mixed thoroughly, capped tightly and heated to 100 °C, 10 min. The samples were cooled in water (room temperature) and the absorbance at 580 nm was recorded. GAC concentration was estimated using an L-Rha standard curve.
Phosphate assay
Approximately 1.5 mg of cell wall material isolated from GAS was dissolved in 400 μL H2O and 8 μg/mL PlyC, and incubated at 37 °C, rotating for approximately 16 hrs. Additional PlyC was added and incubated for a further 4-6 hrs. To liberate SCC from S. mutans cell wall, 1.5 mg of cell wall material isolated from S. mutans were incubated 24 h with 1.5 U/mL mutanolysin in 400 μL of 0.1 M sodium acetate, pH 5.5, 2 mM CaCl2. The samples were incubated at 100 °C for 20 min and centrifuged for 5 min at maximum speed in a table top centrifuge. The supernatant was transferred to a new micro-centrifuge tube and incubated with 2 N HCl at 100 °C for 2 hrs. The samples were neutralized with NaOH, in the presence of 62.5 mM HEPES pH 7.5. To 100 μL of acid hydrolyzed sample, 2 μL of 1 U/μL alkaline phosphatase (Thermo Fisher) and 10 μL 10 x alkaline phosphatase buffer was added and incubated at 37 °C, rotating, overnight. Released phosphate was measured using the Pi ColorLock Gold kit (Innova Biosciences), according to the manufacturer’s protocol.
During GAC purification on BioGel P10 and DEAE-Sephacel total phosphate content was determined by the malachite green method following digestion with perchloric acid. Fractions containing 10 to 80 μL were heated to 110 °C with 40 μL 70% perchloric acid (Fisher Scientific) in 13 × 100 borosilicate disposable culture tubes for 1 h. The reactions were diluted to 160 μL with water and 100 μL was transferred to a flat-bottom 96-well culture plate. Malachite Green reagent (0.2 mL) was added and the absorbance at 620 nm was read after 10 min at room temperature. Malachite Green reagent contained 1 vol 4.2% ammonium molybdate tetrahydrate (by weight) in 4 M HCl, 3 vol 0.045% malachite green (by weight) in water and 0.01% Tween 20.
Glycerol assay
Samples for glycerol measurement were prepared as described for the phosphate assay but were not digested with alkaline phosphatase. Instead glycerol concentration was measured using the Glycerol Colorimetric assay kit (Cayman Chemical) according to the manufacturer’s protocol.
Carbohydrate composition analysis
Carbohydrate composition analysis was performed at the Complex Carbohydrate Research Center (Athens, GA) by combined gas chromatography/mass spectrometry (GC/MS) of the per-O-trimethylsilyl derivatives of the monosaccharide methyl glycosides produced from the sample by acidic methanolysis as described previously 84.
Identification of the stereochemistry of the GroP moiety of GAC
The stereochemistry of the GroP moiety attached to GAC was determined by a chemo-enzymatic method following release of GroP by alkaline hydrolysis as described by Kennedy et al. 33 using the Amplite™ Fluorimetric sn-Glycerol-3-Phosphate (Gro-3-P) Assay Kit (AAT Bioquest, Sunnyvale, CA). GAC was released from cell wall by sequential digestion with mutanolysin hydrolase and PlyC amidase, and partially purified by SEC on BioGel P10 and ion exchange chromatography on DEAE-Sephacel, as described above. GroP was liberated from the GAC by alkaline hydrolysis (0.5 M NaOH, 100 °C, 1 h), neutralized with acetic acid and recovered from the inclusion volume following SEC on BioGel P10. Column fractions containing GroP were identified by HPLC/mass spectrometry (LC-MS) and fractions containing GroP were combined, concentrated by rotary evaporation (30 °C, under reduced pressure) and desalted on BioGel P2. Column fractions containing GroP were combined, lyophilized and analyzed with the Amplite™ Fluorimetric Gro-3-P Assay Kit based on the production of hydrogen peroxide in the Gro-3-P oxidase-mediated enzyme coupled reaction. Reactions were conducted at room temperature for 10 to 20 min in solid black 96 well plates in a total volume of 0.1 ml. Excitation was at 540 nm and fluorescence at 590 nm was measured.
The fractions containing GroP were analyzed by LC-MS using a Q Exactive mass spectrometer and an Ultimate 3000 ultra high performance liquid chromatography system (Thermo Fisher Scientific). Chromatographic separation was achieved using a silica-based SeQuant ZIC-pHILIC columns (2.1 mm × 150 mm, 5 μm, Merck, Germany) with elution buffers consisting of (A) 20 mM (NH4)2CO3 with 0.1% NH4OH in H2O and (B) acetonitrile. The column temperature was maintained at 40 °C, and the flow rate was set to 150 μL/min. Mass spectrometric detection was performed by electrospray ionization in negative ionization mode with source voltage maintained at 3.0 kV. The capillary temperature, sheath gas flow and auxiliary gas flow were set at 275 °C, 40 arb and 15 arb units, respectively. Full-scan MS spectra (mass range m/z 75 to 1000) were acquired with resolution R = 70,000 and AGC target 1e6.
Identification of hGIIA-resistant GAS transposon mutants
The GAS M1T1 5448 Krmit transposon mutant library 14 was grown to mid-log phase (OD600 = 0.4). 1 × 10⁵ CFU were subjected to 27.5 μg/mL recombinant hGIIA 85 in triplicate and incubated for 1 h at 37 °C. Samples were plated on THY agar plates supplemented with kanamycin. The position of the transposon insertion of resistant colonies was determined as described previously 86.
hGIIA susceptibility assay
hGIIA susceptibility experiments were performed as described previously 27. In short, mid-log suspensions (OD600 = 0.4), of GAS and S. mutans were diluted 1,000 times in HEPES solution (20 mM HEPES, 2 mM Ca2+, 1% BSA [pH 7.4]) and 10 μL was added to sterile round-bottom 96 well plates in triplicates. Recombinant hGIIA was serially diluted in HEPES solution and 10 μL aliquots were added to bacteria-containing wells. Samples were incubated for 2 hrs at 37 °C (for GAS without CO2, for S. mutans with 5% CO2), PBS was added and samples were 10-fold serially diluted for quantification on agar plates. Survival rate was calculated as Survival (% of inoculum) = (counted CFU * 100) / CFU count of original.
Determination of selective metal concentrations
The Zn2+ sensitive gene deletion mutant 5448ΔczcD 30 was used to find the target concentration of Zn2+. Briefly, colonies of strains 5448 WT and 5448ΔczcD were scraped from THY agar plates and resuspended in PBS. After washing in PBS, the strains were adjusted to OD600 =1. These cultures were used to inoculate freshly prepared mRPMI containing varying concentrations of Zn2+ to starting OD600 = 0.05 in a 96-well plate. Growth at 37 °C was monitored at OD595 every 15 min using the BMG Fluostar plate reader.
Tn-seq library screen for Zn2+ sensitivity
The 5448 Krmit Tn-seq library at T0 generation 14 was thawed, inoculated into 150 mL prewarmed THY broth containing 300 μg/mL kanamycin and grown at 37 °C for 6 hrs. After 6 hrs growth, the culture (T1) was centrifuged at 4,000 × g for 15 min at 4 °C and the pellet resuspended in 32.5 mL saline. Freshly prepared mRPMI or mRPMI containing 10 μM or 20 μM Zn2+ was inoculated with 500 μL culture into 39.5 mL media, creating a 1:20 fold inoculation.
These T2 cultures were then grown at 37 °C for exactly 6 hrs, at which point 2 mL of these cultures were inoculated again into 38 mL of freshly prepared mRPMI alone or mRPMI containing 10 μM or 20 μM Zn2+. The remaining 38 mL of T2 culture was harvested by centrifugation at 4,000 × g for 10 min at 4 °C and pellets stored at −20 °C for later DNA extraction. Cultures were grown for a further 6 hrs, at which point T3 cultures were harvested by centrifugation at 4,000 × g for 10 min at 4 °C and pellets stored at −20 °C.
Tn-seq Krmit transposon insertion tags were prepared from the cell pellets as previously described 15,87. Briefly, genomic DNA was prepared using the MasterPure complete DNA and RNA purification kit (Epicentre) and treated with MmeI and the calf intestinal phosphatase (NEB) before ligation to 12 distinct Tn-seq adapters for sample multiplexing during massively parallel sequencing 15,87. Insertion tags were produced through a 22-cycle PCR 15 using the ligation mixtures and primers oKrmitTNseq2 and AdapterPCR 15,87. After quality control with the Bioanalyzer instrument (Agilent), the libraries of Krmit insertion tags were sequenced (50-nt single end reads) on an Illumina HiSeq 1500 in the Institute for Bioscience and Biotechnology Research (IBBR) Sequencing Core at the University of Maryland, College Park. Tn-seq read datasets were analyzed (quality, filtering, trimming, alignment, visualization) as previously described 15,87 using the M1T1 5448 genome as reference for read alignments. The ratios of mutant abundance comparing the output to input mutant pools were calculated as a fold change for each GAS gene using the DEseq2 and EdgeR pipelines 87–89. Illumina sequencing reads from the Tn-seq analysis were deposited in the NCBI Sequence Read Archive (SRA) under the accession number SRP150081.
Drop test assays
Strains 5448 WT, 5448ΔgacI, 5448ΔgacI:gacI, 5448ΔgacH, 5448ΔgacH:pgacH, S. mutans WT, SMUΔsccH, SMUΔsccH:psccH and SMUΔsccH:pgacH were grown in THY to mid-exponential growth phase, adjusted to OD600 = 0.6 and serial diluted. 5 μL were spotted onto THY agar plates containing varying concentrations of Zn2+ (ZnSO4·7H2O). Plates were incubated at 37 °C overnight and photographed. Drop tests are representative of biological replicates performed on at least 3 separate occasions.
NMR spectroscopy
The NMR spectra were recorded on a Bruker AVANCE III 700 MHz equipped with a 5 mm TCI Z-Gradient Cryoprobe (1H/13C/15N) and dual receivers and a Bruker AVANCE II 600 MHz spectrometer equipped with a 5 mm TXI inverse Z-Gradient 1H/D-31P/13C. The 1H and 13C NMR chemical shift assignments of the polysaccharide material were carried out in D2O solution (99.96 %) at 323.2 K unless otherwise stated. Chemical shifts are reported in ppm using internal sodium 3-trimethylsilyl-(2,2,3,3-2H4)-propanoate (TSP, δH 0.00 ppm), external 1,4-dioxane in D2O (δC 67.40 ppm) and 2 % H3PO4 in D2O (δP 0.00 ppm) as reference. The 1H,1H-TOCSY experiments (dipsi2ph) were recorded with mixing times of 10, 30, 60, 90 and 120 ms. The 1H,1H-NOESY experiments 90 were collected with mixing times of 100 and 200 ms. A uniform and non-uniform sampling (50 and 25 % NUS) were used for the multiplicity-edited 1H,13C-HSQC experiments 91 employing an echo/antiecho-TPPI gradient selection with and without decoupling during the acquisition. The 2D 1H,13C-HSQC-TOCSY were acquired using MLEV17 for homonuclear Hartman-Hahn mixing, an echo/antiecho-TPPI gradient selection with decoupling during acquisition and mixing times of 20, 40, 80 and 120 ms. The 2D 1H,31P-Hetero-TOCSY experiments 92 were collected using a DIPSI2 sequence with mixing times of 10, 20, 30, 50 and 80 ms. The 2D 1H,31P-HMBC experiments were recorded using an echo/antiecho gradient selection and mixing times of 25, 50 and 90 ms. The 3D 1H,13C,31 37 P spectra were obtained using echo/antiecho gradient selection and constant time in t2 with a nominal value of nJCP of 5 Hz and without multiplicity selection. The spectra were processed and analyzed using TopSpin 4.0.1 software (Bruker BioSpin).
Bioinformatics analysis
The TOPCONS (http://topcons.net/) 93 web server was employed to predict trans-membrane regions of GacH. Homology detection and structure prediction were performed by the HHpred server (https://toolkit.tuebingen.mpg.de/#/tools/hhpred) 94. To construct the GacH phylogenetic tree the homologs of full-length GacH (M5005_Spy_0609) were retrieved using blastp with an E-value cutoff of 1e-70. In addition, sequences were filtered based on a minimal identity of 33%, similarity of 73%, and having 11 predicted transmembrane helixes. Of all species expressing gacH homologues, ltaS homologues were retrieved using blastp and GAS ltaS (M5005_Spy_0622) as reference. As representatives of the LtaS and LtaP clades, five sequences of Listeria were selected that express both enzymes 24. All protein sequences were aligned using MUSCLE 95. The phylogenetic tree was build using MEGA6 96 and the Maximum Likelihood method based on the JTT matrix-based model 96. For the phylogenetic tree with the extracellular domains of GacH and LtaS homologues, extracellular domains were predicted using http://www.cbs.dtu.dk/services/TMHMM/.
Statistical analysis
Unless otherwise indicated, statistical analysis was carried out on pooled data from at least three independent biological repeats. Quantitative data was analyzed using the paired Student’s t-test. A 2-way ANOVA with Bonferroni multiple comparison test was used to compare multiple groups. A p-value equal to or less that 0.05 was considered statistically significant.
Author contributions
AR, PD, YLB, KSM, AGM, AJM, GL, MJW, JSR, KVK, GW, NMvS and NK designed the experiments. RJE, VPvH, AR, AT, JSR, KVK, GW and NK performed functional and biochemical experiments. KVK carried out X-ray crystallography and structure analysis. AR and GW performed NMR studies. PD and AJM performed MS analysis. VPvH and NK constructed plasmids and isolated mutants. RJE, VPvH, AR, PD, YLB, NES, ATB, KSM, AGM, AJM, MJW, JSR, KVK, GW, NMvS and NK analyzed the data. NMvS and NK wrote the manuscript with contributions from all authors. All authors reviewed the results and approved the final version of the manuscript.
Acknowledgements
This work was supported by the Center of Biomedical Research Excellence (COBRE) Pilot Grant (to NK, KVK and JSR) supported by NIH grant P30GM110787 from the National Institute of General Medical Sciences (NIGMS), VIDI grant 91713303 from the Netherlands Organization for Scientific Research (NWO) (to NMvS and VPvH), the Swedish Research Council (no. 20134859 and 2017-03703) and The Knut and Alice Wallenberg Foundation (to GW), NIH grant P30GM110787 from the NIGMS and NIH grant 1S10OD021753 (to AJM), the National Health and Medical Research Council of Australia (to MJW), grants from CNRS, ANR (MNaims ANR-17-CE17-0012-01) and FRM (SPF20150934219) (to GL), NIH grant AI047928 from the National Institute of Allergy and Infectious Diseases (NIAID) (to KSM and YLB) and NIH grant AI094773 (to NES and ATB).
Carbohydrate composition analysis at the Complex Carbohydrate Research Center was supported by the Chemical Sciences, Geosciences and Biosciences Division, Office of Basic Energy Sciences, U.S. Department of Energy grant (DE-FG02-93ER20097) to Parastoo Azadi. Use of the Advanced Photon Source was supported by the U. S. Department of Energy, Office of Science, Office of Basic Energy Sciences, under Contract No. W-31-109-Eng-38 and NIH grants S10_RR25528 and S10_RR028976. Use of the Stanford Synchrotron Radiation Lightsource, SLAC National Accelerator Laboratory, is supported by the U.S. Department of Energy, Office of Science, Office of Basic Energy Sciences under Contract No. DE-AC02-76SF00515. The SSRL Structural Molecular Biology Program is supported by the DOE Office of Biological and Environmental Research, and by the NIH, NIGMS including P41GM103393. The contents of this publication are solely the responsibility of the authors and do not necessarily represent the official views of NIGMS or NIH.
References
- 1.↵
- 2.↵
- 3.↵
- 4.↵
- 5.↵
- 6.↵
- 7.↵
- 8.↵
- 9.↵
- 10.↵
- 11.↵
- 12.↵
- 13.↵
- 14.↵
- 15.↵
- 16.↵
- 17.↵
- 18.↵
- 19.↵
- 20.↵
- 21.↵
- 22.↵
- 23.↵
- 24.↵
- 25.↵
- 26.↵
- 27.↵
- 28.↵
- 29.↵
- 30.↵
- 31.↵
- 32.↵
- 33.↵
- 34.↵
- 35.↵
- 36.↵
- 37.↵
- 38.↵
- 39.↵
- 40.
- 41.↵
- 42.
- 43.↵
- 44.↵
- 45.↵
- 46.↵
- 47.↵
- 48.↵
- 49.↵
- 50.↵
- 51.↵
- 52.↵
- 53.↵
- 54.↵
- 55.↵
- 56.
- 57.↵
- 58.↵
- 59.↵
- 60.↵
- 61.↵
- 62.↵
- 63.↵
- 64.↵
- 65.↵
- 66.↵
- 67.↵
- 68.↵
- 69.↵
- 70.↵
- 71.↵
- 72.↵
- 73.↵
- 74.↵
- 75.↵
- 76.↵
- 77.↵
- 78.↵
- 79.↵
- 80.↵
- 81.↵
- 82.↵
- 83.↵
- 84.↵
- 85.↵
- 86.↵
- 87.↵
- 88.
- 89.↵
- 90.↵
- 91.↵
- 92.↵
- 93.↵
- 94.↵
- 95.↵
- 96.↵


