

Abstract
Daily light-dark cycles (LD) drive dynamic regulation of plant and algal transcriptomes via photoreceptor pathways and 24-hour, circadian rhythms. Diel regulation of protein levels and modifications has been less studied. Ostreococcus tauri, the smallest free-living eukaryote, provides a minimal model proteome for the green lineage. Here, we compare transcriptome data under LD to the algal proteome and phosphoproteome, assayed using shotgun mass-spectrometry. Under 10% of 855 quantified proteins were rhythmic but two-thirds of 860 phosphoproteins showed rhythmic modification(s). Most rhythmic proteins peaked in the daytime. Model simulations showed that light-stimulated protein synthesis largely accounts for this distribution of protein peaks. Prompted by apparently dark-stable proteins, we sampled during prolonged dark adaptation, where stable RNAs and very limited change to the proteome suggested a quiescent, cellular “dark state”. In LD, acid-directed and proline-directed protein phosphorylation sites were regulated in antiphase. Strikingly, 39% of rhythmic phospho-sites reached peak levels just before dawn. This anticipatory phosphorylation is distinct from light-responsive translation but consistent with plant phosphoprotein profiles, suggesting that a clock-regulated phospho-dawn prepares green cells for daytime functions.
Introduction
Light-sensing responses are critical for organisms of the green lineage. Their many light responses [1] may be triggered directly and rapidly by light-sensitive photoreceptor proteins or the photosynthetic, light-harvesting complexes, indirectly and more slowly by the biochemical outputs from photosynthesis such as sugars, or by anticipating the predictable light-dark transitions using the 24-hour, circadian clock [2, 3]. Light-regulated gene expression for synthesis of new proteins and protein phosphorylation occur on intermediate but differing timescales.
Protein synthesis is among the costliest macromolecular processes [4, 5]. Most proteins are accordingly stable, with an average half-life >6 days in the model plant Arabidopsis thaliana [6]. Phosphorylation of an existing protein is inexpensive in comparison, occurs rapidly and may then alter protein activity through conformational change or intermolecular recognition [7]. A set of protein kinase families, along with functions such as cell cycle control, are conserved among eukaryotes [8]. ~1000 protein kinases shape the phosphoproteome in Arabidopsis [9] including several in plastids [10], compared to 518 in human [11].
The daily light-dark (LD) cycle spans the characteristic timescales of these molecular processes. Transcriptome studies have demonstrated that over 50% of Arabidopsis RNAs can be rhythmic under LD conditions [12–14] and almost the whole transcriptome of the marine unicellular alga Ostreococcus tauri [15]. Substantial contributions from light signalling [16], sugar responses [13] and the circadian clock [17] [18] have been integrated into a genome-scale, linear model of diel Arabidopsis RNA profiles [19], with more detailed models of specific pathways [20].
The extent and mechanisms of protein and phosphoprotein regulation under LD have been less studied [21]. Protein synthesis is light-regulated by several mechanisms [22–26]. Protein phosphorylation is most directly light-regulated by the kinase activity of some photoreceptor proteins [27, 28], though light also affects the broader phosphoproteome [29–31]. Under LD cycles, studies of two, opposing sampling times confirmed regulation of up to 50% of RNA levels in Arabidopsis but less than 1.5% changing proteins [32, 33]. However, 9% of proteins were altered by day length in Arabidopsis on a timescale of weeks [34] and in mouse liver, circadian regulation affected 6% of proteins and 25% of phosphopeptides under constant darkness [35, 36], indicating that broader regulation is possible. In particular, the casein kinases (CK1, CK2) and Glycogen Synthase Kinase 3 (GSK3), affect the circadian timing of all organisms suitably studied [37], though not all have been tested in the green lineage [21]. These kinases have central positions in the yeast kinase-target network [38] and are highly conserved [8], in contrast to photoreceptor proteins or circadian transcription factors [39] [40].
Here, we compare the prevalence of proteomic and phosphoproteomic regulation under LD in O. tauri, as a model for the green lineage [39]. Selection pressure to reduce cell size to 1-2µm [41] likely underlies its small, 13Mbp genome [42]. Its 7699 protein-coding genes nonetheless include 133 protein kinases that represent the core families for eukaryotic signalling [8] and a minimal set of Arabidopsis clock gene homologues [43–46]. CK1 and CK2 modulate circadian timing in the light, with widespread effects on the algal phosphoproteome [47] [48, 49]. A non-transcriptional, 24-hour oscillator of unknown mechanism was also revealed, when transcription stops in prolonged darkness [50–53]. Our data reveal a widespread effect of light-regulated protein synthesis, along with dark regulation of algal-specific proteins, diel control of conserved, cell cycle phospho-regulators, and anticipatory regulation of the broader phosphoproteome before dawn.
Results and Discussion
We measured the protein phosphorylation landscape of O. tauri at six timepoints across a 12 h light/12 h dark cycle (LD), quantifying the proteome and phosphoproteome of quintuplicate biological samples (Fig. 1a) in 30, label-free, liquid chromatography–mass spectrometric (LC-MS) assays. Dawn samples (zeitgeber time 0, ZT0) were harvested just before lights-on, and samples at ZT12 before lights-off, to detect biological regulation that anticipated these transitions. After removing a technical outlier (Expanded View Fig. 1), 855 proteins were quantified with 2 or more peptides (EVTable S1). Phosphopeptides were merged into phosphopeptide motifs (PMs) that differed only in phosphorylation [54], ignoring other modifications. 1472 phosphopeptide motifs were quantified, from 860 proteins (EVTable S2). Serine and threonine residues were modified most; only 1% of PMs included phosphotyrosine. The quantified proteins and phosphoproteins each represent ~11% of the total O. tauri proteome (Fig. 1b). 29 out of 61 proteins encoded on the chloroplast genome [55] were quantified, with 6 PMs. 3 out of 43 mitochondrial-encoded proteins were quantified with no PMs, consistent with other studies [56]. Over 340 of the PMs have not been previously reported [8].
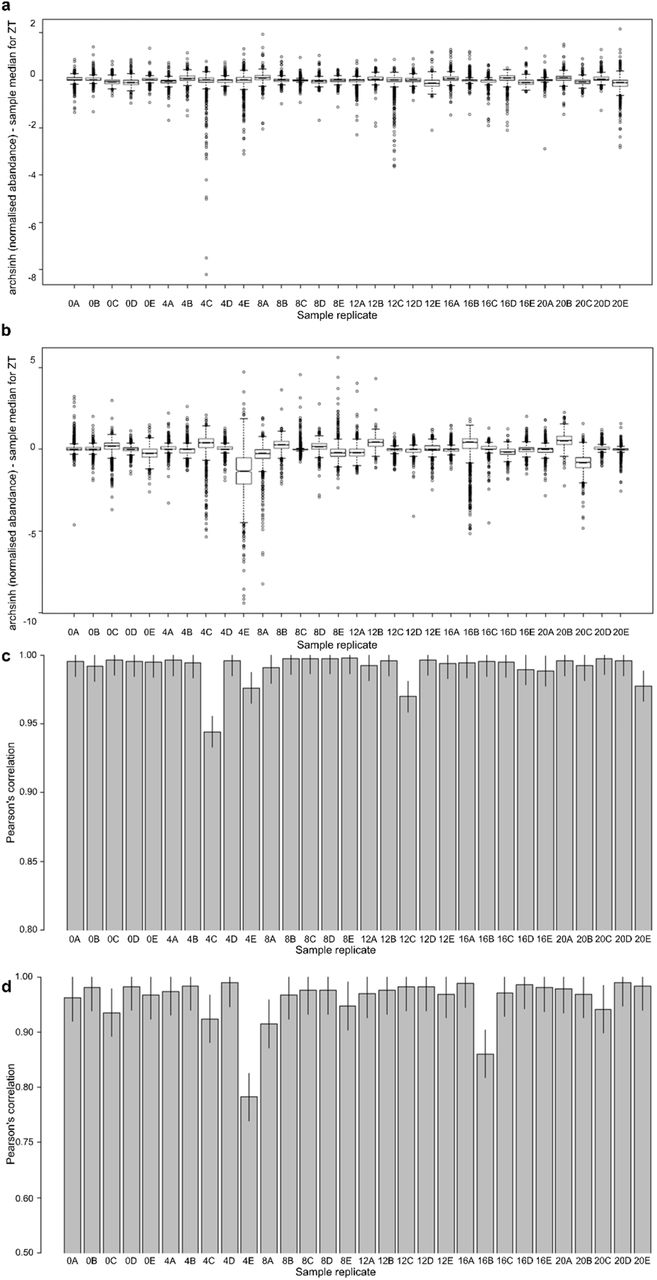
Pearson’s correlation for (a) proteins and (b) phosphopeptide motifs and sample replicate r2 respective to median abundance at a ZT for (c) proteins and (d) phosphopeptide motifs. Note differing scales in (a,b), (c,d).
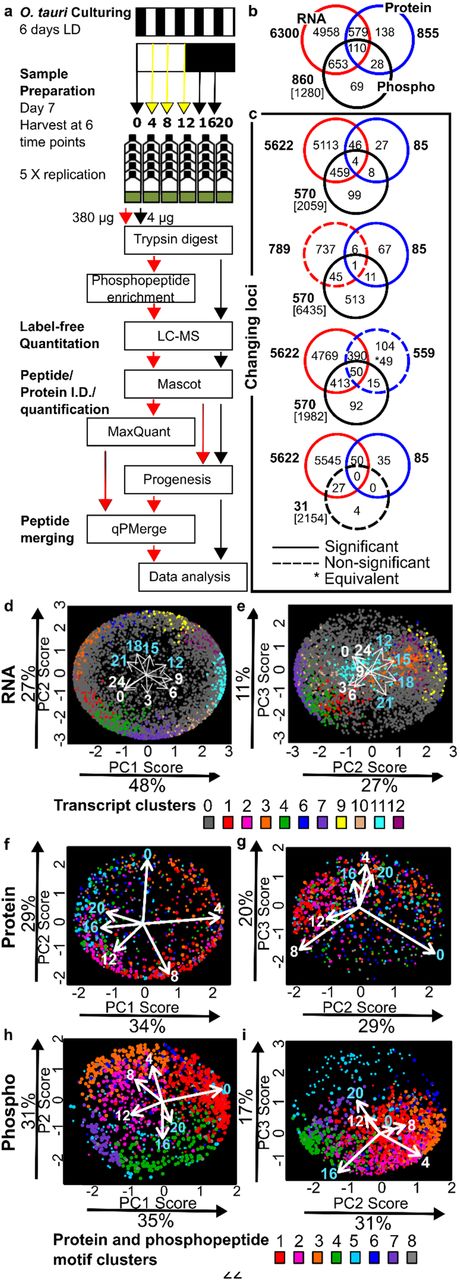
(a) Workflow for proteomics in O. tauri under LD. Overlap in (b) detected and quantified gene loci, (c) significantly changing (solid circles) or not significantly-changing (dashed circles) loci for transcripts [15], proteins and PMs; genomic loci excluded (square brackets). (d-i) Bi-plots of PCA for (d, e) transcript, (f, g) protein and (h, i) phosphoprofiles. Proportion of the variance for each PC is indicated. Dot locations show the weighting of each RNA/protein/PM in each PC; colours show the assigned cluster (as in Fig. 3g, 3h).
Diel rhythmicity of the transcriptome, proteome and phosphoproteome
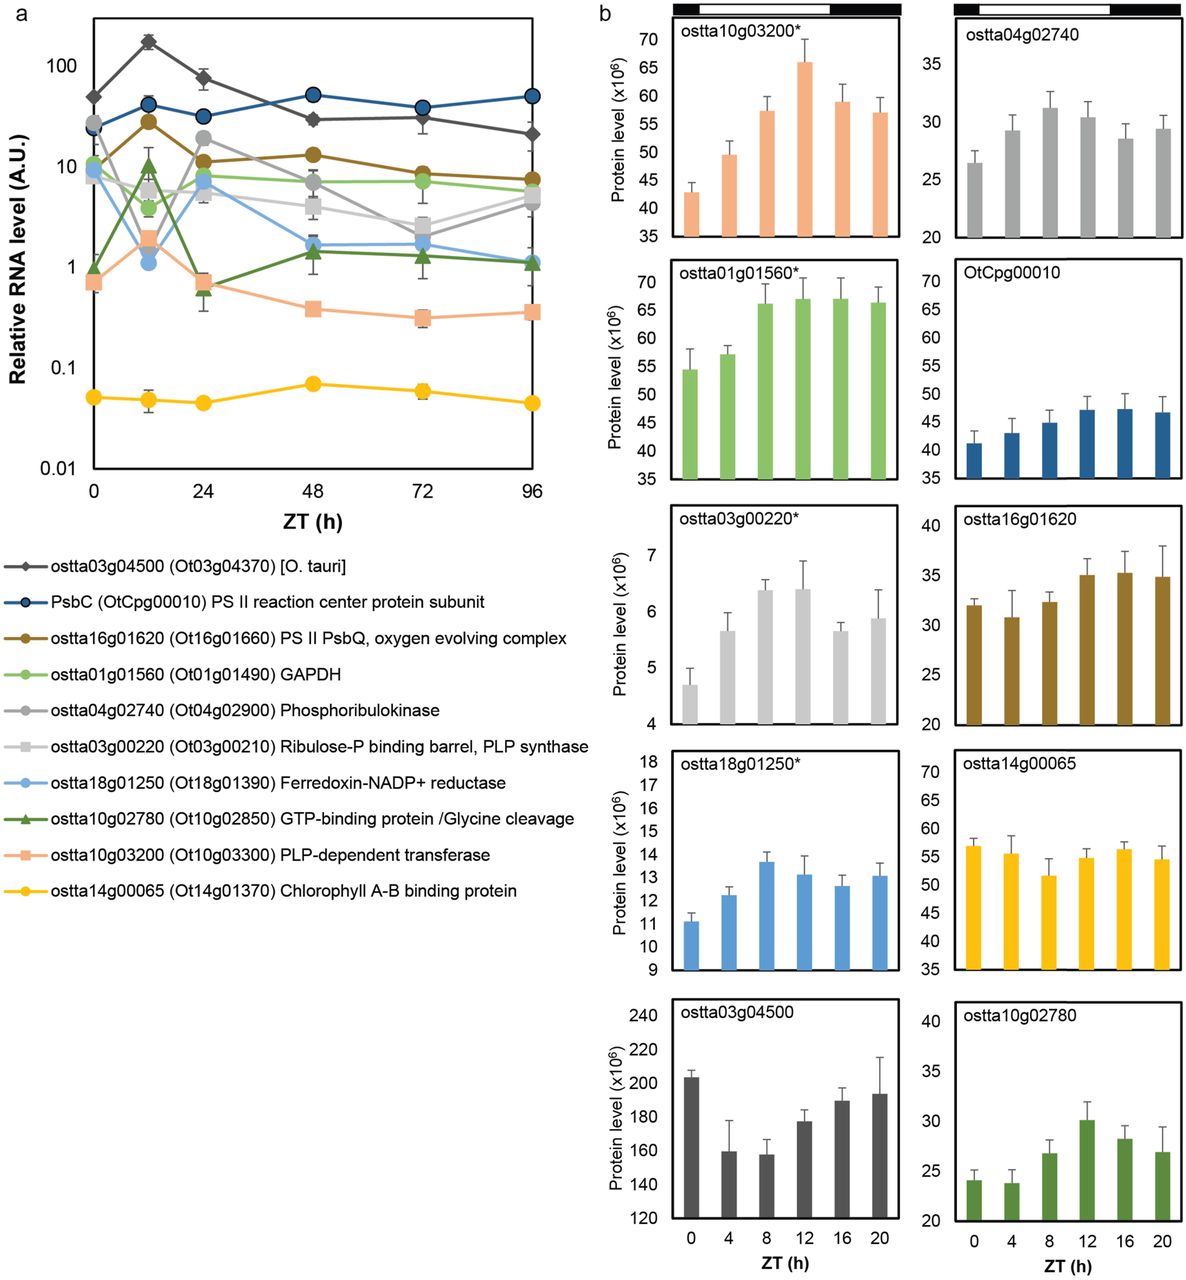
Gene expression in O. tauri is strongly rhythmic under LD conditions (Fig. 1c), with 89% of transcripts scored rhythmic in microarray data [15]. 85 (9.5%) of the detected proteins were significantly rhythmic and changed by at least 1.5-fold. Only 11 proteins showed greater than 5-fold change. In contrast, 66.3% of phosphoproteins (570 of 860; or 850 of 1472 PMs) were rhythmic by these criteria. Levels of 35 PMs changed more than 20-fold. The overlap among all three datasets included only 110 genes. The most common pairwise overlaps involved genes with changing levels of RNA and/or PMs but not of protein (Fig. 1c). Protein levels nonetheless changed smoothly, with distinct profiles (Fig. 2a). Of the twenty most highly-detected proteins, likely including the most abundant, 11 were significantly rhythmic but with low amplitudes, such that only ostta10g03200 exceeded the 1.5-fold change threshold (Table S1). 15 of the twenty most highly-detected PMs, in contrast, were rhythmic by both criteria (Fig. 2b). More stringent, equivalence testing revealed 49 proteins with significantly non-changing abundance but with significantly changing transcript and PMs, illustrated by the 10- fold change in PM abundance on the non-changing, LHC protein CP26 (EVFig. 2).

Significantly non-changing proteins (black lines) determined by two one-sided tests (TOST; ε = 0.3), plotted with their rhythmic phosphopeptide motifs ± S.E., square brackets show phosphorylated residue. Light/dark indicated by white/black bars.

Highly-abundant proteins (a) and PMs (b) under LD conditions (* marks rhythmic PMs). Genes with (c) high-amplitude and similar protein (solid line) and PM profiles (coloured lines), or (d) PM profiles that differ from the protein profile. (c, d) protein and PM, left axis; RNA profile (dashed line), right axis. Error bars, S.E. Light/dark indicated by white/black bars.
Comparable studies in Arabidopsis identified 0.1-1.5% rhythmic proteins from 7-9 % of the proteome in LD, using iTRAQ labelling with similar statistical criteria to ours [32, 33], or 4-7% rhythmic proteins from 4% of the proteome under constant light using a gel-based approach [57]. A study of the Arabidopsis phosphoproteome under constant light scored only 7% of 1485 phosphopeptides rhythmic [58], without a fold-change criterion. Our results provide greater coverage in the minimal O. tauri proteome, without complex experimental protocols.
To compare their overall diel profiles and suggest the major regulatory factors, principal component (PC) analysis was performed on each dataset (Fig. 1d–1i). PC’s 1-3 represented 83-86% of the variance (EVTable S3) but indicated a differing balance of regulation among datasets. In the transcriptome and phosphoproteome data, the primary distinction (PC1) was between dawn and dusk timepoints, whereas the light and dark intervals were separated by PC2 (Figs. 1d-e, 1h-i). This resulted in a temporal sequence of 13 transcript clusters, similar to past analysis (EVTable S4) [15]. Gene Ontology (GO) terms enriched among dusk-expressed RNAs included mitotic processes (DNA replication and repair), whereas translation, ribosome biogenesis and RNA processing were enriched around dawn (EVTable S3). The regulatory ranking was reversed in the proteome (Fig. 1f-g), where the major separation was between light and darkness (in PC1). The early day (ZT4), when translation and chlorophyll biosynthesis GO terms were enriched, was clearly distinguished from mid-night (ZT16 and 20). There was less separation (in PC2) of dawn, when proteins involved in the TCA cycle and transport processes are prominent, from the late day (ZT8-12), when translation and chlorophyll biosynthesis were still enriched. In contrast, the phosphoproteome (Fig. 1h-i) separated PMs abundant at ZT0 (enriched for transcription, glucose metabolism, K+ and protein transport and ubiquitin-dependent proteolysis) from ZT12. PC2 separated mid-day timepoints (ZT4, ZT8, with enrichment for regulation of gene expression, translation and transmembrane transport) from mid-night (ZT16, ZT20, when mitosis and Ca2+ transmembrane transport terms were enriched). Thus the even separation of changing RNAs among all the transcriptomic timepoints was not reflected either in the proteome or the phosphoproteome data, where the early day (ZT4) or dawn (ZT0) timepoints, respectively, stood out in the PC analysis.
Daytime peaks of protein abundance
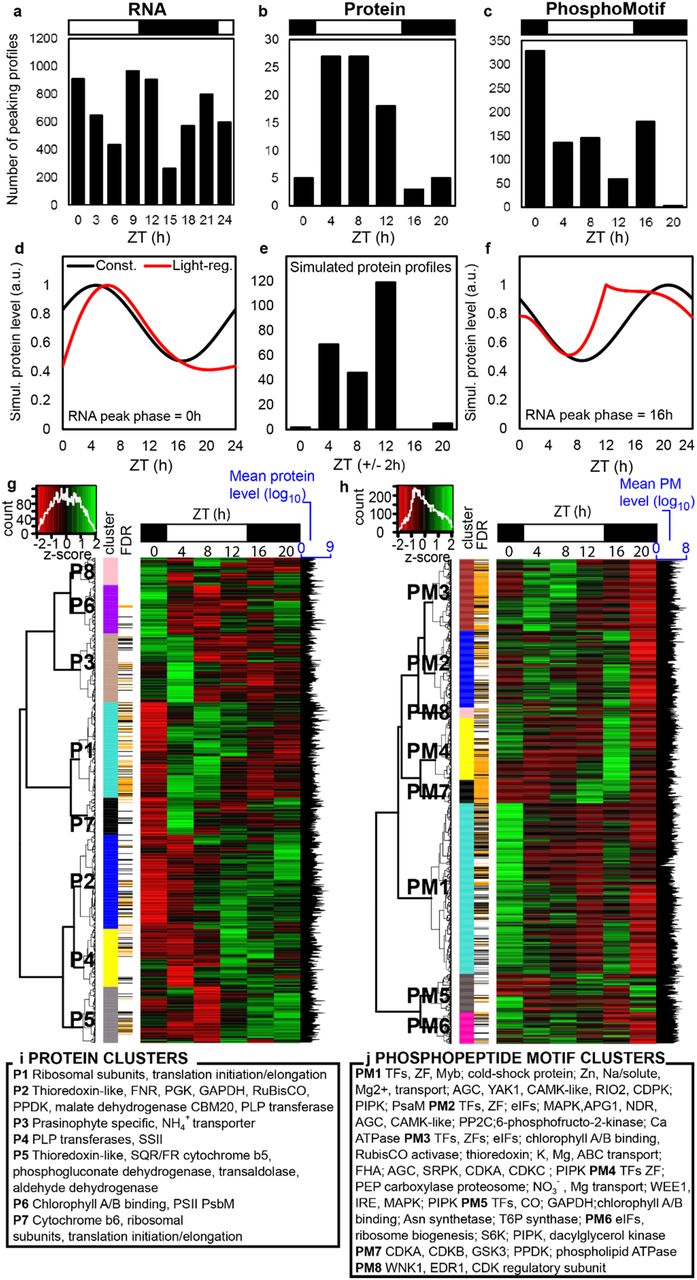
The distribution of peak times for individual proteins or PMs refined these broad patterns. Hundreds of transcripts reach peak abundance at every timepoint around the day/night cycle, with greater numbers after dawn and around dusk (Fig. 3a)[15]. In contrast, most protein profiles peaked in the light interval (85% at ZT4-12; Fig. 3b), separating day and night in line with the PC analysis. Metabolic labelling of O. tauri has shown ~5-fold higher protein synthesis in the day compared to the night [59]. We therefore tested whether this light regulation alone could explain the observed distribution of protein peaks. We simulated protein dynamics (Fig. 3d–3f; EVFig. 3a–3c) using measured protein synthesis and degradation rates [59], and an even temporal distribution of rhythmic mRNAs. The simulated distribution of protein profiles matched well with our experimental results (Fig. 3e; EVFig. 3d–3g). ostta03g04520 is an example of an RNA that peaks at ZT0 and its protein profile (Fig. 2c) was very similar to the predicted protein from such an RNA (Fig. 3d). Thus light-stimulated translation can largely account for the distribution of protein profiles, emphasising the dangers of using RNA profiles as a proxy for protein. Our simple model provided a useful correction that should also be applicable to plant data. These results further support our prediction that “translational coincidence” should alter the O. tauri proteome in different day lengths, as some rhythmic RNAs will coincide with light-stimulated translation only in long days [34].
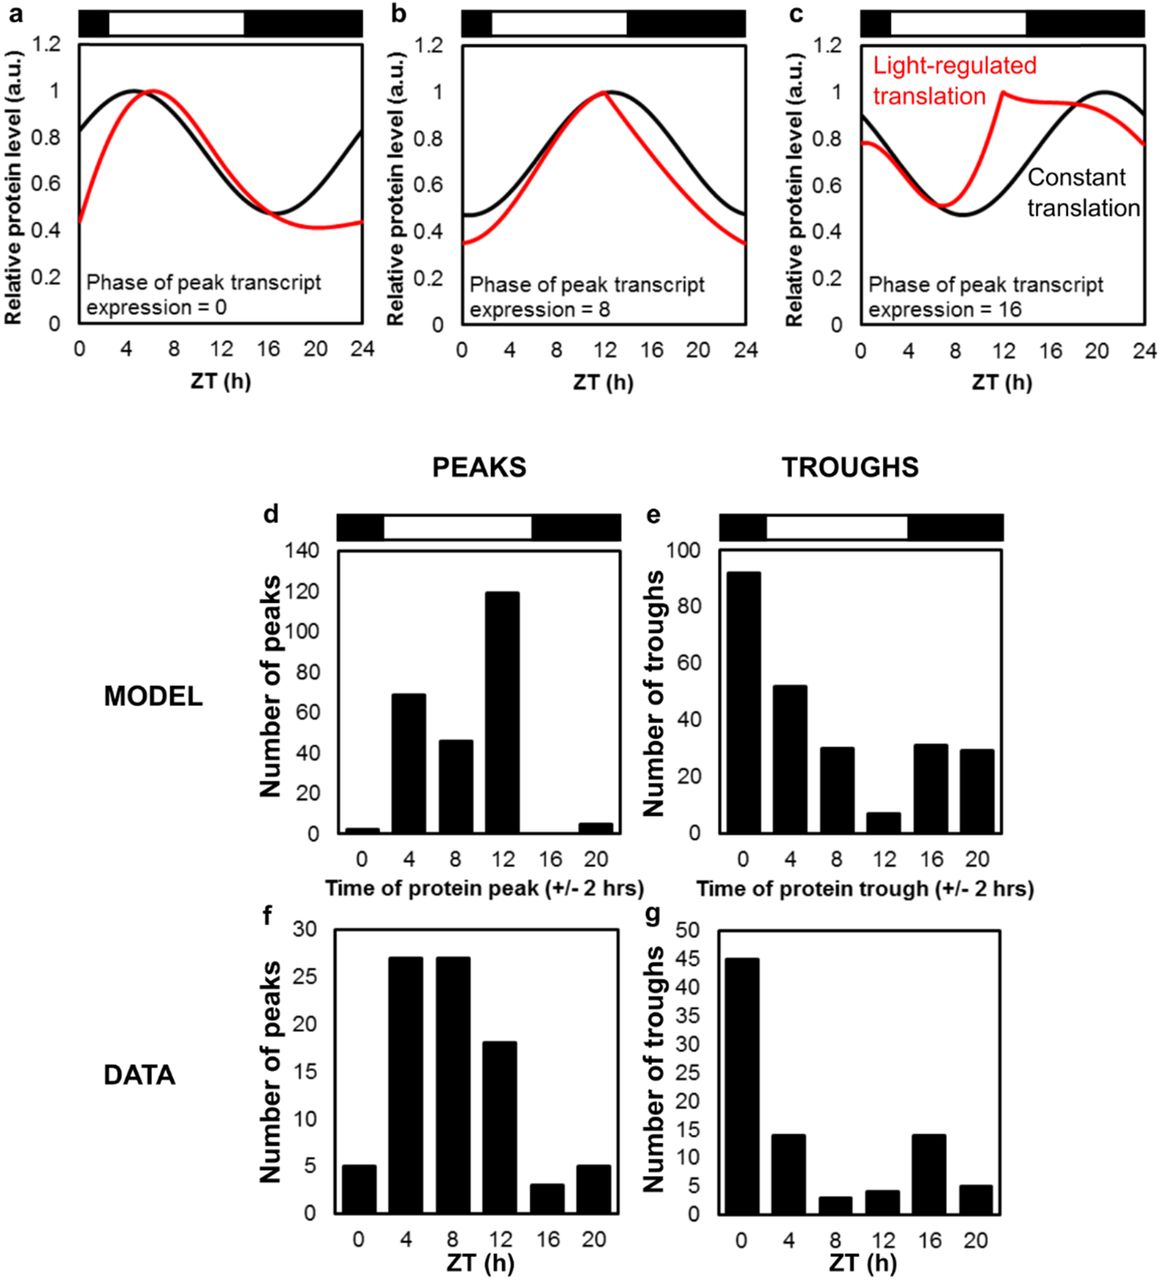
(a-c) Simulation of protein dynamics for an RNA with peak expression at ZT0 (a), ZT8 (b) and ZT16 (c), with observed, light-regulated translation rate (red lines) or with constant translation rate (black lines). Distribution of protein peaks (d,f) and troughs (e,g) for the model with light-regulated translation (d,e) compared to data (f,g). Distributions for constant translation would reflect the distribution of RNA profiles.

Temporal distribution of peaking profiles in (a) transcripts, (b) proteins and (c) PMs. (d, f) Simulated protein profiles from RNAs peaking at (d) ZT0 or (f) ZT16, with (red line) or without light-regulated translation (black line). (e) predicted protein peak distribution with light-regulated translation. Heat maps of median-normalised (g) protein and (h) PM abundance; insets show distribution of levels; clusters as in Fig. 1; >1.5 fold-change and BH FDR adjusted p-value <0.05 (black line) or <0.01 (orange line). (i, j) Examples of significantly-changing proteins and PMs in each cluster. Light/dark indicated by white/black bars.
A phospho-dawn of protein modification
Among the phosphopeptide motifs, 39% of changing PMs peaked in abundance at ZT0 (Fig. 3c), double the proportion of any other timepoint, and few peaked at ZT20. The ZT0 samples were harvested before lights-on, so this ‘phospho-dawn’ clearly was not due to light-stimulated translation. Some high-amplitude PM profiles tracked the levels of their cognate proteins, with little evidence of regulated phosphorylation (Fig. 2c). We therefore tested the contribution of protein levels to PM profiles more broadly, among the 138 genes that were quantified in both protein and PM datasets (EVFigs. 4a, 4b). This subset of 261 protein-PM pairings included proteins peaking at all timepoints, and PM profiles that reflected the peak time distribution of the full dataset. 80% of the PMs peaked at different timepoints than their cognate protein (EVFig. 4a, 4b; illustrated in Fig. 2d, EVFig.4c). The LHC linker protein CP29 (ostta01g04940) illustrates one pattern: its protein level rises in the light while a PM is de-phosphorylated (EVFig. 4c), close to a target site of chloroplast kinase STN7 in Arabidopsis [29]. To test a related feature of the phospho-dawn, we estimated the bulk protein phosphorylation across the diel cycle using protein gel staining (EVFig. 5a-b). The proportion of phosphorylated proteins was lowest in the daytime and increased during the night to peak at ZT0 (EVFig. 5c). Total phosphorylation was therefore broadly consistent with the distribution of PM profiles (Fig. 3c). Taken together, these results indicate that a regulator other than light or protein abundance, such as the circadian clock, controls the O. tauri phosphoproteome before dawn. The 36% of rhythmic phosphopeptides that peaked at subjective dawn under constant light in Arabidopsis [58], replicated with 45% and 73% in independent studies [60], suggest a similar, circadian-regulated phospho-dawn. We speculate that such phospho-regulation prepares green cells for daytime functions or ends night-time activities, before light-stimulated translation allows new protein synthesis.
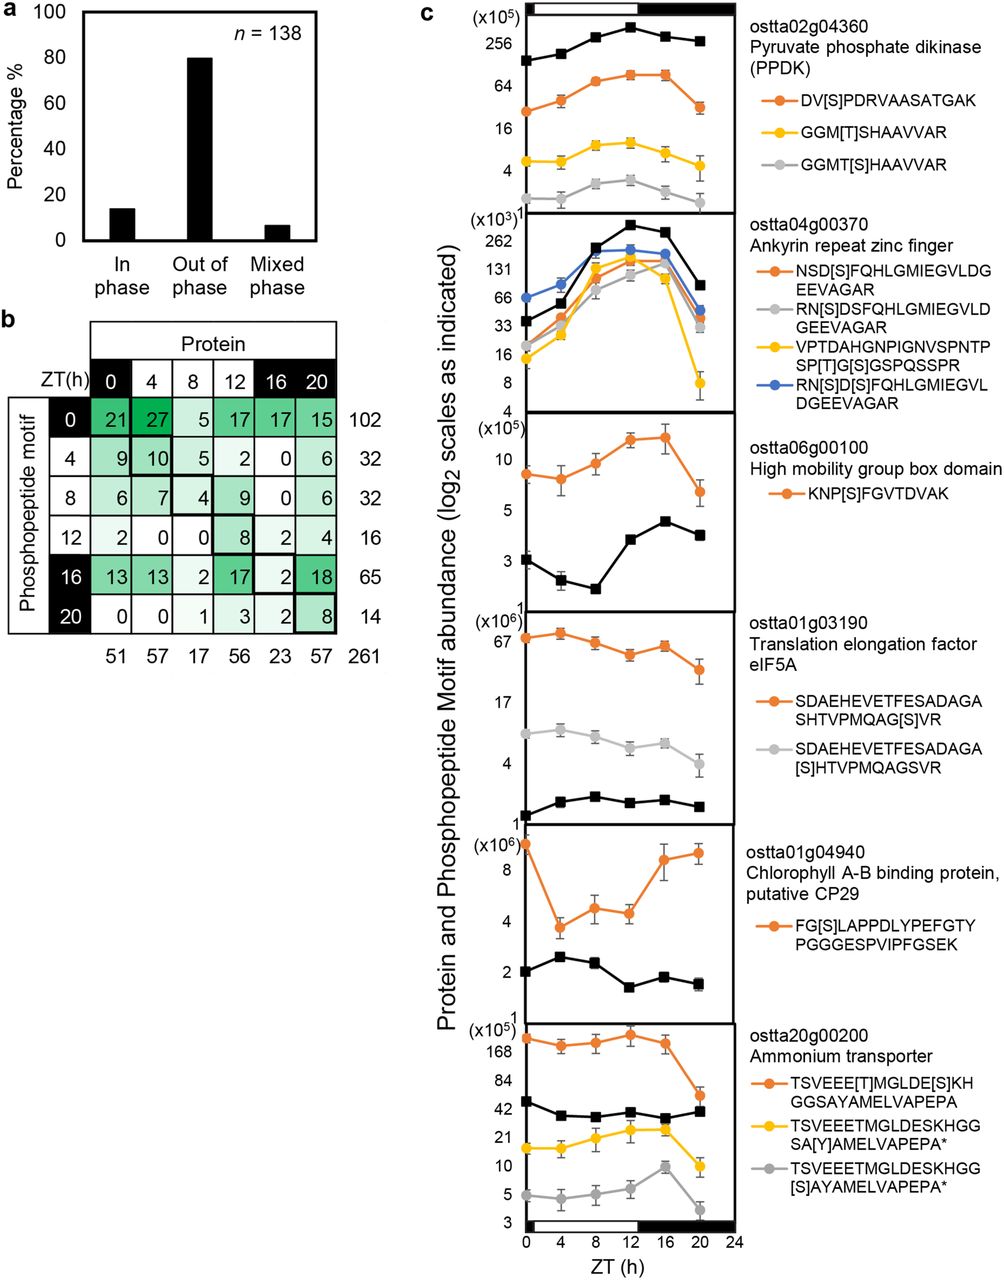
(a, b) Peak time is compared for genes identified in both LD protein and phosphopeptide motif datasets, with examples (c). (a) Mixed phase: multiple PMs, peaking at same and different times from cognate protein. Green shading in (b) follows number per bin. Plotting conventions in (c) follow Fig. 2c, 2d.

Stained gels showing changes in (a) protein and (b) phosphorylated protein abundance in LD, with (c) protein and (d) phosphorylated band quantification.

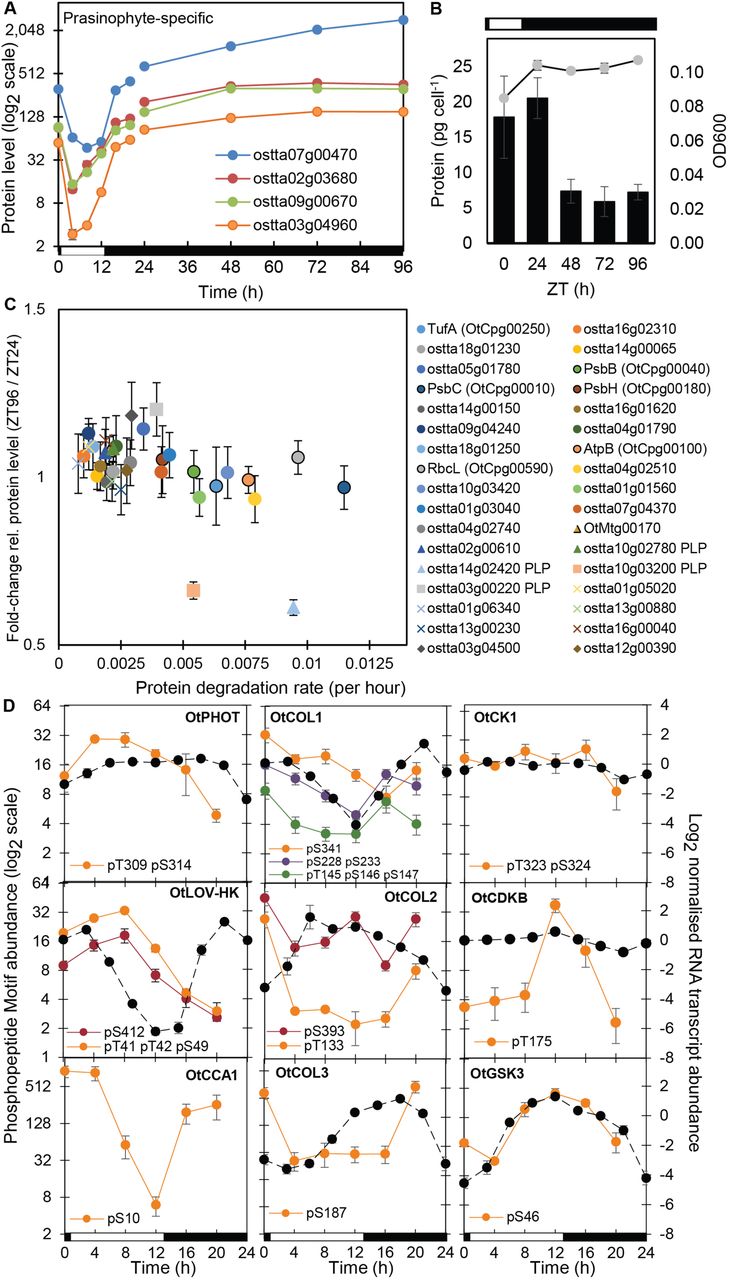
Protein abundance profiles (a) of rhythmic prasinophyte-specific proteins in cluster P6 in LD and DA conditions. (b) Optical density (OD600; line, right axis) and total protein per cell (columns, left axis) under LD and DA conditions. (c) Correlation of protein degradation rates [59] and relative protein levels after DA; chloroplast proteins (circles, chloroplast-encoded have solid outline); mitochondrial proteins (triangles, mitochondria-encoded outlined); PLP-enzymes (squares, marked in legend); prasinophyte-specific proteins (diamonds). (d) PhosphoMotif (coloured lines) and RNA profiles [15] (dashed lines) of photoreceptors, clock components, transcription factors and kinases indicated, under LD. Left axis range 26 (64-fold) except CCA1 (PM changes 150-fold) and OtCOL2 (PMs change up to 20-fold). Right (RNA) axis range 12, for log2 data (4096-fold in untransformed data). Error bars, S.E. Light/dark indicated by white/black bars.
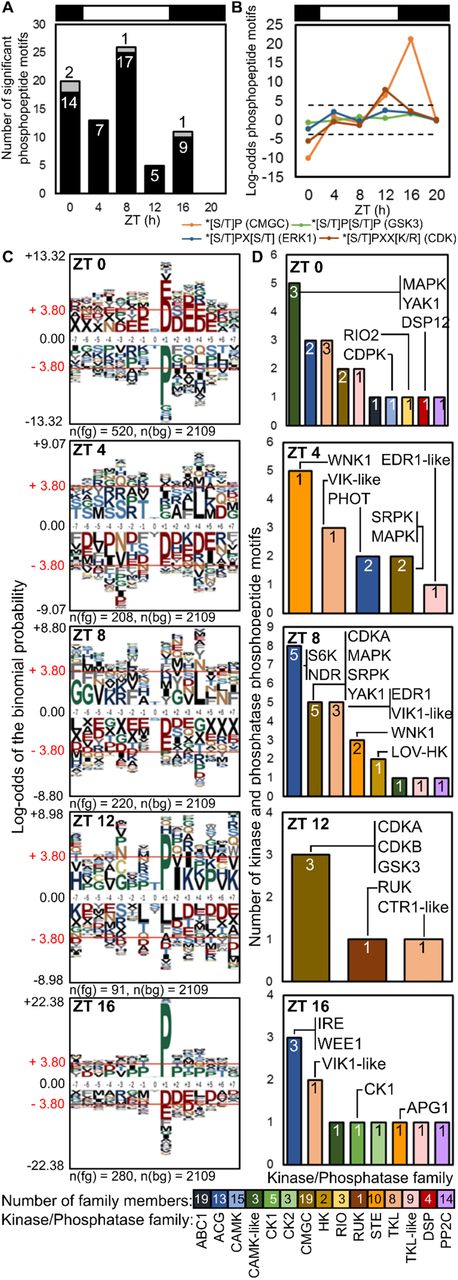
(a) Rhythmic PMs peaking at each timepoint on protein kinase (black) and phosphatase (grey) proteins (numbers). (b) Enrichment of proline-directed motifs (dashed line, p-value = 0.05). (c) pLogo sequence motifs of rhythmic PMs peaking at each timepoint (foreground; fg), relative to all detected phosphopeptides (background; bg). ± 3.80 indicates p-value = 0.05, residues above and below axis are over- and under-represented, respectively. (d) Rhythmic PMs by kinase/phosphatase family, annotated with example proteins.
The predicted functions of rhythmic proteins
Hierarchical clustering grouped the protein and PM abundance profiles into 8 clusters (termed P1–P8 and PM1–PM8, respectively; Fig. 3g, 3h). The largest protein cluster P1 includes profiles with peaks during the light period and troughs in darkness, such as the highest-amplitude, rhythmic protein ostta03g04520 (Fig. 2c). Proteins in clusters P1 and P3 (Figs. 3g, 3i) were strongly enriched for GO terms related to translation (EVTable S4), as were the overlapping sets of proteins peaking at ZT4 and ZT8 (EVTable S5, summarised in EVFig. 6a). Profiles in cluster P7 peak at ZT4, with enrichment of electron transport terms. Protein abundance in clusters P2, P4 and P5 peaks at the end of the day (see for example ostta06g03620, Fig. 2c) with varying profiles in the night, including proteins involved in light harvesting, photosynthesis, and enzymes associated with light-independent carbon metabolism. Chlorophyll synthesis proteins were also enriched at ZT8 (EVTable S5). The strong enrichment of translation terms reflects the 26 rhythmic proteins among 116 detected with this annotation (EVTable S5). Candidate regulators were fewer. The TOR target S6 kinase showed weakly-rhythmic PMs (EVTable S2) but none was detected either on its target ribosomal protein S6 [26] or on eIF4E, which mediates translational rhythms in mammals [61].

GO Biological Process term enrichment for rhythmic (a) proteins and (b) phosphopeptide motifs, that was significant (Fisher’s exact test p-value <0.05) in profiles with peak (no shading) or trough (pink shading) time at each timepoint. Light/dark indicated by white/black column. Grey bars represent proportion of significant terms identified with respect to total number of background annotated terms.
Protein clusters P6 and P8 linked the rarer proteins that fell in abundance at ZT4, associated with oxidative metabolism and protein transport GO terms. However, four of the 11, highest-amplitude rhythmic proteins are un-annotated, prasinophyte-specific proteins in cluster P6, with highest levels at night (Fig. 4a). Homology modelling of these proteins predicted limited structure and function. ostta02g03680 aligned with a human BAR domain dimer, which senses and creates membrane curvature [62] (EVFig. 7a-b). The small protein homologues ostta03g04960 (89 residues) and ostta07g00470 (145 residues) aligned with A. thaliana FHA domain structures (EVFig. 7c-f), domains that are involved in phosphopeptide recognition in diverse regulatory proteins [63]. Their dramatic fall in abundance at ZT4 (Fig. 4a) suggested a destabilisation by light. We therefore tested if such proteins remained stable during several days of dark-adaptation (DA).

Structural homology models predicted using I-TASSER of (a) ostta02g03680 where the model is overlaid with (b) H. sapiens BAR domain structure (2d4c); (c) ostta07g00470 model overlaid with (d) At4g14490 FHA domain structure (1uht); (e) ostta03g04960 model overlaid with (f) At5g20550 FHA domain structure (3vpy). Model α-helices (purple) and β-sheets (green) are numbered in black on the O. tauri model and in blue where structure is conserved with homologue protein overlay and in white where secondary structure is not conserved.
The dark proteome
O. tauri cells are photo-autotrophic. Their division is entrained by the LD cycle [64] and they arrest transcription after several days in darkness, when they can survive without growth or division [50]. Cell density (optical density at 600nm) in our cultures increased by ~25% after one LD cycle. Protein content was consistent (18-20 pg cell−1) at ZT0 and again at ZT24 (Fig. 4b). In three further days of darkness, optical density remained constant but protein content per cell dropped by over 60% on the first day (ZT24 to ZT48) and was then stable to ZT96, suggestive of a distinct, cellular ‘dark state’.
Surprisingly, the proteomic landscape was affected less by darkness than in standard LD. 98 of the 865 proteins quantified by LC-MS (EVTable S6) changed levels more than the average and only 64 (7%) also changed more than 1.5-fold. The 35 significantly-increasing proteins in DA included five transmembrane transporters, a Lon-related protease and two superoxide dismutases, suggestive of nutrient acquisition, protein mobilisation and oxidative stress responses. The four prasinophyte-specific proteins noted above were among the ten most-increasing proteins in DA, confirming their unusual regulation and suggesting a shared function in both standard night-time and the putative ‘dark state’. The most-decreasing among 63 significantly-decreasing proteins was a starch synthase (ostta06g02940). A PPDK (ostta02g04360) that strongly increased in daytime under LD (EVWFig. 4c) also decreased in DA. The largest functional group comprised 22 cytosolic ribosomal proteins and translation factors (EVTable S6), suggesting that O. tauri selectively mobilised this protein pool in darkness.
This limited reshaping of the proteome implied that protein stability in DA was in general related to standard LD. We tested this using 34 proteins for which turnover in LD was previously quantified [59]. Falling protein abundance under DA was indeed significantly correlated with higher degradation rates in LD (Fig. 4b; R = −0.48, p=0.004), even among these abundant, stable proteins. Proteins with the lowest measured LD turnover and high levels after DA included a further prasinophyte-specific protein ostta03g4500, which was highly abundant in LD (Fig. 2a). Its level fell slightly at ZT4 in LD, whereas the other stable proteins were significantly non-changing in LD (five including ostta14g00065; EVFig. 2) or rose in the daytime (EVFig. 8b). mRNA quantification showed transcripts with strongly rhythmic profiles in LD retained stable levels after ZT48 (EVFig. 8a). The stable RNAs in these transcriptionally inactive O. tauri are consistent with results from enucleated cells of the giant alga Acetabularia [65].
For ten proteins compared in the DA and metabolic labelling [59] data (Fig. 4c), (a) RNA abundance under LD and DA conditions from qRT-PCR assays, and (b) protein profiles under LD. *, rhythmic proteins. Error bar, S.E.
We speculate that cytosolic ribosomes are mobilised in DA rather than abundant, chloroplast proteins, because photosynthetic function is critical upon re-illumination. Renewed metabolic activity might then restore translation capacity and the observed activity of reporter genes [50]. The physiological relevance of a ‘dark state’ is not obvious, as darkness might usually result in death. However, Ostreococcus relatives persist under the Polar Night [66]. Cells near the deep chlorophyll maximum [67] could also be moved into the dark, benthic zone by turbulence, to return later via upwelling [68, 69]. The ‘dark state’ in our DA conditions might thus reflect a quiescent form, known from other phytoplankton [70], which are ecologically important in benthic-pelagic coupling [71].
Functions of rhythmic phospho-motifs
The LD datasets confirmed that protein phosphorylation profiles often diverged from protein abundance. PMs in cluster PM3 peaked in the light, consistent with many protein profiles (examples in Fig. 2c), with enrichment for proteins predicted to regulate transcription, metal ion transport and protein phosphorylation (Fig. 3h) and including PMs on photoreceptors phototropin and LOV-HK (Fig. 4d). Most PM clusters were not acutely light-regulated. The largest cluster PM1 peaked before dawn, including PMs on predicted CONSTANS-like (OtCOL), B-box transcription factors related to the clock protein TOC1 (Fig. 4d), and on the RWP-RK mating-type factor ostta02g04300 [72]. PM1 includes the predicted CK2 target site pS10 in the clock protein CCA1 (ostta06g02340; Fig. 4d), close to a CK2 site in Arabidopsis CCA1 [73]. PMs in the PM2, PM4, PM7 and PM8 clusters peak at ZT16, with or without accumulation in daytime (Fig. 3h). These clusters are enriched for PMs on protein kinases including cell-cycle-related kinases (Fig. 3j; EVFig. 6b, EVTables S4 and S5).
Rhythmic regulation of the kinome
To test the mechanisms underlying the phosphoproteome dynamics, we analysed amino acid enrichment motifs in rhythmic PMs compared with all quantified phosphopeptides, avoiding bias due to PM abundance. PMs that peaked at ZT16 were strikingly enriched for the prolinedirected motif [pS/T]P (Figs. 5b–5d), which is associated with the CMGC kinases, including Cyclin-Dependent Kinases (CDKs) and GSK. Consistent with this, the profiles of all PMs with predicted GSK target sequences also most often peaked at ZT16 (EVFig. 9a-b). Levels of GSK3 RNA and a PM on GSK3 peaked at ZT12 (Fig. 4d), though the auto-phosphorylation site pY210 was not rhythmic (Fig. 2b; Supp Table 2). More specific CDK target motifs [pS/T]PXX[K/R] were enriched at ZT12, consistent with the known timing of cell division [64, 74] and the peak level of the activation phospho-site of CDKB (Fig. 3d). Of the clock-related protein kinases, predicted CK1 targets were most abundant and most often peaked at ZT0. Predicted CK2 target sequences were more rhythmic, with at least 5-fold more peaking at ZT0 than at other times (EVFig. 9a). Acid([D/E])-directed CK2 target motifs were also significantly enriched on rhythmic PMs that peaked at ZT0 (when proline-directed motifs were depleted) but depleted on PMs peaking at ZT16 or ZT4 (Fig. 5c). Thus predicted targets of the clock-related kinases CK1 and CK2 both contribute to the phospho-dawn profiles, in antiphase to the evening peaks of proline-directed phospho-sites. During the day (ZT4 and 8), enrichment of hydrophobic residues at positions −5 and +4 is suggestive of the SnRK consensus [75], the plant kinase most related to animal AMPK. Further comparison to animal systems is limited, as the most rhythmic kinase Akt (PKB) in mouse liver [36] is absent from the green lineage [8].

Distribution of GPS3-predicted CK1, CK2 and GSK3 targets among rhythmic phosphopeptide motifs, binned by peak (a) and trough (b) times. (c) Phosphosites on rhythmic protein kinases predicted to be phosphorylated by CK1, CK2 and GSK3. Sites first reported here are highlighted, and sites observed previously [48].
We analysed the 68 rhythmic PMs on protein kinases and five PMs on protein phosphatases, as candidate mediators of rhythmic phosphorylation (Figs. 5a, 5d). The PMs on kinases represent 8% of the total, though protein kinase genes comprise ~1.5% of the genome. Indeed, the most heavily-phosphorylated protein with 14 PMs was the WITH NO LYSINE (WNK) kinase that may target clock proteins in Arabidopsis [76] (Supp. Table 2; Fig. EV9c). 21 protein kinases bore rhythmic PMs that are predicted targets of the clock-related kinases (EVFig. 9c). Around mitosis at ZT12-16, significantly peaking PMs were detected on cell cycle regulators CDKA, CDKB and WEE1 (Fig. 5d). Kinase PMs peaking at ZT4-8 included Serine-Arginine Protein Kinases (SRPKs), MAPKs, CDKA and a site on Yet Another Kinase (YAK1). PMs that peaked at ZT0, coincident with the phospho-dawn, included RIO2, YAK1 and CDPK, all implicated in cell cycle regulation and progression [77, 78]. RIO’s are among the few kinase families shared with the Archaea [79], making them candidate contributors to an ancient, non-transcriptional oscillator [52]. CK2 subunits were not detected in our data and the PM on CK1 was not strongly rhythmic (Fig. 4d). The protein abundance of the three detected protein kinases and two phosphatases also was not rhythmic (Supp. Table 1). Levels of ostta05g04850, a protein with a rhodanese domain distantly related to some protein phosphatases, fell to a trough at ZT0 when many PMs peaked (Suppl. Table 1). The most-changing PM on a predicted protein phosphatase was pT175 in ostta11g02830, related to human Dual-specificity phosphatase DUSP12 (Fig. 5d). Finally, changing levels of phospho-recognition proteins might contribute to the phospho-dawn by interacting with protein kinases or phosphatases. The prasinophyte-specific FHA domain proteins (EVFig. 6) are prime candidates. For example, their rapid fall at ZT4 (Fig. 4a) might antagonise the phosphorylation of acid-directed phosphomotifs (Fig. 5b), ending the phospho-dawn. The minimal kinome and phosphoproteome of O. tauri should facilitate testing such candidates in future, potentially also explaining the phospho-dawn profile in other species.
Materials and Methods
Materials
Chemicals were purchased from Sigma-Aldrich unless otherwise stated. Main solvent, acetonitrile and water for LC-MSMS and sample preparation were HPLC quality from Fisher Scientific. Formic acid was Suprapure 98-100% (Merck) and trifluoroacetic acid (TFA) was 99% purity sequencing grade. Porcine trypsin TPCK treated was from Worthington (Lorne Laboratories). All HPLC-MS connector were from Upchurch Scientific or Valco (Hichrom and RESTEK). % are expressed in v/v.
O. tauri media and culturing
Ostreococcus tauri OTTH95 were cultured as previously described [80], supplemented with 0.22 μm filtered 50 µg ml−1 ampicillin, neomycin and kanamycin antibiotics in vented tissue culture flasks (Sarstedt). Cultures were maintained by splitting weekly at 1:50 dilution. In preparation for proteomics experiments, cultures were grown in growth media supplemented with 200 mM sorbitol and 0.4% glycerol prior to harvesting [50]. Cells were cultured under cycles of 12 hour light/ 12 hour dark (LD) at 20°C in a controlled environment chamber (MLR-350, Sanyo) at a light intensity of 17.5 μEm−2 s−1 white fluorescent light filtered by 724 Ocean Blue filter (LEE Filters Worldwide).
O. tauri cell harvesting
Cells were grown for 7 days in LD and on the seventh day harvested, with five replications, at Zeitgeber Time (ZT) 0, 4, 8, 12, 16 and 20, where ZT0 corresponds to dawn. At ZT0 cells were harvested before the lights went on and at ZT12, before the lights went off. 135 ml culture was harvested by centrifugation (4000 rpm, 10 min, 4°C) per sample replicate, each from a separate culture vessel. Pellets were resuspended in ice cold phosphate buffered saline solution (PBS). Cultures were centrifuged as before, pellets were air dried and then vortex-mixed in 250 µl 8M urea and stored at −80°C. For total cell lysate, cells were dissolved by sonication (Branson Ultrasonics) and diluted with 500 µl dH2O.
Cells were grown for 7 days in LD and on the eighth day the Dark Adaptation (DA) experiment cell harvests were performed at ZT24, 48, 72 and 96 in constant darkness with five replications. The samples were harvested and prepared as for the LD experiment.
Protein digestion
Samples were analysed by Bradford Assay (Bio-Rad) and 400 µg protein of each sample was used in the digestion. Samples were reduced in 10 mM dithiothreitol and 50 mM ammonium bicarbonate, and alkylated with 25 mM iodoacetamide. Samples were digested overnight with 10 µg (1:40 ratio) trypsin under agitation at room temperature at pH8 in a total volume of 1 ml. Samples were cleaned on SPE BondElut 25 mg columns (Agilent Technologies) following the vendor instruction. 50 µl (~20 µg) was removed and dried for LC-MS (Speedvac, Thermo Fisher Scientific). The remaining ~380 µg were also dried in preparation for phosphopeptide enrichment, and stored at −20°C.
Phosphopeptide enrichment
Dried peptide samples (~380 µg) were sonicated in 50 µl solution 0 (2.5% acetonitrile, 0.5% TFA) and 100 µl solution 2 (80% acetonitrile, 0.5% TFA, 100% lactic acid). Titansphere Phos-TiO Kit spin tip-columns (GL Sciences) were washed with 40 µl solution 1 (80% acetonitrile, 0.5% TFA). Samples were loaded on the spin tip-columns and passaged three times through a centrifuge; 5 min at 200 xg, 15 min incubation at room temperature and 10 min at 200 xg. Spin tip-columns were subsequently washed once with solution 1, twice with solution 2 and twice with solution 1for 2 min at 200 xg. Phosphopeptides were eluted in two steps, first with 50 µl 5% ammonium hydroxide (5 min at 200 xg) and secondly, with 5% pyrrolidine solution. 20 µl 20% formic acid was added to lower the pH and samples were cleaned on Bond Elut OMIX C18 pipette tips (Agilent Technologies) following the manufacturer’s instruction.
Protein and phosphoprotein quantification
15 µg protein from total O. tauri cell lysates were run on a Novex NuPAGE 4-12% Bis-Tris by SDS-PAGE with PeppermintStick Phosphoprotein Molecular Weight Standards and Spectra Multicolor Broad Range Protein Ladder (Thermo Fisher Scientific). The gel was fixed overnight (50% methanol, 40% ddH2O, 10% glacial acetic acid), washed in ddH2O and stained with Pro-Q Diamond Phosphoprotein Gel Stain (Invitrogen) in the dark at 25°C following manufacturer’s instructions. The gel was imaged on a Typhoon TRIO variable mode imager (GE Healthcare) at 532 nm excitation/ 580 nm emission, 450 PMT and 50 micron resolution. Images were processed using ImageQuant TL software (GE Healthcare). The gel was re-used for protein quantification using SYPRO Ruby Protein Gel Stain (Thermo Fisher Scientific) following manufacturer’s instructions and imaged using a UV transilluminator (Ultra-Violet Products Ltd). Protein and phosphoprotein bands were quantified using Image Studio Lite v 4.0 (LI-COR).
Protein per cell quantification
Cells were cultured and harvested in the same experimental regime (described above) and harvested in triplicate at the times indicated for the LD and DA experiments. Protein was quantified using Bradford Assay. 1/200 dilution of cells were put into fresh media containing 1X SYBR Green I Nucleic Acid Gel Stain (Invitrogen, UK) and counted using fluorescence-activated cell sorting (FACS) (Becton Dickenson, UK) at a flow rate of 60μl per minute.
qPCR for transcriptional regulation during DA
Cells were cultured and harvested in the same experimental regime (described above) and harvested in biological triplicate at the times indicated for the LD and DA experiments. Total RNA was extracted from frozen cells using an RNeasy Plant Mini Kit and DNase treated (QIAGEN). First-strand cDNA was synthesised using 1 µg RNA and 500 ng µl−1 Oligo(dT)15 primer (Promega), denatured at 65°C for 5 min, and reverse transcribed using SuperScript II (Invitrogen) at 42 °C for 50 min and 70 °C for 10 min. 1/100 cDNA dilutions were analysed using a LightCycler®480 and LightCycler®480 SYBR Green I Master (Roche) following manufacturer’s instructions and cycling conditions of pre-incubation 95°C for 5 min; 45 X amplification cycles of 95°C for 10 s, 60°C for 10 s, 72°C for 10 s. The following 5’ to 3’ forward (F) and reverse (R) primers to O. tauri gene loci were used: ostta01g01560 GTTGCCATCAACGGTTTCGG (F), GATTGGTTCACGCACACGAC (R); ostta03g00220 AAGGCTGGTTTGGCACAGAT (F), GCGCTTGCTCGACGTTAAC (R); ostta03g04500 GCCGCGGAAGATTCTTTCAAG (F), TCATCCGCCGTGATGTTGTG (R); ostta04g02740 ATCACCTGAACGATCGTGCG (F), CCGACTTACCCTCCTTAAGCG (R); ostta10g02780 GGCGTTCTTGGAATCTCTCGT (F), TATCGTCGATGATCCCGCCC (R); ostta10g03200 GGTACGGAGGAAGAAGTGGC (F), ATGTCCATGAGCTTCGGCAA (R); ostta14g00065 GACAGCCGGTGGATCAGAAG (F), TCGAGGTAGCTCGGGAGATC (R); ostta16g01620 ACGGGTTGCAGCTCATCTAC (F), CCGCTTGGGTCCAGTACTTC (R); ostta18g01250 CTTGCAAATGTCCACGACGG (F), ATGATGTGGCACGTCTCACC (R); OtCpg00010 ACATGACTCACGCGCCTTTA (F), TGCCAAAGGTGCCCTACAAA (R). Primers to eukaryotic translation elongation/initiation factor (EF1a) ostta04g05410 GACGCGACGGTGGATCAA (F) and CGACTGCCATCGTTTTACC (R) were used as an endogenous control. Data were combined for biological and two technical replicates and relative quantification performed using LightCycler®480 1.5 software (Roche).
HPLC–MS analysis
Micro-HPLC-MS/MS analyses were performed using an on-line system consisting of a micro-pump 1200 binary HPLC system (Agilent Technologies) coupled to an hybrid LTQ-Orbitrap XL instrument (Thermo Fisher Scientific). The complete method has been described previously [81]. For all measurements, 8µl of sample was injected using a micro-WPS auto sampler (Agilent Technologies) at 5µl /min. After sample loading, the flow rate across the column was reduced to approximately 100-200 nl/min using a vented column arrangement. Samples were analysed on a 140 min gradient for data dependant analysis.
HPLC-MS data analysis
To generate files compatible with public access databases PRIDE [82] and Pep2pro [83], Mascot Generic Format (MGF) input files were generated using MSConvert from ProteoWizard [84]. MSMS data was searched using MASCOT version 2.4 (Matrix Science Ltd) against the O. tauri subset of the NCBI protein database (10114 sequences from NCBI version 2014 June 6th including common contaminants) using a maximum missed-cut value of 2, variable oxidation (M), N-terminal protein acetylation, phosphorylation (STY) and fixed carbamidomethylation (C); precursor mass tolerance was 7 ppm and MSMS tolerance 0.4 amu. The significance threshold (p) was set below 0.05 (MudPIT scoring). Global FDR was evaluated using decoy database search and removal of peptides ranked higher than 1 for a mascot score above 20 (~1% global FDR). Mass spectrometry proteomics data have been deposited in PRIDE ProteomeXchange Consortium [85] via the PRIDE partner repository with the dataset identifier LD global proteomics, PXD001735; LD phosphoproteomics, PXD001734; DA global proteomics, PXD002909. Data was converted into PRIDEXML using Pride converter 2.0.20 and submitted using proteome exchange tool pxsubmission tool 2.0.1. The LC-MS data are also publicly available in the pep2pro database at www.pep2pro.ethz.ch(Assemblies ‘Ostreococcus tauri Light:dark cycle,LD global’, ‘Ostreococcus tauri Light:dark cycle,LD phospho’, and ‘Ostreococcus tauri dark adaptation,DA global’).
Label-free quantification was performed using Progenesis version 4.1 (Nonlinear Dynamics). Only MS peaks with a charge of 2+, 3+ or 4+ and the five most intense spectra within each feature were included in the analysis. Peptide abundances were mean-normalised and ArcSinH transformed to generate normal datasets. Within-group means were calculated to determine fold changes. Neutral losses of phosphoric acid typical of serine and threonine phosphorylated were validated manually in all significantly differential phosphopeptides. Ambiguous sites were confirmed by cross-referencing (by sequence, charge, and quantity of residue modifications) with most probable site predictions from MaxQuant version 1.0.13.8 [86] in singlet mode, Mascot settings as above. Where multiple occurrences of residue phosphorylation events were quantified, abundances were summed, collating all charge states, missed cuts and further modifications.
Data analysis
Merging
For accurate and unique phosphopeptide quantification we addressed variant redundancy at different charge states, alternative modifications (e.g. oxidation and acetylation) and multiple sites of protease digestion. All unique phosphorylation events were retained, including multiple phosphorylation, at a given amino acid motif, while summing the quantification of these technical variants. The qpMerge (http://sourceforge.net/projects/ppmerge/) software was used to combine Progenesis and MaxQuant phospho-site predictions and produce a unique set of quantified phosphopeptide motifs [54].
Outlier identification and removal
To detect outliers we applied principal component analysis (PCA) of replicates and comparing each replicates r2 to the respective median abundance at that ZT. 4E was excluded based on extreme differences in peptide quantification as viewed in the wider distribution of the ratios to the sample median, which was confirmed with a Pearson’s correlation against a defined criterion of a sample median of < 0.8 (EVFig. 1).
P-value calculation and false discovery rate (FDR)
For analysing the significance of changing protein and peptide abundance over time, non-linear response of expression using polynomial regression was modelled using the R Stats Package. A third order polynomial was fitted, allowing for an expected peak and trough within a 24 h daily cycle. An arcsinh transformation of abundance was applied to meet the required assumption of normality [87]. FDR was calculated using the Benjamini and Hochberg (BH) method [88]. More than 2 quantifying peptides were required to report protein abundance.
Equivalence testing
Using the R equivalence package, the statistical equivalence of mean abundance across time was tested as the highest p-value from exhaustive pairwise Two one-sided test approach (TOST) tests over all ZTs [89, 90]. We tested whether abundances had upper and lower differences of less than 0.3 within the equivalence margin (ε).
O. tauri gene identifiers
O. tauri genome version 1 gene IDs [91] for microarray data were converted to version 2 IDs [42] by finding exact sequence matches for the microarray probes (Accession GPL8644) [15] in the version 2 FASTA coding sequence file.
Principle component analysis
PCA was used to investigate the main components of variation in the data using prcomp from the R Stats Package. The abundances were zero-centred per-feature. The PCA values for each feature were extracted and then used for Gene Ontology (GO) enrichment analysis.
Clustering
Hierarchical clustering was performed with hclust from the R Stats Package and applied on per-feature (protein or phosphopeptide motif) mean abundances over time, which were zero-centred and scaled. Pearson’s correlation was used to calculate distance matrix and the Ward method [92] for linkage criteria. The hierarchical tree was divided into clusters using the dynamicTreeCut algorithm [93]. The hybrid cut tree method with a cut height of 100 and a minimum cluster size of 20 was used for both datasets. Clusters are displayed with 95% (black lines) and 99% (orange lines) confidence via multiscale bootstrap resampling (AU determined p-value).
Enrichment analysis for GO terms
TopGO was used to evaluate the enrichment of GO terms, for each ontology aspect, within clusters, peaks, troughs, and principle components. For clusters, peaks and troughs a Fisher’s exact test was used by partitioning at 95% confidence on FDR corrected p-values, and with a fold change >1.5 in normalised abundance. For each test, we use a relevant background of non-significant observed features. To test for enrichment of GO terms for each PCA the Kolmogorov-Smirnov test was applied over the absolute PCA values for each gene. GO terms were predicted by InterProScan 5 [94] on amino acids sequences for O. tauri coding sequences (NCBI version 140606 [42]).
Homology modelling
Structural homology models were generated using I-TASSER [95] of prasinophyte-family specific proteins of unknown structure and function. DOIs for PDB entries used to generate the models include: 10.2210/pdb2d4c/pdb (ostta02g03680), 10.2210/pdb1uht/pdb (ostta07g00470) and 10.2210/pdb3vpy/pdb (ostta03g04960).
pLOGO and binomial statistics
Significantly over- and under-represented amino acid residues at different time-points were calculated using the binomial based pLogo tool [96]. The MotifX tool [97] was used to discover novel motifs in the dataset. Binomial statistics were applied to calculate the enrichment of motifs and the combined probabilities of amino acids with similar properties in a phospho-motif (e.g. the acidic D/E positions in the CK2 motif).
Kinase target prediction
Computational prediction of protein kinase motifs associated with the identified phosphorylation sites was performed using Group-based Prediction System, GPS Version 3.0 (http://gps.biocuckoo.org/index.php) [98].
O. tauri loci IDs mapping to A. thaliana loci IDs
O. tauri and A. thaliana IDs were mapped using EggNOG4.1 (http://eggnogdb.embl.de). O. tauri proteins were downloaded from https://bioinformatics.psb.ugent.be/gdb/ostreococcusV2/LATEST/OsttaV2_PROT_20140522.fasta.gz (May 22nd, 2014). Viridiplantae (virNOG) hmms and their descriptions and annotations were transferred to O. tauri proteins using hmmr 3.1 (http://hmmer.janelia.org)
Mathematical simulations
Simulated protein rhythms
Protein dynamics (P(t)) were simulated according to the following model:
 Where L(t) = 1 during the day (ZT <=12), and 0 otherwise. The rate of protein degradation (kdeg) was set to 0.1 h−1, and the ratio of protein synthesis in the light compared to the dark (ksyn) was set to 4, based on [59]. The rhythmically expressed mRNA levels (m(t)) are given by:
 The peak phase of expression is given by φ. To obtain the distributions of peak and trough protein levels, the peak phases (φ) of mRNA expression were uniformly distributed at 0.1 h intervals across the range [0,24]. For each phase of mRNA expression, the timing of peak and trough protein levels was determined by simulating the model dynamics in MATLAB using the ode15s ODE solver. The peaks and troughs were identified across a 24 h period, following 240 h simulation to allow the dynamics to reach a steady behaviour (i.e. with the same protein levels at ZT0 and ZT24).
Protein degradation rates and depletion during dark adaptation
Degradation rates were calculated from published proteomics data [59], which characterised the dynamics of partial 15N isotope incorporation. We assumed a labelling efficiency of 0.93 (=maximum labelled fraction achieved of any protein + 0.01), and fitted a simple kinetic model assuming: (1) constant labelling efficiency over time; (2) different proteins are labelled at the same efficiency; (3) heavy and light fractions are turned over at equal rates, similar to a recent publication [34]. One protein with a high degradation rate ~0.03 h−1 was excluded as an outlier, which increased the correlation to R = −0.7 when included.
Author Contributions
Z.B.N., S.F.M. and T.L.B. performed experiments and analysed data. M.M.H. performed bioinformatic analyses. D.D.S. performed mathematical modelling. A.J.M., T.I.S., T.L.B., S.F.M., M.M.H. and Z.B.N. contributed to the design of the study and analytical approaches. Z.B.N., M.M.H., T.L.B. and A.J.M. wrote the paper. Z.B.N. and M.M.H. contributed equally to this study.
Data Availability
The OTTH95 strain is available from the CCAP (www.ccap.ac.uk) and RCC (roscoff-culture-collection.org) stock centres. Mass spectrometry proteomics data have been deposited in PRIDE ProteomeXchange Consortium via the PRIDE partner repository with the dataset identifiers: LD global proteomics, PXD001735; LD phosphoproteomics, PXD001734; DA global proteomics, PXD002909. The LC-MS data are also available in pep2pro at http://www.pep2pro.ethz.ch (Assemblies ‘Ostreococcus tauri Light:dark cycle,LD global’, ‘Ostreococcus tauri Light:dark cycle,LD phospho’, ‘Ostreococcus tauri dark adaptation,DA global’ and ‘Ostreococcus tauri dark adaptation,DA phospho’).
Conflicts of Interest
The authors declare no competing financial interests.
EXPANDED VIEW Level 3
Expanded View Table 1. Proteins quantified under LD.
Expanded View Table 2. Phosphopeptide Motifs (PMs) quantified under LD.
Expanded View Table 3. GO enrichment among RNA, proteins and PMs contributing to PCA.
Expanded View Table 4. GO enrichment among RNA, proteins and PMs in clusters. Individually-significant, rhythmic protein profiles are considered, to provide sufficient numbers for enrichment analysis. Only BH-corrected significant PM profiles with >1.5-fold changes are considered.
Expanded View Table 5. GO enrichment among rhythmic proteins and PMs by peak/trough times. Only BH-corrected significant protein or PM profiles with >1.5-fold changes are considered.
Expanded View Table 6. Proteins quantified under DA.
Acknowledgements
We are very grateful to K. Kis, L. Imrie and D. Kelly for expert technical help, to G. van Ooijen and B. Kolody for helpful discussion, and to M. Hirsch-Hoffmann and K. Baerenfaller for support on pep2pro. Supported by the Biotechnology and Biological Sciences Research Council (award BB/J009423/1).
REFERENCES
- 1.↵
- 2.↵
- 3.↵
- 4.↵
- 5.↵
- 6.↵
- 7.↵
- 8.↵
- 9.↵
- 10.↵
- 11.↵
- 12.↵
- 13.↵
- 14.↵
- 15.↵
- 16.↵
- 17.↵
- 18.↵
- 19.↵
- 20.↵
- 21.↵
- 22.↵
- 23.
- 24.
- 25.
- 26.↵
- 27.↵
- 28.↵
- 29.↵
- 30.
- 31.↵
- 32.↵
- 33.↵
- 34.↵
- 35.↵
- 36.↵
- 37.↵
- 38.↵
- 39.↵
- 40.↵
- 41.↵
- 42.↵
- 43.↵
- 44.
- 45.
- 46.↵
- 47.↵
- 48.↵
- 49.↵
- 50.↵
- 51.
- 52.↵
- 53.↵
- 54.↵
- 55.↵
- 56.↵
- 57.↵
- 58.↵
- 59.↵
- 60.↵
- 61.↵
- 62.↵
- 63.↵
- 64.↵
- 65.↵
- 66.↵
- 67.↵
- 68.↵
- 69.↵
- 70.↵
- 71.↵
- 72.↵
- 73.↵
- 74.↵
- 75.↵
- 76.↵
- 77.↵
- 78.↵
- 79.↵
- 80.↵
- 81.↵
- 82.↵
- 83.↵
- 84.↵
- 85.↵
- 86.↵
- 87.↵
- 88.↵
- 89.↵
- 90.↵
- 91.↵
- 92.↵
- 93.↵
- 94.↵
- 95.↵
- 96.↵
- 97.↵
- 98.↵


