

Abstract
Crossmodal redundancy increases both the speed and accuracy of communication (Evans & Treisman, 2011). For example, rattlesnakes hold their tail aloft when rattling, ensuring that it is both seen and heard. This combined audio-visual display is harder to miss or misinterpret than either movement or rattling alone. Perceivers’ brains must be sensitive to such crossmodal redundancies in order to take advantage of them. One possible adaptation for this purpose is the use of a single neural code shared by both auditory and visual information. To test for such a shared neural code, we created emotionally expressive animation and music stimuli that were precisely matched on all of their dynamic features. Participants viewed these stimuli during fMRI brain scanning. Using representational similarity analysis (Kriegeskorte & Kievit, 2013), we show that a single model of stimulus features and emotion content fits activity in both auditory and visual brain areas. This code is also used supramodally in posterior superior temporal cortex, and is used to represent both prototypical and mixed emotions (e.g., Happy-Sad). Exploratory analysis revealed that stimulus features and emotion content are represented in unimodal areas even when stimuli are presented in the area’s non-preferred modality. This evidence for a shared neural code is consistent with adaptive signaling accounts of emotion perception, in which perceivers specifically adapted to perceive crossmodal redundancy accrue an evolutionary advantage.
Introduction
From Shakespeare’s Hamlet, to Jane Austen’s Emma, to Disney’s Frozen, communicative misunderstanding is the mainspring of human drama. This may be rooted in humanity’s evolutionary history. As a radically social species, our survival depends on the ability to quickly understand others’ thoughts and feelings (Allport, 1924; Tooby & Cosmides, 1990). This is no easy task, as communication transpires across a noisy channel—imprecise gestures, sounds, and speech, must pierce through a chaotic environment to maximize their chances of perception by distracted and inattentive observers. Effective communication requires expressive signals that can survive the noisy channel, and brains adapted to perceive them (Dezecache, Mercier, & Scott-Phillips, 2013; Huron, 2012; Lorenz, 1970). Consistent with this adaptive signaling account of emotion expression (Hebets et al., 2016; Huron, 2012), previous research has revealed that emotion expressions are strikingly similar across music and movement (Sievers, Polansky, Casey, & Wheatley, 2013). If this crossmodal redundancy is exploited by perceivers (Hebets et al., 2016; Johnstone, 1996, 1997), we should observe a tight fit between the structure of emotion expressions and their representation in perceving brains.
We tested two hypotheses: (1) that both auditory and visual areas encode emotion expressions using the same parameters—i.e., they share a representational geometry (Kriegeskorte & Kievit, 2013)—and (2) that auditory and visual expressions of emotion are represented together in one brain area using a supramodal neural code.
A model capturing both dynamic (i.e., time-varying) stimulus features and emotional meaning fit activity in both auditory and visual areas, supporting hypothesis (1). The same model fit activity in posterior superior temporal gyrus (pSTG) during both auditory and visual emotion expressions, supporting hypothesis (2). Additional exploratory analysis showed that auditory and visual areas represent stimulus features and emotion content even when stimuli are presented in each area’s non-preferred modality. These results support an adaptive signaling account of emotion perception, where the structure of emotional signals and the brains of receivers have adapted to tightly fit one another, facilitating efficient and reliable signal perception.
Previous research on neural representation of emotion
Emotion-related neural processes are distributed across a wide range of brain areas, with each area implicated in the production and/or perception of a range of emotions (Lindquist, Wager, Kober, Bliss-Moreau, & Barrett, 2012; Wager et al., 2015). However, certain aspects of emotion processing are tightly localized. Lesion and neuroimaging studies have demonstrated that some brain areas play a role in the processing of specific emotions; for example, the amygdala for the conscious recognition of fearful stimuli (Adolphs, Tranel, Damasio, & Damasio, 1994; Tsuchiya, Moradi, Felsen, Yamazaki, & Adolphs, 2008), and the insula for recognizing disgust (Calder, Lawrence, & Young, 2001; Phillips et al., 1997).
Our hypotheses ask not only where in the brain emotions are represented, but how those representations are structured. For example, a single brain area may distinguish between emotions using different spatial patterns of activity that all have the same mean. To characterize the representational properties of these areas, it is necessary to use techniques that are sensitive to such spatially distributed patterns; e.g., multivariate pattern classification (Norman, Polyn, Detre, & Haxby, 2006) or representational similarity analysis (RSA; Kriegeskorte & Kievit, 2013). Below, we summarize previous research taking a multivariate approach.
Peelen et al. (2010) found that patterns of activation in the medial prefrontal cortex (mPFC) and posterior superior temporal sulcus (pSTS) had greater within-emotion similarity than between-emotion similarity across modalities, indicating these areas supramodally represent emotion identity. Chikazoe et al. (2014) found supramodal directional valence (i.e., positive vs. neutral vs. negative) representations in medial and lateral orbitofrontal cortex (OFC), alongside modality-specific directional valence representations for visual scenes in ventral temporal cortex, and for tastes in anterior insular cortex. Skerry & Saxe (2015) presented written stories depicting characters experiencing many different emotions. They found a model fitting 38 appraisal features (e.g., “Did someone cause this situation intentionally, or did it occur by accident?”) fit activity in dorsal and middle medial prefrontal cortex, the temporoparietal junction, and a network of regions identified by a theory of mind localization task. Kim et al. (2017) presented emotional movie clips and orchestral music, finding a range of supramodal representations: valence direction in the precuneus, valence magnitude in mPFC, STS, and middle frontal gyrus (MFG), and both valence direction and magnitude in the STS, MFG, and thalamus.
Experimental paradigm
The present work builds on the foundation of previous research in several ways. Our stimuli consisted of short clips of music and animation in which the depicted object—a piano or a bouncing ball—was held constant, and emotion was communicated solely by varying stimulus features. This ensured emotion processing requirements were uniform across the stimulus set. By contrast, collections of images or movies depicting emotionally charged scenes (e.g., the International Affective Picture System; Lang, Bradley, & Cuthbert, 2008) may require a wide variety of processes for emotion evaluation, including moral judgment, memory, and so on.
Stimuli were created by participants in a previously documented experiment (Sievers et al., 2013), who manipulated five stimulus features (speed, irregularity, consonance/spikiness, ratio of big-to-small movements, ratio of upward-to-downward movements) to generate five emotions (Angry, Happy, Peaceful, Sad, Scared). This approach distinguishes between emotions with similar valence, such as Angry and Sad or Happy and Peaceful. The stimulus set was augmented by linearly mixing the features of each emotion pair, creating mixed emotions (e.g., Happy-Sad). Emotions were mixed at 25%, 50%, and 75%. Three additional, “neutral” emotions were identified by searching for points in the stimulus feature possibility space that were distant from all emotions. Music and animation were matched, such that for each musical stimulus there was an animation stimulus with analogous features. This process yielded 76 total stimulus classes, including both music and animation. All stimuli are available at https://osf.io/kvbqm/. A separate set of participants judged how well each stimulus fit all five emotion labels, and a subset of these participants viewed many music and animation stimuli while undergoing fMRI scanning (Figure 1).
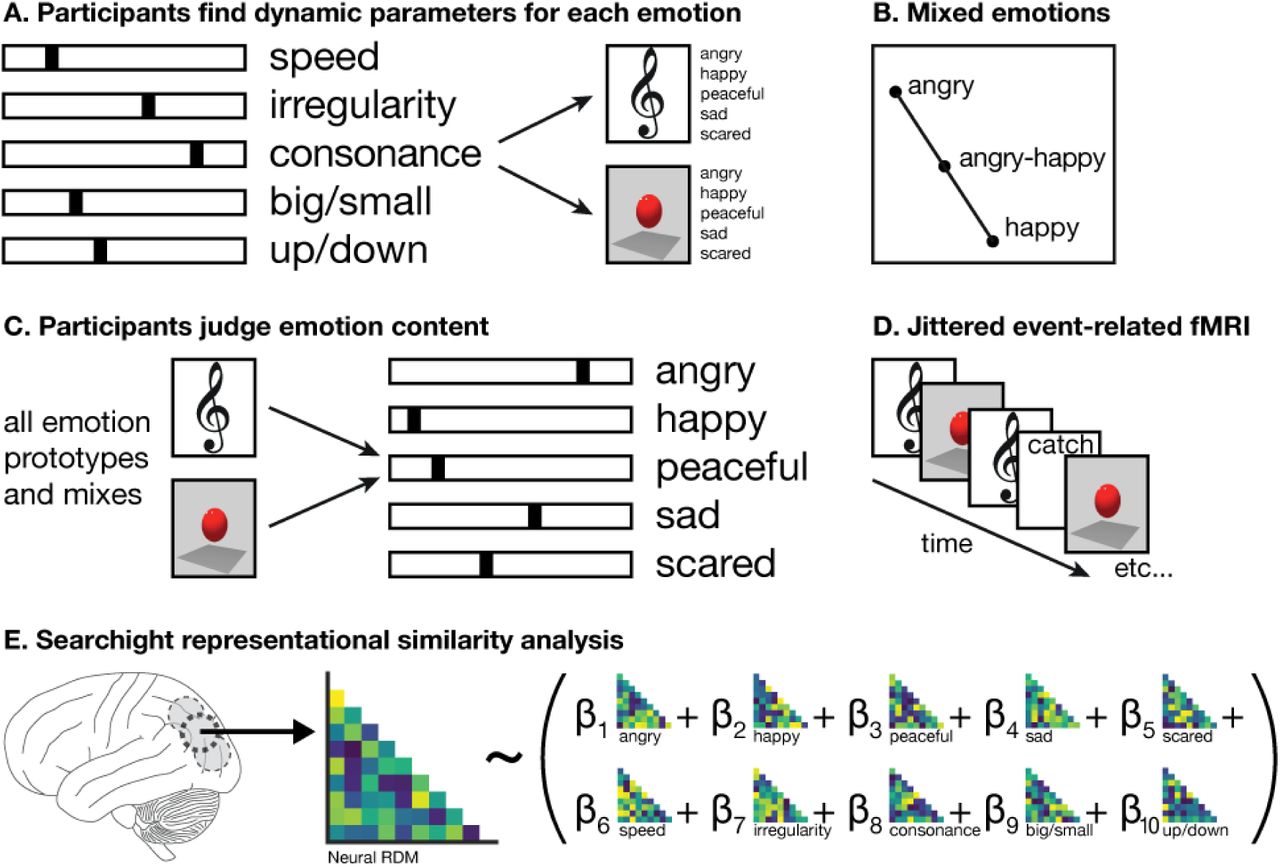
Experimental paradigm. A. Participants in Sievers et al. (2013) manipulated stimulus features to generate music and animation expressing five prototypical emotions: Angry, Happy, Peaceful, Sad, and Scared. B. Mixed emotions were generated by linear interpolation between the stimulus features of prototypical emotions. C. Participants judged the emotion content of many prototypical and mixed emotions in music and animation. D. A subset of participants viewed many prototypical and mixed emotions in music and animation while undergoing jittered event-related fMRI scanning. E. Results were analyzed using searchlight representational similarity analysis (Kriegeskorte et al., 2006, 2008; Kriegeskorte & Kievit, 2013). For each searchlight sphere, the structure of the neural representational dissimilarity matrix (RDM) was predicted using a linear combination of stimulus feature and emotion judgment RDMs.
The approach described above enabled the use of an exhaustively complete model, including both stimulus features and participants’ judgments of emotion content. All inter-stimulus differences were dependent upon parameters explicitly represented in this model. The fitness of the model to activity across the brain during vision and audition was evaluated using searchlight representational similarity analysis (Kriegeskorte, Goebel, & Bandettini, 2006; Kriegeskorte & Kievit, 2013; Kriegeskorte, Mur, & Bandettini, 2008).
Results
Representational Similarity Analysis
We created 10 model representational dissimilarity matrices (RDMs): five based on the parameter settings used to create the stimuli (speed, irregularity, consonance/spikiness, ratio of big-to-small movements, ratio of upward-to-downward movements), and five based on the emotion judgments of our behavioral participants (Angry, Happy, Peaceful, Sad, and Scared). Each RDM captured the distance between every pair of stimuli in terms of a single stimulus feature or emotion judgment parameter (Supplementary Figure 1). RDMs were constructed such that that our model was not sensitive to differences in the mean level of BOLD activity between music and animation trials. This was achieved by using a distance measure for constructing the neural RDMs that is insensitive to mean activity level (as described in more detail below). In addition, the same stimulus feature parameter settings were used to create both music and animation stimuli, and emotion judgments were averaged across music and animation to create the model RDMs. This ensured that the modeled distance between any two music stimuli was always equal to the modeled distance between the corresponding animation stimuli, and that the mean distance between music stimuli was equal to the mean distance between animation stimuli.
To test hypotheses (1) and (2), we performed a searchlight representational similarity analysis (Kriegeskorte et al., 2006, 2008). Within each searchlight sphere we calculated the Spearman correlation distance between each pair of stimulus-dependent patterns of BOLD activity to create a neural RDM. To assess how the neural RDM could be expressed as a linear combination of our model RDMs, we fit a multiple regression model using our 10 model RDMs as predictors and the neural RDM as the target. Because we used Spearman correlation to calculate neural RDMs, predictor RDMs were likewise ranked before regression. We ran this analysis twice—first, using only music trials to create the neural RDM, then using only animation trials. The critically important feature of this analysis is that it does not model vision and audition separately. Instead, it tests the fitness of a single model to brain activity evoked by stimuli in two different sensory modalities.
The model explained variance in a range of visual and auditory brain regions, providing strong support for hypothesis (1), that these regions share a common representational geometry (Figure 3; Table 1). The mean of individual peak model fits was in the lingual gyrus for animation trials (M=.31; 95% CI: .24-.38; t(19)=9.2; p<.001) and in bilateral anterior superior temporal gyrus for music trials (M=.26; 95% CI:.21-.31; t(19)=10.95; p<.001).). The magnitude and anatomical location of the peak model fit were consistent across participants (Supplementary Figures 2 and 3). The peak of the average model fit across participants was in the medial lingual gyrus for animation trials (M=.16; 95% CI:.1-.23; t(19)=5.13; p < .001; all p-values corrected at FWER=.05) and in bilateral anterior superior temporal gyrus for music trials (M=.16; 95% CI: .11-.21; t(19)=6.65; p < .001). Because of small differences in functional anatomy across participants, the peak of the average model fit is a very conservative estimator of individual model fit. Importantly, beta weights for all dynamic and emotion parameters were significant at these peak locations, indicating that model fit was not driven solely by any individual stimulus feature or emotion (see Supplementary Figures 5 and 6).

Highlighted brain areas fit a model including stimulus features and emotion judgments during animation trials (blue), music trials (green), and both trial types (yellow). Neural dissimilarity matrices show pairwise similarity of activity patterns evoked by each stimulus at the locations of best model fit (circled)–medial lingual gyrus (animation) and lateral superior temporal gyrus (music). Fully-labled verions of these matrices are shown in Supplementary Figure 7. Multidimensional scaling flattens these dissimilarity matrices to two dimensions, so the distance between dots reflects the similarity of patterns of neural activity. Dots are colored by mixing the legend colors based on participants’ judgments of the emotion content of each stimulus.
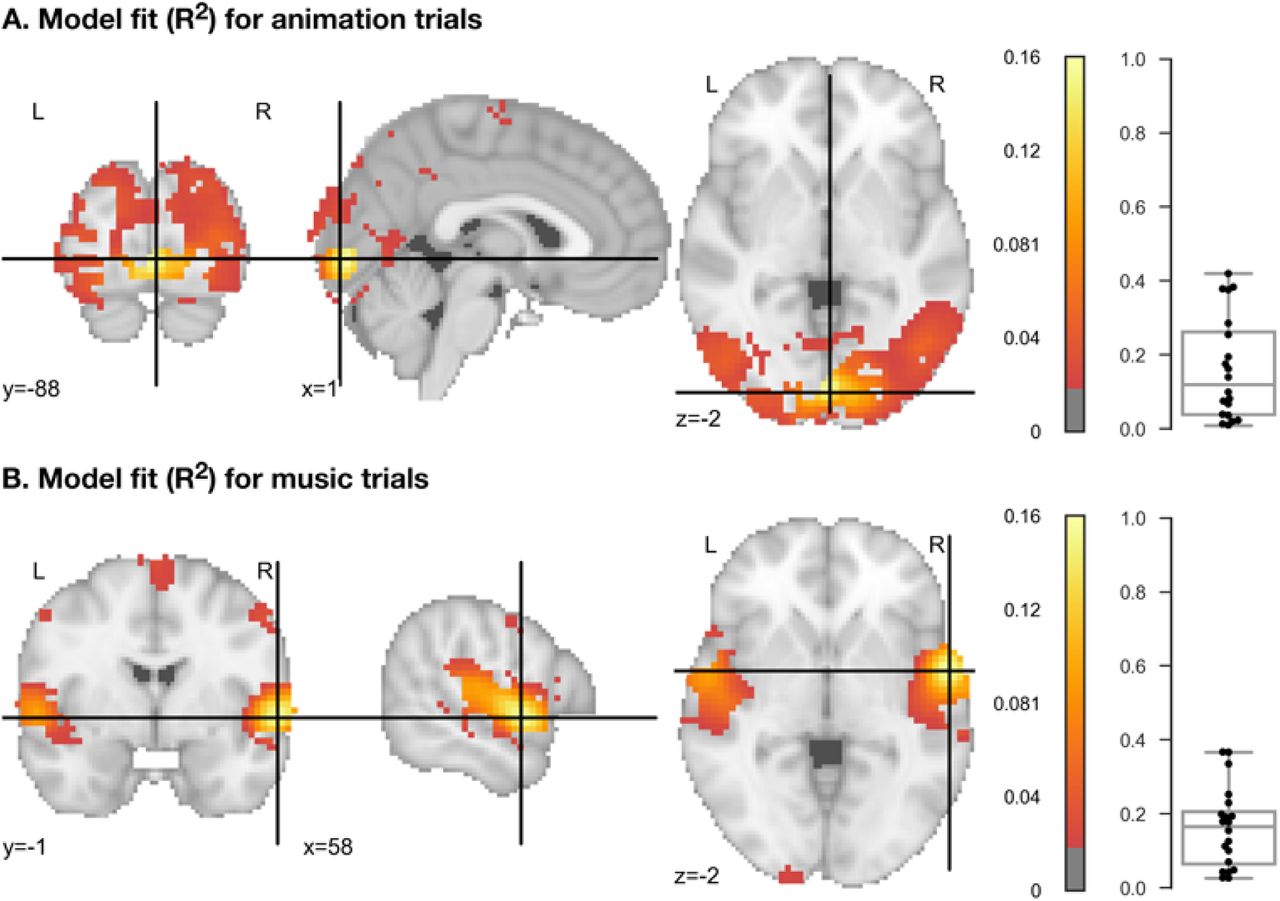
Maps of the mean coefficient of determination (R2) across participants. The model included 5 stimulus feature parameters and 5 emotion judgment parameters, and was separately fit to animation and music trials. Maps thresholded at voxelwise FWER=.05. R2 values < .02 hidden for visual clarity. Box plots show per-participant R2 values at the location of best model fit at the group level. For per-parameter beta weights, see Supplementary Figures 5 and 6.
Brain regions fitting the stimulus feature and emotion judgment model during animation trials.
Brain regions fitting the stimulus feature and emotion judgment model during music trials.
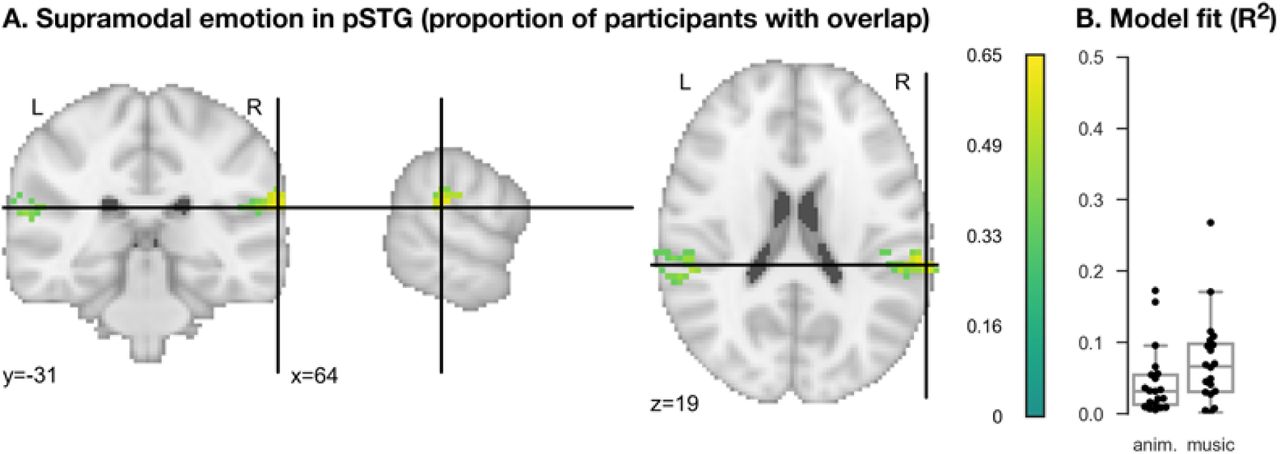
To locate brain regions representing emotion supramodally, we created binary overlap masks per-subject, selecting voxels where our model explained a meaningful amount of variance (R2>.02) for both music and animation trials. These masks were averaged to map the proportion of participants with supramodal representations in each voxel. This procedure is more conservative and provides more detail than creating a simple binary conjunction map based on the group-level statistics, with no risk of increased false positives. Supramodal representations were found in bilateral posterior superior temporal gyrus (pSTG) in 65% of participants (p < .001), providing support for hypothesis (2) (Fig 4). Group level model fits in each unimodal analysis were also significant at this location (animation mean R2=.04, 95% CI: .02-.07, t(19)=4.25, p<.001; music mean R2=.07, 95% CI: .05-.1, t(19)=5.3, p<.001). Due to individual differences in functional anatomy, this procedure underestimates the proportion of participants with supramodal emotion representations. Manual inspection of the overlap masks showed supramodal emotion representations in pSTG were consistent across participants, and that some participants showed additional supramodal representations in other areas, including the right inferior frontal gyrus (Supplementary Figure 4).

A. Binary overlap masks were created per participant, selecting voxels voxels that were significant at the group level for both music and animation trials. Maps show the voxelwise average of these overlap masks, expressing the proportion of participants representing emotion in music and animation in the same brain areas. Maps thresholded at voxelwise FWER=.05. R2 values < .02 hidden for visual clarity. B. Box plots show R2 for music and animation trials at the location where most participants exhibited supramodal emotion representations.
Brain regions fitting the stimulus feature and emotion judgment model during both music and animation trials.
Exploratory intermodal RSA
To find brain areas representing emotion even when stimuli are presented in the non-preferred modality, we performed an exploratory intermodal RSA that used RDMs containing only between-modality distances. To build the neural target RDM, we took the rank correlation between patterns of activity elicited when each emotion was presented as music and when each emotion was presented as animation (Figure 5A). Model RDMs were built using an analogous procedure, and were rank-ordered before analysis. Note that because within-modality pairs were excluded, all intermodal RDMs were square, corresponding to the lower-left square region of the larger triangular RDM created using stimuli from both modalities. If a brain area is inactive when stimuli are presented in its non-preferred modality, then the intermodal neural RDM should be uncorrelated with the intermodal model RDMs. If a brain area is active, even weakly, and representing emotion content, its intermodal neural RDM should be correlated with the intermodal model RDMs.

Intermodal model fit. We created behavioral and neural intermodal RDMs to locate brain areas representing emotion even when stimuli were presented in that area’s non-preferred modality. A. Intermodal RDMs capture the stimulus feature, emotion judgment, or neural pattern distances between music and animation expressing the same emotion. The intermodal RDM is the lower-left square of the the full RDM created using both music and animation. B. Intermodal model fit, thresholded at FWER=.05. R2 values < .04 hidden for visual clarity. Box plot shows per-participant R2 values at the location of best model fit at the group level.
The intermodal RSA revealed a bilateral set of areas across occiptal, superior parietal, temporal, cingulate, and frontal cortex that represented emotions presented in the non-preferred modality (Figure 5B; Table 4). Note that some of these areas did not show significant unimodal model fit. Peak intermodal model fit was in right lingual gyrus (M=.29; 95% CI: .21-.38; t(19)=7.07; p < .001). Notably, the peak intermodal model fit exceeded the peak within-modality model fit for both music and animation.
Brain regions fitting intermodal model; i.e., regions which fit the stimulus feature and emotion judgment model even when the stimulus is presented in the non-preferred modality.
Unthresholded statistical maps
All unthresholded statistical maps are available at https://neurovault.org/collections/3399/.
Discussion
On adaptive signaling accounts of emotion perception (Dezecache et al., 2013; Hebets et al., 2016; Huron, 2012; Lorenz, 1970), the human brain should show adaptations specific to the crossmodally redundant structure of emotion expression. To investigate this, we tested two hypotheses: (1) that auditory and visual brain areas encode emotion expressions using the same underlying parameters, and (2) that in some brain areas, auditory and visual expressions of emotion are represented using a single, supramodal neural code. We tested these hypotheses by fitting a single model that captured stimulus features and emotion judgments to brain activity evoked by both auditory and visual stimuli. Critically, although this model treated auditory and visual stimuli exactly the same way, it fit brain activity in both auditory and visual sensory brain areas, indicating these regions use the same neural code for emotion, supporting hypothesis (1). The same model fit activity in pSTG during both animation and music trials, indicating the presence of a supramodal emotion representation, supporting hypothesis (2). Exploratory intermodal representational similarity analysis showed that low-level visual and auditory areas represent stimulus features and emotion content even when presented in their non-preferred modality.
Previous studies have shown multimodal processing in unimodal areas (for reviews, see Bulkin & Groh, 2006; Ghazanfar & Schroeder, 2006; Kayser & Logothetis, 2007), which may depend on direct inter-areal projections between unimodal regions (Cappe & Barone, 2005; Falchier, Clavagnier, Barone, & Kennedy, 2002; Rockland & Ojima, 2003). Critically, our results extend this account by showing that crossmodal perception is the product not only of operations in association cortices or activity dependent on inter-areal projections, but of the use of a neural code that is shared across modalities.
Widespread tuning of low-level sensory representations to the structure of emotion expressions shows that the need to identify such signals has exerted a profound shaping force on low-level perceptual processes. We do not see or hear the actions of others as raw sense impressions first, and later encode them as communicating emotion after a chain of intermediary processing steps occuring in encapsulated cognitive modules (Firestone & Scholl, 2016; Fodor, 1985). Rather, we begin accumulating evidence for an emotional intepretation from the lowest levels of sensory processing.
Supramodal representation in pSTG/pSTS
Our findings in pSTG overlap with previously reported pSTS activation during action understanding (Beauchamp, Lee, Argall, & Martin, 2004; Wyk, Hudac, Carter, Sobel, & Pelphrey, 2009) and emotion perception tasks (Kreifelts, Ethofer, Grodd, Erb, & Wildgruber, 2007; Robins, Hunyadi, & Schultz, 2009; Watson et al., 2014). The pSTS also exhibits greater activation for combined audio-visual presentation than for either modality alone (Beauchamp et al., 2004; Wright, Pelphrey, Allison, McKeown, & McCarthy, 2003), and the amplitude of these responses predicts object categorization performance (Werner & Noppeney, 2010). Damage to the pSTS does not impair voice recognition (Jiahui et al., 2017), suggesting its representations are downstream from low-level feature detectors. Alongside these results, our findings are consistent with the hypothesis that the pSTG/pSTS acts as a general-purpose hub for transforming unimodal inputs into a common supramodal representation (Schirmer & Adolphs, 2017). Interestingly, visual and auditory selectivity in pSTS are linked, with areas sensitive to moving mouths responding strongly to voices, but not non-vocal sounds (Zhu & Beauchamp, 2017). This suggests crossmodal selectivity in pSTS may be shaped by co-occurence statistics in the environment.
Limitations and future directions: toward comprehensive experiments and models
The present study was designed only to test a shared code for emotion across vision and audition. We do not claim that a single model including only crossmodal stimulus features and emotion judgments can explain all of the meaningful variance in brain activity during emotion perception. However, we do think explaining all of this variance is a laudable goal. In order to achieve it, researchers will need to run experiments that include a wide range of emotion perception tasks, and evaluate their data using equally comprehensive models that include task-specific information.
For example, while the stimuli in our study expressed emotion using configurations of stimulus features, emotions may also be read from semantic content (Chikazoe et al., 2014; Kim et al., 2017; Skerry & Saxe, 2015). The emotional meanings of stimuli used in semantic emotion perception studies (e.g., detailed written stories; images from the International Affective Picture System, Lang et al., 2008) depend on participants recognizing what is depicted and why it is emotionally relevant. This is fundamentally different from reading emotional meaning from stimulus features, as in movement or prosody. Our experiment used music and animation in which the depicted object was held constant, and relatively low-level stimulus features were manipulated to express a wide range of emotions. Studies that seek to explain the maximum amount of variance in brain activity will need comprehensive experiments that impose both semantic and perceptual processing demands.
We anticipate that advances in automatic feature extraction (McNamara, Vega, & Yarkoni, 2017) will enable the use of naturalistic stimuli and complex models spanning not only the stimulus feature and emotion spaces examined here, but also additional dimensions of semantic meaning, context dependence, self- and other-relevance, appraisal features, and so on. Such future experiments will be the best of both (or many) worlds, allowing researchers to disentangle the underlying mechanisms supporting emotion perception.
Adaptive signaling vs. “peg fits hole”
One possible reading of these results is that humans have evolved neural detectors specific to the structure of emotion expressions, and that these are present from birth. On this “peg fits hole” interpretation, any sensory input with the right structure should be detected and interpreted as an emotion expression. While this may be true in some basic cases, such as infants’ reactions to shouting or motherese, cross-cultural variation in emotion expressions places a limit on the “peg fits hole” interpretation. Although emotion expressions across cultures share structural features supporting mutual intelligibility (Ekman, 1992; Jack, Sun, Delis, Garrod, & Schyns, 2016; Sievers et al., 2013), there are also substantial cross-cultural differences (Jack, Caldara, & Schyns, 2012; Jack et al., 2016; Yuki, Maddux, & Masuda, 2007). The neural mechanisms supporting emotion perception must therefore flexibly accommodate culture-specific emotion dialects and display rules. These mechanisms need not be present from birth, and need not be specific to emotion. Rather, emotion perception may exploit statistical learning and predictive coding processes (Clark, 2013; Saffran, Aslin, & Newport, 1996), or may arise later in development, emerging from cognitive strategies for coping with a complex social world (Blakemore, 2008). On this account, the structure of emotion expressions, the brains of emotion perceivers, and their cultural-environmental niche are interlinked and evolve together. The cross-cultural intelligibility of emotion expressions can be explained by globally shared contextual factors, including the evolutionary inheritance of the human body, the challenge of cooperating with others in a dangerous, unpredictable, resource-limited world, and the related need to estimate others’ internal states. Cross-cultural differences can be understood as path-dependent adaptations specific to a regional cultural-environmental niche.
Conclusion
The structure of emotion expressions is shared across music and movement and is tightly coupled to meaning. This is reflected in the organization of the brain: the same neural code is used to represent emotion in auditory, visual, and supramodal areas. Surprisingly, unimodal auditory and visual areas represent stimuli shown in their non-preferred modality. Such efficient organization is consistent with the adaptive signaling account of emotion perception. This theory predicts both that emotion signals be crossmodally redundant in order to survive communication across a noisy channel, and that receivers be specifically adapted to the crossmodal nature of the signal’s structure. In other words, human emotion perception is optimized “end-to-end”—all levels of the processing hierarchy are tuned to support the social goal of understanding the emotional states that predict others’ behavior.
Materials and Methods
Participants
79 participants (47 female) were recruited from the Dartmouth College student community to participate in the emotion evaluation task (experiment 1). 20 of these participants (11 female) also participated in the fMRI of emotion viewing task (experiment 2). All fMRI participants were right-handed and had normal or corrected-to-normal vision. All participants provided written informed consent, and the study was approved by the Dartmouth College Committee for the Protection of Human Subjects.
Stimuli
Emotion stimuli were generated using an amodal dynamic model of movement across a number line with five parameters: speed, irregularity, consonance/spikiness, ratio of big-to-small movements, and ratio of upward-to-downward movements. Model output was mapped to either simple piano melodies or the movement of an animated bouncing ball. Each time the model was run, it probabilistically generated a new stimulus based on the current parameter settings. Participants in (Sievers et al., 2013) (music N=25, movement N=25, total N=50) used this model to express five emotions: Angry, Happy, Peaceful, Sad, and Scared. For each emotion, parameter settings were similar for both music and movement. Details of the model are described in Sievers et al. (2013). All stimuli are available at https://osf.io/kvbqm/.
To reduce the influence of outliers, the median parameter settings across music and movement were used to generate stimuli for the present experiments. In addition to the five prototypical emotions listed above, we created mixed emotion stimuli by interpolating linearly between the parameter settings for each emotion pair; 25%, 50%, and 75% mixes were used. We also added three putatively “neutral” or “non-emotional” parameter settings selected to be distant from all other stimuli. “Search One” and “Search Four” were selected by a Monte Carlo search algorithm, and consisted of extreme values for all five parameters. “Biggest Gap” was created by selecting the midpoint of the largest gap between the five prototypical emotions and the parameter endpoints.
For each prototypical, mixed, and “non-emotional” parameter setting in each modality, we generated 20 exemplars, for a total of 1,520 stimuli (38 emotions x 2 modalities x 20 exemplars). Because stimuli were created using a probabilistic method, all exemplars were compared to a larger, separate sample of 5000 same-emotion examples to ensure no stimulus was further than one standard deviation from the category mean along any parameter.
Experiment 1 (emotion evaluation)
Participants (N=79, 47 female) evaluated the emotion content of the stimuli. Stimuli were presented using a computer program that displayed five slider bars, one for each emotion prototype (Angry, Happy, Peaceful, Sad, and Scared). The on-screen order of slider bars and emotion stimuli were randomized across participants. Participants viewed or listened to each stimulus at least three times, and were asked to use the slider bars to evaluate what emotion or mix of emotions the stimulus expressed.
Experiment 2 (fMRI of emotion viewing)
During each fMRI run, participants (N=20, 11 female) viewed 18 randomly selected exemplars from each of the 76 stimulus classes described above. Each stimulus class was shown once per run, and participants completed 18 runs across 3 separate scanning sessions (~3 hours of scan time, 1,368 stimulus impressions). Each scan session was scheduled for approximately the same time of day, and no more than one week elapsed between scan sessions.
Stimuli were truncated to 3s in duration and followed by fixation periods of randomly varying duration (range: 0.5s–20s). The ratio of simulus presentation to fixation was 1:1. A Monte Carlo procedure was used to select separate, optimized stimulus presentation orderings and timings for each participant. This procedure used AFNI make_random_timing.py to generate thousands of possible stimulus timings, and AFNI 3dDeconvolve to select the timings that best supported deconvolving unique patterns of brain activity for each stimulus. Stimuli were presented using PsychoPy (Peirce, 2007). Participants were instructed to attend to the emotion content of the stimuli. During randomly interspersed catch trials (10 per run), participants used a button box to rate on a four-point scale whether the most recently presented stimulus had emotion content that was “more mixed” or “more pure.” To ensure familiarity with the stimuli, all fMRI participants had previously completed the emotion evaluation task.
fMRI acquisition
Participants were scanned at the Dartmouth Brain Imaging Center using a 3T Phillips Achieva Intera scanner with a 32-channel head coil. Functional images were acquired using an echo-planar sequence (35ms TE, 3000ms TR; 90° flip angle; 3×3×3mm resolution) with 192 dynamic scans per run. A high resolution T1-weighted anatomical scan (3.7 ms TE; 8200ms TR; .938x.938×1mm resolution) was acquired at the end of each scanning session. Sound was delivered using an over-ear headphone system. Foam padding was placed around participants’ heads to minimize motion.
fMRI preprocessing
Anatomical images were skull-stripped and aligned to the last TR of the last EPI image using AFNI align_epi_anat.py. EPI images were aligned to the last TR of the last EPI image using AFNI 3dvolreg. Rigid body transformations for aligning participants’ anatomical and EPI images to the AFNI version of the MNI 152 ICBM template were calculated using AFNI @auto_tlrc. Alignment transformations were concatenated and applied in a single step using AFNI 3dAllineate. EPI images were scaled to show percent signal change and concatenated. EPI images were not smoothed. The general linear model was used to estimate BOLD-responses evoked by each of the 76 emotional stimulus classes usingAFNI 3dREMLfit.
Representational similarity analysis
Representational similarity analysis (RSA) (Kriegeskorte et al., 2006, 2008) was conducted using PyMVPA (Hanke et al., 2009) and Scikit-Learn (Pedregosa et al., 2012). Stimulus feature representational distance matrices (RDMs) for each of the parameters described in (Sievers et al., 2013) (speed, irregularity, consonance/spikiness, ratio of big-to-small movements, ratio of upward-to-downward movements) were created by calculating the Euclidean distances between the slider bar settings for each pair of emotions. Emotions in music and animation were created using the same slider bar settings, making it unecessary to create modality-specific feature RDMs. Emotion RDMs were created by calculating the Euclidean distance between the mean of each emotion judgment parameter in experiment 1 (Angry, Happy, Peaceful, Sad, and Scared) for each pair of stimuli. Emotion judgments were averaged across music and animation, making it unnecessary to create modality-specific emotion judgment RDMs. Intermodal RDMs were built by calculating the full multi-modality RDM including both music and movement stimuli and selecting its lower-left square region (Figure 5A). Because the music and animation stimuli were created using the same slider bar settings, and because emotion judgments were averaged across modality, the mean distance between music stimuli was equal to the mean distance between animation stimuli. This ensured our analyses would not be sensitive to mean differences in BOLD activity between music and animation.
Representational similarity analysis was seperately conducted for music trials, animation trials, and (for the intermodal analysis) music and animation trials together. Each analysis used a spherical searchlight with a 3-voxel (9mm) radius. For music and animation trials, we calculated a neural RDM in each searchlight sphere by measuring the correlation distance between each estimated stimulus-evoked pattern of activation within modality. Intermodal neural RDMs were created as described above, using neural data instead of stimulus features or emotion judgments (Figure 5A).
Multiple regression using least squares was used to assess how the neural RDM in each seachlight sphere could be expressed as a linear combination of our stimulus feature and emotion judgment RDMs. RDMs were rank-ordered before model fitting. This procedure generated beta weight and coefficient of determination (R2) maps for each participant, for each analysis. To locate areas fitting our model during both music and animation trials, per-participant overlap maps were created by identifying voxels where both music and animation model fit exceeded .02 and where the group level model fit was significant at FWER=.05. Group level maps were calculated and corrected for multiple comparisons at voxelwise FWER=.05 using a maximum statistic permutation testing method using BROCCOLI (Eklund, Dufort, Villani, & Laconte, 2014; Eklund, Nichols, & Knutsson, 2016). If a voxel survived permutation testing to appear in the group level map, then it had a high model fit in a significant number of individual participants. Maps were visualized using Nilearn (Abraham et al., 2014) and AFNI SUMA (Saad, Reynolds, Argall, Japee, & Cox, 2004). All unthresholded statistical maps are available at https://neurovault.org/collections/3399/.
Acknowledgements
We thank Sam Nasatase and Matteo Visconti di Oleggio Castello for helpful comments during the writing process, and Paulina Calcaterra, Rebecca Drapkin, Caitlyn Lee, Elizabeth Reynolds, Tshibambe Nathanael Tshimbombu, and Kelsey Wheeler for assistance collecting fMRI data. This research was supported in part by the John Templeton Foundation and the Neukom Institute for Computational Science.


