

Abstract
T-cell acute lymphoblastic leukemia (T-ALL) is an aggressive disease, affecting children and adults. Treatments1-6 show high response rates but have debilitating effects and carry risk of relapse5,7,8. Previous work implicated NOTCH1 and other oncogenes1,2,9-20. However, direct inhibition of these pathways affects healthy tissues and cancer alike. Here, we demonstrate that ubiquitin-specific protease 7 (USP7)21-32 controls leukemia growth by stabilizing the levels of the NOTCH1 and JMJD3 demethylase. USP7 is overexpressed T-ALL and is transcriptionally regulated by NOTCH1. In turn, USP7 controls NOTCH1 through deubiquitination. USP7 is bound to oncogenic targets and controls gene expression through H2B ubiquitination and H3K27me3 changes via stabilization of NOTCH1 and JMJD3. We also show that USP7 and NOTCH1 bind T-ALL superenhancers, and USP7 inhibition alters associated gene activity. These results provide a new model for deubiquitinase activity through recruitment to oncogenic chromatin loci and regulation of both oncogenic transcription factors and chromatin marks to promote leukemia. USP7 inhibition33 significantly blocked T-ALL cell growth in vitro and in vivo. Our studies also show that USP7 is upregulated in the aggressive high-risk cases of T-ALL and suggest that USP7 expression might be a prognostic marker in ALL and its inhibition could be a therapeutic tool against aggressive leukemia.
Results
Loss of the repressive mark H3K27me3 is important for leukemia initiation and progression14, and NOTCH1 binding to DNA and H3K27me3 loss correlate during leukemogenesis14. Previously, we identified and characterized the pro-oncogenic role of the epigenetic modulator Jumonji D3 (JMJD3)34-37, which mediates NOTCH1 oncogenic function in T-ALL15. JMJD3 is a NOTCH1 interactor and is recruited by NOTCH1 to oncogenic targets. We demonstrated that inhibition of JMJD3, using the small molecule inhibitor GSKJ4, yielded leukemic cytotoxicity, thereby rendering this demethylase an attractive target for pharmacologic development15.
To identify potential NOTCH1/JMJD3-associated proteins and understand NOTCH1 complex stability in leukemia, we retrovirally expressed hemaglutinin (HA) tagged-JMJD3 in CCRF-CEM T-ALL cells. We performed liquid chromatography-tandem mass spectrometry (LC-MS/MS) following immunoprecipitation (IP) of HA-JMJD3 (Fig. 1a). 101 proteins were uniquely associated with HA-JMJD3, and these proteins were enriched in members of the ubiquitin specific protease (USP) family of deubiquitinases (DUBs), including USP7, USP9X, USP24, and USP47 (Fig. 1b, Supplementary Table 1, and Supplementary Fig. 1a). Indeed, gene ontology analysis of the JMJD3 interactome showed enrichment in protein metabolic processes and members of the proteasome complex (Supplementary Fig. 1b).
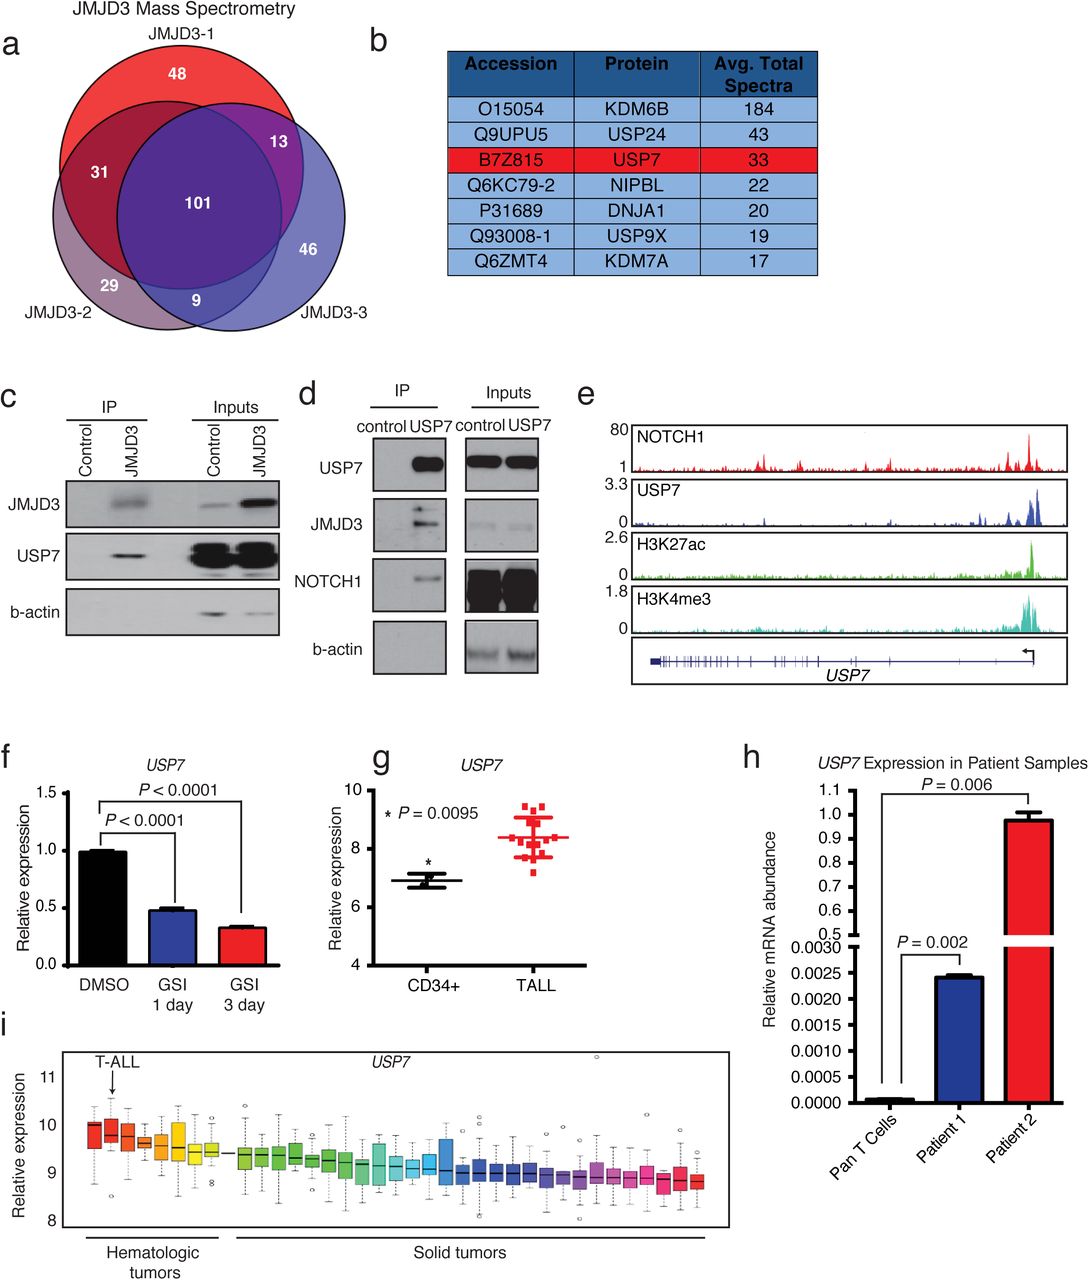
a, HA immunoprécipitation (for HA-tagged JMJD3) followed by mass spectrometry in CCRF-CEM T-ALL cells. Shown is the overlap of HA-JMJD3-asssociated proteins across 3 biological replicates, revealing 101 common proteins associated with HA-JMJD3. b, Top interactors for JMJD3, showing the average spectral count of 3 technical replicates. Members of the USP family are among these top interacting proteins. c, Representative Western blots following immunoprecipitation of HA-JMJD3 in CCRF-CEM T-ALL cells. Control cells express the HA-tagged vector. d, Western blots following immunoprecipitation of USP7 in CUTLL1 T-ALL cells, showing interactions of JMJD3 and NOTCH1 with USP7. e, ChIP-Seq tracks showing NOTCH1 binding in CUTLL1, and USP7, H3K27Ac, and H3K4me3 in JURKAT T-ALL cells, at the USP7 gene. f, Relative mRNA levels of USP7 in CUTLL1 T-ALL cells following treatment with DMSO or 1 μM GSI for 1 and 3 days. Error bars represent the mean ± SD of 3 technical replicates. g, Relative mRNA expression of USP7 in normal human CD34+ (n=2) and patient T-ALL bone marrow cells (n=15) (GSE62144), showing the mean ± SD. h, Relative USP7 mRNA expression in normal T cells (pan T cells) and primary human T-ALL cells. Error bars represent the mean ± SD of technical duplicates. i, Relative mRNA expression of USP7 in different tumor types from the Cancer Cell Line Encyclopedia. RMA = Robust Multi-array Average.
Dynamic NOTCH1 (de)ubiquitination plays a pivotal role in the regulation of NOTCH1 protein levels in leukemia, and ubiquitin ligases such as FBXW7 have been demonstrated to regulate NOTCH1 degradation and are tumor suppressors in T-ALL38,39. To this end, we hypothesized that USPs might be acting as oncogenic cofactors for the NOTCH1 complex, controlling complex stability and, ultimately, transcriptional potency. Ubiquitination occurs through a sequence of enzymatic reactions40 involving the activity of two E1 ubiquitin-activating enzymes, multiple E2 enzymes and hundreds (~700) of E3 enzymes in humans. E3 ligases determine complex specificity. In contrast, DUBs41,42 mainly include the ubiquitin-specific protease superfamily (USP/UBP, 58 members), the ovarian tumor (OUT, 14) superfamily, the Machado-Josephin domain (MJD, 5) superfamily, the ubiquitin C-terminal hydrolase (UCH, 4) superfamily (all the aforementioned categories are cysteine proteases) and the Jab1/Mov34/Mpr1 Pad1 N-terminal+ (MPN+) (JAMM, 14) domain superfamily proteins that binds zinc (metalloproteases).
USP721-32 was the second most abundant interacting partner of JMJD3. We confirmed interaction between NOTCH1, JMJD3 and USP7 in reciprocal IP experiments (Fig. 1c,d)43. NOTCH1 directly binds the USP7 gene locus (Fig. 1e) and inhibition of the NOTCH1 pathway, using gamma secretase inhibitor (GSI), led to downregulation of USP7 and the well-characterized NOTCH1 target HES1 (Fig. 1f and Supplementary Fig. 1c). RNA expression analysis showed that USP7 was significantly overexpressed in T-ALL compared to normal CD34+ cells and T cells, as well as other hematologic and solid tumors, correlating with expression of HES1 (Fig. 1g-i and Supplementary Fig. 1d).
We hypothesized that USP7 might control NOTCH1 protein levels, as USP7 and NOTCH1 protein levels showed a positive correlation in a panel of T-ALL cell lines and leukemia samples (Fig. 2a-c). Overall, USP7 was substantially expressed in all T-ALL cell lines tested (Supplementary Fig. 1e). We genetically silenced USP7 in T-ALL using CRISPR-Cas9 genome editing (Supplementary Fig. 2a) and analyzed the growth of T-ALL cells. Upon deletion of USP7 using two different sgRNAs, there was significant inhibition of T-ALL cell growth (Fig. 2d). We also examined NOTCH1 protein levels upon expression of sgRNAs against USP7, and observed a decrease in the levels of NOTCH1, suggesting that USP7 might control NOTCH1 protein stability (Supplementary Fig. 2b). USP7 silencing led to increased apoptosis of T-ALL cells, as demonstrated using shRNA against USP7 (Supplementary Fig. 2c,d).

a, Western blots show levels of USP7, NOTCH1, and DNMT1 (positive control) in a panel of T-ALL cell lines (n=6) and primary patient samples (n=5) compared to different normal primary T cell samples (n=2). b, Quantification of panel a. c, A second order polynomial curve was fitted to the data in panel b, where R2=0.9787. The Spearman’s rank correlation test was applied to determine the correlation between NOTCH1 and USP7 (P=0.0009218). d, JURKAT T-ALL cell growth, as determined by trypan blue staining, in cells expressing doxycycline-inducible Cas9 and either a control vector or one containing a USP7-specific single guide RNA (sgRNA). Cells were treated with 1 μg /ml doxycycline for 3 weeks prior to the start of the experiment. Shown is the mean ± SD of technical triplicates, representative of 2 independent experiments. e, Treatment of a panel of human T-ALL lines with P217564 inhibitor (USP7i) for USP7 catalytic activity. Results have been normalized based on the DMSO control study. f, Shown is the effect of USP7i treatment on total DUB activity in the same samples shown in panel e. g, IC50 curve of USP7i in CUTLL1 T-ALL cells. h, Growth curve of CUTLL1 T-ALL cells upon daily treatment with increasing concentrations of USP7i. Shown is the average of technical duplicates from a combination of 2 individual experiments. i, Western blot analysis of JMJD3, NOTCH1, and USP7 protein levels upon treatment of JURKAT T-ALL cells with increasing concentrations of USP7i for 24h. Representative of 4 individual experiments. j, Western blot showing NOTCH1 ubiquitination, as determined by the UbiTest assay (LifeSensors), upon treatment of JURKAT T-ALL cells with DMSO (control) or USP7i for 8h. DUB treatment resulted in removal of ubiquitin. Quantification of ubiquitinated NOTCH1 is shown on the right.
Based on our findings that USP7 might regulate NOTCH1 oncogenic complexes, we sought to exploit USP7 inhibition as a therapeutic tool in leukemia. We took advantage of a new generation of USP7-specific inhibitors (USP7i), developed by Progenra, successfully used in preclinical models of multiple myeloma and neuroblastoma and in immunological contexts33,44,45. USP7i dramatically inhibited USP7 activity (up to 90% inhibition) without significantly blocking total DUB activity in T-ALL (Fig. 2e,f and Supplementary Fig. 3a-c). All T-ALL lines tested had substantial USP7 protein levels and various but significant enzymatic activities (Supplementary Figs. 1e, 3d and Fig. 2a, b). These compounds significantly inhibited leukemic cell growth in the μM range of concentrations (Fig. 2g,h and Supplementary Fig. 4a, IC50 = 4 μM).
To further delineate the mechanism behind this growth inhibition, we treated cells with USP7i for one and 3 days and performed apoptosis and cell cycle analysis, using Annexin V and DAPI staining, respectively. Although there was a significant increase in apoptosis upon treatment with USP7i (Supplementary Fig. 4b), there was no significant effect on cell cycle (Supplementary Fig. 4c). These results were comparable to effects on cell growth upon silencing of USP7 (Supplementary Fig. 2d).
We next measured NOTCH1 protein levels upon treatment with USP7i to evaluate the role of USP7 on NOTCH1 stability. We observed a significant decrease in the levels of NOTCH1 and JMJD3 upon inhibition of USP7 (Fig. 2i) starting at 1uM USP7i. To confirm the role of USP7 in NOTCH1 stabilization, we expressed wild-type USP7 together with NOTCH1, and measured NOTCH1 expression in 293T cells. Indeed, NOTCH1 was stabilized in the presence of USP7 (Supplementary Fig. 4d). To evaluate the role of USP7 in NOTCH1 ubiquitination, we inhibited USP7 catalytic activity in JURKAT T-ALL cells, pulled down ubiquitinated proteins using tandem ubiquitin binding entity (TUBE) technology46, and measured NOTCH1 levels (Fig. 2j). Indeed, NOTCH1 ubiquitination was increased upon USP7 inhibition. JMJD3 overexpression using a retroviral system could not rescue the effect of the drug on leukemic cells (Supplementary Fig. 4e), potentially due to the simultaneous requirement for high levels of NOTCH1 expression for leukemia maintenance.
Due to the activity of intracellular NOTCH1 (N1-IC) on chromatin, we evaluated genome-wide USP7 binding via chromatin immunoprecipitation combined with sequencing (ChIP-Seq). We identified ~10,000 high-confidence peaks for USP7 that localized near promoters (Fig. 3a) and had a strong overlap with NOTCH1 binding sites (Fig. 3b). Both USP7 and NOTCH1 bound to classical NOTCH1 targets, such as DTX1 and NOTCH3, as well as NOTCH1 itself (Supplementary Fig. 5a). Pathway analysis of the ChIP-Seq data showed a striking enrichment for NOTCH1 signaling (Fig. 3c). Furthermore, NOTCH1 recruited USP7 to chromatin, as treatment with GSI significantly depleted chromatin-bound USP7 levels (Fig. 3d). Global cellular levels of USP7 did not change over the period of treatment (Fig. 3d), due to the stability of USP7, as we showed in cycloheximide (protein synthesis inhibitor) studies (Supplementary Fig. 5b). These findings suggest that USP7 and NOTCH1 form a positive feedback loop, where NOTCH1 induces USP7 gene expression and then recruits USP7 to chromatin, resulting in increased expression of NOTCH1 targets, through stabilization of the NOTCH1 complex.
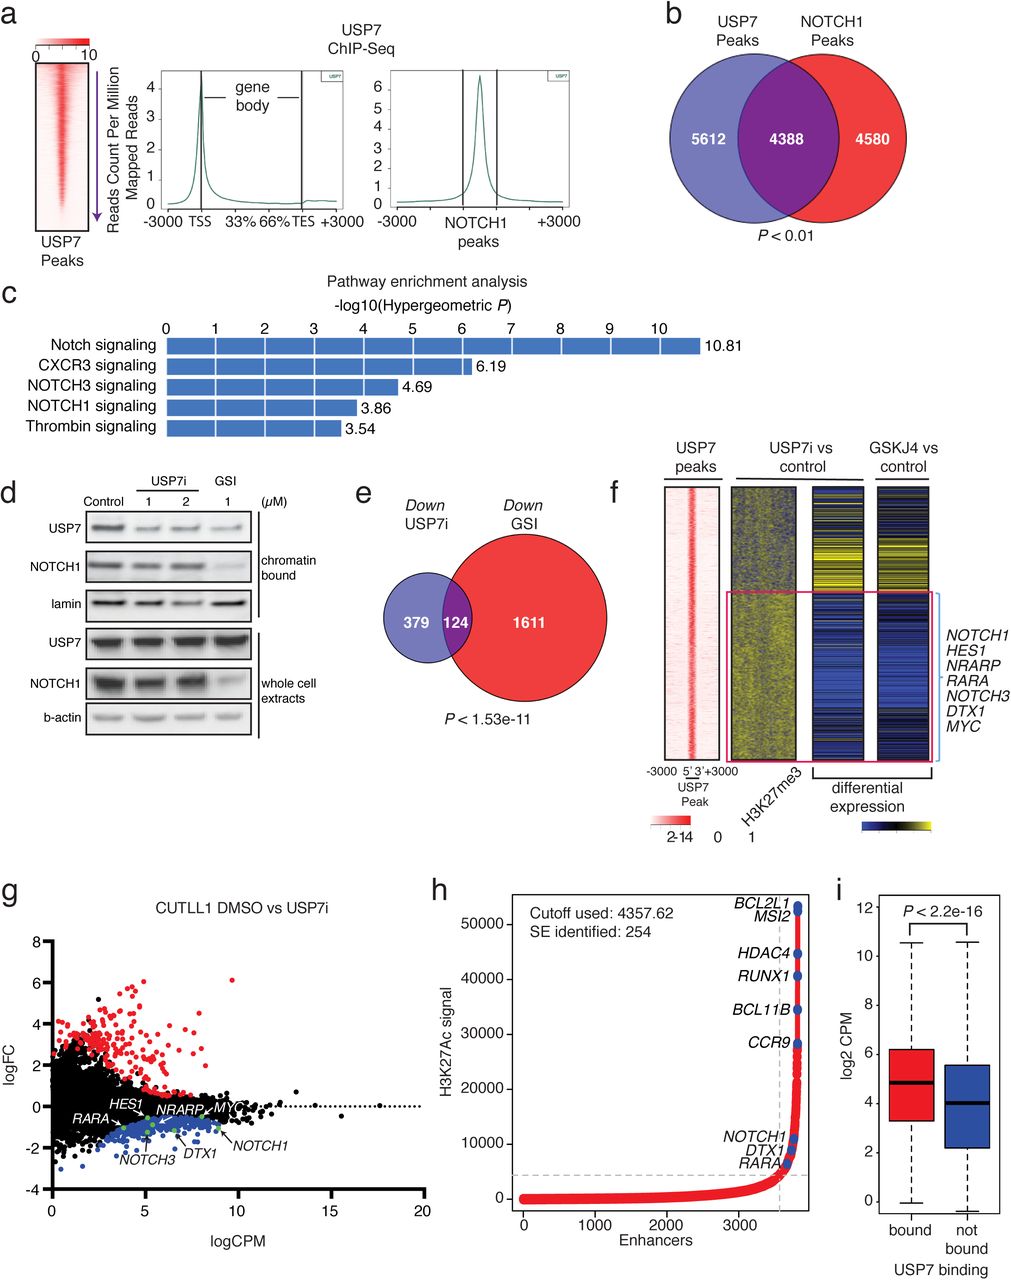
a, Heatmap of USP7 peak intensity (left) and metaplots showing the average counts per million of USP7 ChIP-Seq signal across all genes (middle), and NOTCH1 peaks (right). b, Analysis of ChIP-Seq data showing the overlap of USP7 peaks with NOTCH1 peaks. c, GREAT (Genomic Regions Enrichment of Annotations Tool) analysis showing enrichment in gene function of the USP7-bound peaks in panel B. d, Representative protein levels of USP7 and NOTCH1 in the chromatin-bound fraction and whole cell extracts of JURKAT T-ALL cells upon treatment with DMSO (control), USP7i, or GSI. e, Analysis of RNA-Seq data showing the overlap of downregulated genes upon USP7 inhibition and GSI treatment in CUTLL1 T-ALL cells. f, Heatmap representation of the 10,0 strongest USP7-bound peaks, the log2 fold change of H3K27me3 upon USP7i versus DMSO treatment, and the associated log2 fold changes in gene expression upon USP7 inhibition (USP7i) and JMJD3 inhibition (GSKJ4) are shown (red box delineates cluster of downregulated genes, yellow denotes an increase in expression and H3K27me3, whereas blue indicates a decrease). NOTCH1 target genes are enriched in the downregulated cluster. g, Gene expression data from CUTLL1 RNA-Seq showing up‐ and downregulated genes (red and blue dots, respectively), as well as genes with no statistically significant (P<0.05) expression changes. NOTCH1 target genes are indicated in the plot. h, Superenhancer analysis using H3K27Ac ChIP-Seq data from JURKAT T-ALL cells. The y-axis shows H3K27Ac signal at the superenhancer locus and the x-axis shows the superenhancers ranked from lowest signal to highest, dots marked blue correspond to the top five SEs and NOTCH1 target SEs. i, Boxplot showing the difference in gene expression measured as log2 CPM (counts per million) of genes bound by USP7 (red) and not bound by USP7 (blue). Genes were considered to be bound or not bound by determining the nearest gene to a USP7 peak. There was a statistically significant increase in gene expression among bound genes versus those not bound by USP7 (P<2.2e-16, t-test).
Our data suggest that USP7 regulates important NOTCH1-driven oncogenic complexes. To focus on NOTCH1-related molecular responses we used 1 μM USP7i, as NOTCH1 levels are sensitive to this inhibitor concentration (Fig. 2i). To delineate the molecular effects of USP7 activity, we performed global expression analysis using RNA-Seq upon treatment with USP7i, GSI (NOTCH1 inhibitor), and GSKJ4 (JMJD3 inhibitor). The transcriptional signatures of NOTCH1, USP7, and JMJD3 chemical inhibition overlapped significantly, both with regards to downregulated as well as upregulated genes (Fig. 3e and Supplementary Fig. 6). Specifically, inhibition of USP7 led to downregulation of NOTCH1 targets, including NOTCH3 and DTX1 (Fig. 3f, g and Supplementary Fig. 7a). Similar to enzymatic inhibition, USP7 silencing led to downregulation of NOTCH1 targets (Supplementary Fig. 7b). Gene set enrichment analysis upon USP7 inhibition showed that major oncogenic pathways (NOTCH1, MYC, DNA damage response, and metabolism) were downregulated (Supplementary Fig. 8). Together, these data show that USP7 enzymatic activity is important for sustaining oncogenic activity in T-ALL. It is well known that NOTCH1 regulates oncogenic enhancers47,48. Analysis of USP7 ChIP-Seq data showed that leukemia-specific superenhancers (SEs)49,50, as determined by H3K27 acetylation signal intensity (Fig. 3h), were enriched for binding of USP7 and NOTCH1: 192 out of 254 leukemia SEs were co-bound by USP7 and NOTCH1. In agreement with the association of SEs with transcriptional activation, we found that the USP7-bound genes were more highly expressed compared to the rest of the transcriptome (Fig. 3i) and present with lower expression upon USP7i treatment. Analysis of ChIP-Seq data for T-ALL-related transcription factors showed that USP7 binding overlapped with the binding of several of those factors (Supplementary Fig. 9). Motif analysis of USP7 binding sites showed binding motifs for some of these same factors (Supplementary Fig. 10a). Indeed, our studies using combinatorial inhibition of the bromodomain proteins that recognize acetylated histones (JQ1)51,52 and USP7 showed a synergistic effect (Supplementary Fig. 10b). This was further underlined by our targeted and genome wide analysis of USP7 interactions showing that USP7 interacts with Mediator 1, a main component of SEs (Arcipowski and Ntziachristos, unpublished), suggesting that USP7 may regulate gene activation via interactions with NOTCH1 and potentially other members of the T-ALL transcriptional machinery in SE areas.
NOTCH1 activity leads to eviction of the repressive mark H3K27me3 from the promoters of oncogenic targets14,15. We hypothesized that inhibition of USP7 would lead to an increase in H3K27me3 levels through reduction of JMJD3 protein levels. We assessed levels of H3K27me3 on USP7 targets upon USP7i treatment for 24h. Indeed, USP7 target loci that were downregulated upon USP7i treatment presented a significant gain of H3K27me3 (Fig. 3f). As USP7 has been shown to control histone ubiquitination53,54, we also examined histone H2B lysine 120 ubiquitination (H2Bub) levels following USP7 inhibition. We showed that USP7 colocalized with genes exhibiting a gain of H2B ubiquitination upon USP7 inhibition (Supplementary Fig. 11a). Interestingly, these downregulated genes exhibited a striking loss of H3K79me2 and Pol II occupancy (Supplementary Fig. 11b) in agreement with what was also shown previously in different mammalian contexts, such as in stem cell biology55,56. These changes in HBub and H3K27me3 seemed to be localized to USP7 targets and not a genome-wide phenomenon as global levels of these marks were not significantly altered following treatment with USP7i as we demonstrated using global bottom-up proteomics57 (Supplementary Fig. 11c). We also noticed a focal gain of H2A lysine 119 ubiquitination (H2Aub) on those down-regulated loci, potentially associated to H3K27me3 changes (Supplementary Fig. 11a)58. To better understand whether gene expression depends on both H3K27me3 demethylation and H2B deubiquitination changes and whether levels of those two marks depend on each other, we tried to uncouple those two processes by treatment of JURKAT TALL cells with USP7i, followed by wash-off the inhibitor and treatment with DMSO (control) or GSKJ4 JMJD3 inhibitor. In principle, removal of USP7i should lead to a fast and significant increase in gene expression in the case of DMSO (Supplementary Fig. 11d). In contrast to DMSO, we should see only a partial derepression of gene expression upon GSKJ4 treatment, if USP7 affects H2Bub independently of changes in H3K27me3. Indeed, GSKJ4 treatment compromised expression of NOTCH1 targets compared to the DMSO control (Supplementary Fig. 11d) showing that USP7 controls H2Bub and H3K27me3 independently.
This significant effect of USP7i on leukemia cells led us to further explore USP7 levels in high-risk TALL cases and compare it to low‐ and medium-risk T-ALL cases. To answer this, we used reverse phase protein array (RPPA) analysis59,60 for NOTCH1 and USP7 protein levels using a panel of 64 pediatric leukemia patient samples. We noticed that USP7 and NOTCH1 levels significantly correlate in T-ALL (Fig. 4a) further reinforcing the idea of the positive feedback loop in leukemia. Using data for 50 available patient samples, we demonstrate increased levels of USP7 in high-risk disease compared to medium‐ or low-risk disease (HR (15 patients) vs non-HR (35 patients, Fig. 4b)). Risk is calculated based on minimal residual disease (MRD) at days 35 and 78 post initiation of chemotherapy. Overall MRD levels are the most reliable and recognized markers of drug resistance, thus the most important parameter to consider for therapeutic treatments. These findings show that USP7 inhibition is a valid therapeutic tool in high-risk leukemia, where other treatments have failed to lead to significant disease regression. Our findings also demonstrate a potential role for USP7 as a prognostic marker in T-ALL. This significant finding led us to assess the potential of USP7 inhibition alone or in combination with JMJD3 to inhibit leukemia growth in vivo, we evaluated inhibitor toxicity by injecting mice intravenously (i.v.) with vehicle, USP7i alone, or USP7i with increasing concentrations of GSKJ4. The GSKJ4 concentrations used have been previously shown to successfully inhibit tumor growth61,62. Immunocompromised mice treated daily for five days showed no signs of treatment-associated toxicity, as determined by complete blood cell count, body weight and analysis of spleen and liver (Supplementary Fig. 12a and data not shown). We then transplanted luciferase-expressing JURKAT T-ALL cells either intravenously (i.v., Fig. 4c) or subcutaneously (SubQ, Supplementary Fig. 12b) into immunocompromised mice14,15. Upon tumor detection using bioluminescence imaging (IVIS), mice were randomized into different groups that were treated with vehicle or USP7i [10 mg/kg]. In both models, tumors in USP7i-treated animals showed a significant growth disadvantage compared to the control group (Fig. 4c and Supplementary Fig. 12b). Similar results were obtained using a primagraft i.v. model, where T-ALL progression was detected in the peripheral blood using the marker human CD45 (Fig. 4d and Supplementary Fig. 12c). As H3K27me3 changes are the major epigenetic alteration in TALL progression, we and others have successfully used the JMJD3 inhibitor (GSKJ4) against T-ALL in the past15,61 with decent effect on leukemia inhibition. To further potentiate the therapeutic impact of USP7i in TALL, we investigated the effect of combinatorial USP7 and JMJD3 inhibition on leukemia growth by treating mice with USP7i and GSKJ4 in a subcutaneous model of T-ALL and monitored animal survival (Fig. 4e). Similarly to our previous studies (4c and Supplementary Fig. 12b, c) we found that USP7i as a single therapy significantly inhibits tumor growth (Fig. 4e, top panel) and extends mouse survival (Fig. 4e, bottom panel). Moreover, combinatorial inhibition significantly decreased tumor growth, more effectively than vehicle or USP7 inhibition alone (Fig. 4e, top/right panel) without any associated toxicity based on our analysis of mouse weight (Supplementary Fig. 12d) and histology studies (not shown). Moreover, we demonstrated significant survival differences between mice injected with vehicle or those injected with a combination of USP7 and JMJD3 inhibitors (Fig. 4e, bottom panel). Importantly, USP7i/GSKJ4 treatment yielded a prolonged mouse survival compared to vehicle or USP7i therapy (Fig. 4e bottom panel and data not shown), lending rationale to the use of combinatorial drug treatments against epigenetic regulators in cancer.

a, USP7 protein levels are correlated with NOTCH1 levels in primary T-ALL. b, USP7 expression is significantly associated with high-risk disease. HR: high risk. P<0.05 between non-HR (n=35) and HR (n=15). c, JURKAT T-ALL cells were injected intravenously (i.v.) into immunocompromised mice. Upon detection of leukemic blasts using bioluminescence (with IVIS), mice were treated i.p. with 10 mg/kg USP7i 3 days/week for 3 weeks. Relative luminescence intensity is shown for 2 representative mice per treatment group on days 7 and 21 of treatment. The fold change in total flux from day 7 to day 21 is shown on the right (vehicle, n=8; USP7i, n=9). d, Patient T-ALL cells expressing high levels of NOTCH1 and USP7 were injected i.v. into immunocompromised animals and, upon detection of human CD45+ cells in the peripheral blood, mice were administered USP7i at 10 mg/kg 3 times/week for 3 weeks. The mean percentage of hCD45+ cells in the peripheral blood ±SD at days 16 and 21 (at the end of the treatment period) is shown (n=7). e, Immunocompromised mice were injected subcutaneously with JURKAT T-ALL cells. Once tumors became visible, mice were administered USP7i i.v., alone or in combination with GSKJ4, 3 times/week till termination of the study. Shown is mouse survival (lower left panel) and the mean tumor volume ± SD (right panel) for the different groups (vehicle, n=7; USP7i, n=5; and USP7i/GSKJ4, n=5). * P<0.05, ** P<0.01, *** P<0.001.
Discussion
Therapeutic targeting of high-risk acute lymphoblastic leukemia (ALL) has been challenging, rendering this disease an unmet clinical need. In this study, we performed a series of epigenetic, biochemical, functional and pharmacological studies to show that the deubiquitinase USP7 functionally and physically interacts with and controls NOTCH1 pathway and ultimately the oncogenic transcriptional circuitry in T cell ALL. USP7 levels can be a biomarker for high-risk ALL and inhibition of its enzymatic activity could be a valid therapeutic target in this disease.
Given the previously unrecognized importance of deubiquitination in acute leukemia progression, we characterized a novel role for USP7 in T-ALL, providing the first evidence that the ubiquitination-methylation axis can serve as an oncogenic switch and therapeutic target in T-ALL. USP7 is the first deubiquitinase identified and thoroughly characterized to regulate the NOTCH oncogenic pathway. Our studies showed that USP7, NOTCH1, and JMJD3 act in a positive feedback loop, where the NOTCH1/JMJD3 complex induces expression of USP7, resulting in USP7 recruitment to target genes (Supplementary Fig. 13). Moreover, our ongoing studies show that NOTCH1 molecules with mutant PEST domain (shown in the past to control NOTCH1 levels through interaction with FBXW738,39 ligase), interact with and are deubiquitinated by USP7, showing that other parts of NOTCH1 intracellular domain control its regulation through USP7 (Jin and Ntziachristos, unpublished). USP7 recruitment leads to stabilization of the oncogenic complex and activation of targets through demethylation of H3K27 and deubiquitination of H2B, as well as changes in H3K27Ac at SEs. Intriguingly, and in contrast to the previously characterized pro-oncogenic role of USP7 in T-ALL and multiple myeloma33, neuroblastoma63, chronic lymphocytic leukemia64 and other solid tumors65-67, there are mutations affecting USP7 in pediatric cancers including TAL1-positive leukemias68,69. Thus, similarly to what others and we showed for another epigenetic modulator, the histone demethylase UTX, which can play dual roles in NOTCH1‐ and TAL1‐ contexts of T-ALL (oncogene or tumor suppressor)15,61,70, the role of USP7 might also be context-specific. These context-specific roles of the epigenetic modulators are another intriguing aspect of their biology that we can exploit to develop elegant targeted therapeutic approaches in cancer. Further research is needed to study the role of USP7 in leukemia contexts other than NOTCH1-positive T-ALL, such as TAL1-positive leukemia.
Together, our findings strongly suggest that USP proteins, and USP7, in particular, may be exploited for pharmacological inhibition in certain T-ALL patients. Combinations of targeted therapies are hailed as the future of cancer therapy, with hematological malignancies leading the way (i.e. bortezomib, lenalidomide, and dexamethasone for multiple myeloma, and rituximab and ibrutinib for chronic lymphocytic leukemia). Thus, combined inhibition of USP7 and JMJD3 may represent an attractive therapeutic approach for T-ALL, especially given that small molecules generated by Progenra are already available for preclinical studies.
Author Contributions
P.N. designed the study, the experiments and wrote the manuscript. K.A. designed and performed most of the experiments and wrote the manuscript. C.A.M. designed and performed the analysis of genome-wide data and wrote the manuscript. E.T.B. and C.K.C. provided bioinformatics support. Q.J., Y.Z., B.T.G.D., K.K.W., M.R.J., A.G.V., F.W., J.W., H.W., I S., P.M.T., Y.A.G., N.A.A., S.P., N.V., GB., S.G., S.A.M., E.J.R., Y.T., L.W., A.S. performed experiments and contributed ideas. P.V.V. provided materials and advice related to the study. I.K. and C.M. designed and performed xenograft luciferase experiments and inhibitor treatments and helped with ideas and concepts. J.P.B. and B.B. have performed and analyzed treatments of primary samples with USP7i. B.A., V.S., M.P., G.B. and S.B. performed and analyzed RPPA and associated gene expression studies. N.L.K. provided service and helped with the proteomics studies. B.U. performed the mass spectrometry experiment and analysis. J.W. and S.K. helped with the design and execution of USP7i treatments and manuscript preparation. J.D.C. helped with the design of experiments and writing of the manuscript. A.Sh. contributed ideas and reagents and helped with the design of the study.
Conflict of Interest Statement
Feng Wang, Jian Wu, Hui Wang, Ivan Sokirniy, Joseph Weinstock, and Suresh Kumar are employees of Progenra, Inc., developers of the USP7i compounds used in this paper. The remaining authors have no conflicts of interest.
Methods
Cell lines and primary cells
The human T-ALL cell lines CUTLL1 (gift from Iannis Aifantis, New York University), LOUCY (gift from Pieter Van Vlierberghe, Cancer Research Institute, Belgium), CCRF-CEM (American Type Culture Collection (ATCC), Manassas, VA, #CCL-119), JURKAT (ATCC) and KOPTK1 (Iannis Aifantis’ group) were cultured in RPMI 1640 medium supplemented with 10% heat-inactivated FBS (Sigma-Aldrich, St. Louis, MO), 2% penicillin/streptomycin (Gibco, Fisher Scientific, Hampton, NH), and 1% GlutaMAX (Gibco, Fisher Scientific). 293T cells (ATCC, #CRL-11268) were maintained in DMEM medium supplemented with 10% heat-inactivated FBS, 2% penicillin/streptomycin, and 1% GlutaMAX. Human pan T cells were purchased from AllCells.com (Alameda, CA). Primary human samples were collected by collaborating institutions with informed consent and analyzed under the supervision of the Institutional Review Board of Ghent University.
Antibodies and reagents
The following antibodies were used: mouse anti-Actin (Millipore, Billerica, MA, clone C4), rabbit anti-JMJD3 (Cell Signaling Technology, Danvers, MA, #3457), rabbit anti-USP7 (Bethyl Laboratories, Montgomery, TX, #A300-033A-7), rabbit anti-Cleaved NOTCH1 (Val1744) (Cell Signaling Technology, #4147), rabbit anti-DNMT1 (Cell Signaling Technology, #5032), rabbit anti-H3K27Ac (Cell Signaling Technology, #8173S), rabbit anti-H3K27me3 (Cell Signaling Technology, #9733S), rabbit anti-H2BK120ub (Cell Signaling Technology, #5546S), rabbit anti-H2AK119ub (Cell Signaling Technology, #8240S), rabbit anti-H3K79me2 (gift from Ali Shilatifard, Northwestern University), rabbit anti-H3K4me3 (gift from Ali Shilatifard), and normal rabbit IgG (Millipore, #12-370). Secondary antibodies for Western blots were HRP-conjugated antirabbit and anti-mouse IgG (GE Healthcare, Chicago, IL).
Quick Start Bovine Gamma Globulin (BGG) Standard Set (protein standards) were purchased from Bio-Rad (Hercules, CA); benzonase, RNase A, dithiothreitol (DTT), EZview Red Anti-HA Affinity Gel (HA beads), and Influenza Hemagglutinin (HA) peptide were purchased from Sigma-Aldrich; NaV and NaF were purchased from New England BioLabs (Ipswich, MA); Protein G Dynabeads were purchased from Life Technologies (Carlsbad, CA); IgG-free BSA was purchased from Jackson ImmunoResearch Laboratories (West Grove, PA); phenol chloroform was purchased from ThermoScientific (Waltham, MA); and proteinase K, Tousimis formaldehyde, and Peptide International Z-Leu-Leu-Leu-H aldehyde (MG132) were purchased from Fisher Scientific. USP7i was a kind gift from Progenra (Malvern, PA). GSKJ4 was purchased from Cayman Chemical, Ann Arbor, MI, #12073)
Immunoprecipitation (IP)
100 million T-ALL cells were collected and washed with chilled PBS. Cells were resuspended in 5 volumes of Buffer A (10 mM HEPES, 1.5 mM MgCl2, 10 mM KCl, 1:100 protease inhibitor (Sigma-Aldrich, P8340), 1 mM NaV, 1 mM NaF, and 0.5 mM DTT in H2O), incubated on ice for 10 min, and lysed using a Dounce homogenizer. Nuclear pellets were resuspended in 1.5 ml of TENT buffer (50 mM Tris pH 7.5, 5 mM EDTA, 150 mM NaCl, 0.05% v/v Tween 20, 1:100 protease inhibitor (Sigma-Aldrich, P8340), 1 mM NaV, 1 mM NaF, and 0.5 mM DTT in H2O) containing 5 mM MgCl2 and 100 units benzonase, and incubated at 4°C for 30 min, rotating. Lysates were passed through a 251/2G needle/syringe 5 times, and spun down at 4°C, 2000 RPM, for 7 min to remove debris. Protein G magnetic beads were added to the lysates to decrease non-specific binding and incubated at 4°C for 30 min, rotating. Precleared lysates were then incubated with the appropriate antibody-conjugated beads (5 μg antibody per 100 million cells) at 4°C overnight, rotating. Beads were washed 4 times in TENT buffer at 4°C for 3 min, and protein complexes were eluted in 200 μl 0.1M glycine pH 2.5 for 10 min at 25°C, shaking. 20 μl of 1M Tris pH 8.0 was then added to the supernatants. For IP of HA-JMJD3, precleared lysates were incubated with HA-coated beads overnight, and protein complexes were eluted in 200 μl TENT buffer containing 400 μg/ml HA peptide (Sigma-Aldrich) at 4°C overnight, rotating.
Mass spectrometry
Histone epiproteomics analysis was performed as previously described1,2.For the JMJD3 mass spectrometry the affinity-purified proteins were reduced, alkylated, and loaded onto an SDS-PAGE gel to remove any detergents and LCMS incompatible reagents. The gel plugs were excised, destained, and subjected to proteolytic digestion with trypsin. The resulting peptides were extracted and desalted as previously described3. An aliquot of the peptides was analyzed with LCMS coupled to a ThermoFisher Scientific Orbitrap QExactive Mass Spectrometer operated in data dependent mode. The data was searched against a UniProt human database, using Sequest within Proteome Discoverer. The results were filtered with a 1% FDR searched against a decoy database and for proteins with at least two unique peptides. Word clouds were generated using the statistical program R, and gene ontology was performed using the Gene Ontology Consortium (http://www.geneontology.org/).
Western blot
To make total cell extracts, up to 10 million cells were collected and resuspended in 20 μl RIPA buffer (50 mM Tris HCl pH 8.0, 150 mM NaCl, 1% NP-40/IGEPAL, 0.5% sodium deoxycholate, 0.1% SDS, 1:100 protease inhibitor (Sigma-Aldrich, P8340), 1 mM NaV, and 1 mM NaF in H2O) per 1 million cells. Cells were lysed on ice for 20 min, and spun down at 4°C, max speed, for 10 min to remove debris.
Protein concentrations were determined via Bradford assay. Samples and buffer were diluted 1:10 in H2O. 2 μl of protein standards, H2O, or diluted sample were added to wells of a 96-well plate in duplicate. Then, 2 μl of diluted buffer and 100 μl Quick Start Bradford 1X Dye Reagent (Bio-Rad) were added to each well, and absorbance was measured at 600nm using the GloMax-Multi Detection System (Promega, Madison, WI).
Up to 50 μg sample was boiled in 1X SDS loading dye (Bio-Rad) at 95°C for 10 min prior to loading into 4-15% Tris-glycine polyacrylamide gels (Bio-Rad). 8 μl of PageRuler Plus Prestained Protein Ladder (10-250kD; Fisher Scientific) was also loaded. Gels were run at 100 V until samples reached the separating part of the gel, and then were run at 130V. Gels were transferred for 1.5h at 80V or overnight at 35-40V, and membranes were blocked in 5% milk in TBST (0.1% Tween 20 in 1X TBS) for 1h. Membranes were incubated at 4°C overnight with the appropriate antibody in TBST. Then, the membranes were washed 3 times for 10 min with TBST, incubated for 2h at 4°C with the appropriate secondary antibody, washed 3 times for 10 min with TBST, and developed using Clarity Western ECL Substrate (Bio-Rad), or SuperSignal West Femto Maximum Sensitivity Substrate (ThermoScientific) as needed, on a Bio-Rad ChemiDoc Touch Imaging System. Analysis was performed using Image Lab software (Bio-Rad).
Chromatin immunoprécipitation (ChIP)
10 million T-ALL cells were cross-linked in 1 ml/million cells fixation buffer (1% formaldehyde, 1X PBS, and 1% FBS in H2O) for 10 min at 25°C. Then, 1:12.5 glycine [2.5M] was added for 5 min. Pelleted cells were then lysed according to the type of ChIP performed.
For histone ChIPs, cells were lysed in 375 μl of Nuclei Incubation Buffer (15 mM Tris pH 7.5, 60 mM KCl, 150 mM NaCl, 15 mM MgCl2, 1 mM CaCl2, 250 mM Sucrose, 0.3% NP-40, 1 mM NaV, 1 mM NaF, and 1 EDTA-free protease inhibitor tablet (Roche, Pleasanton, CA)/10 ml in H2O) for 10 min on ice. Nuclei were washed once with Digest Buffer (10 mM NaCl, 10 mM Tris pH 7.5, 3 mM MgCl2, 1 mM CaCl2, 1 mM NaV, 1 mM NaF, and 1 EDTA-free protease inhibitor tablet (Roche)/10 ml in H2O) and resuspended in 57 μl Digest Buffer containing 4.5 units MNase (USB, Cleveland, OH) for 1h at 37°C. MNase activity was quenched for 10 min on ice upon the addition of EDTA to a final concentration of 20 mM. Pelleted nuclei were lysed in 300 μl Nuclei Lysis Buffer (50 mM Tris-HCl pH 8.0, 10 mM EDTA pH 8.0, 1% SDS, 1 mM NaV, 1 mM NaF, and 1 EDTA-free protease inhibitor tablet (Roche)/10 ml in H2O) using a Bioruptor Pico (Diagenode, Denville, NJ) for 5 min (30 sec on, 30 sec off). Lysate was centrifuged at max speed for 5 min to remove debris, and 9 volumes of IP Dilution Buffer (0.01% SDS, 1.1% Triton X-100, 1.2 mM EDTA pH 8.0, 16.7 mM Tris-HCl pH 8.0, 167 mM NaCl, 1 mM NaV, 1 mM NaF, and 1 EDTA-free protease inhibitor tablet (Roche)/10 ml in H2O) were added to the supernatant. 50 μl protein G magnetic beads, blocked with IgG-free BSA, were added to the sample and incubated at 4°C for 30 min, rotating. 1% of the precleared sample was kept out as input, and the remaining sample was split into 3 tubes. 50 μl protein G magnetic beads conjugated to 15 μl of the appropriate antibody were added to each tube, and incubated at 4°C overnight, rotating. Bead-bound complexes were washed for 5 min each in 1 ml of Low Salt Buffer (20 mM Tris-HCl pH 8.0, 150 mM NaCl, 2 mM EDTA, 1% w/v Triton X-100, and 0.1% w/v SDS in H2O), High Salt Buffer (20 mM Tris-HCl pH 8.0, 500 mM NaCl, 2 mM EDTA, 1% w/v Triton X-100, and 0.1% w/v SDS in H2O), LiCl Buffer (10 mM Tris-HCl pH8.0, 250 mM LiCl, 1 mM EDTA, 1% w/v NP-40, and 1% w/v deoxycholic acid in H2O), and TE.
For epigenetic regulator and transcription factor ChIPs, cells were lysed in 1 ml LB1 Buffer (50 mM HEPES-KOH pH 7.5, 140 mM NaCl, 1 mM EDTA, 10% Glycerol, 0.5% NP-40, 0.25% Triton X-100, 1:100 protease inhibitor (Sigma-Aldrich, P8340), 1 mM NaV, and 1 mM NaF in H2O) for 10 min at 4°C, rotating. Nuclei pellets were resuspended in LB2 Buffer (10 mM Tris-HCl pH 8.0, 200 mM NaCl, 1 mM EDTA, 0.5 mM EGTA, 1:100 protease inhibitor (Sigma-Aldrich, P8340), 1 mM NaV, and 1 mM NaF in H2O) and incubated for
10 min at 25°C, rotating. Finally, nuclei pellets were lysed in 300 μl LB3 Buffer (10 mM Tris-HCl pH 8.0, 100 mM NaCl, 1 mM EDTA pH 8.0, 0.5 mM EGTA pH 8.0, 0.1% sodium deoxycholate, 0.5% N-lauroylsarcosine, 1:100 protease inhibitor (Sigma-Aldrich, P8340), 1 mM NaV, and 1 mM NaF in H2O) using a Bioruptor Pico (Diagenode) for 5 min (30 sec on, 30 sec off). 1% Triton X-100 was added, and samples were centrifuged at max speed to remove debris. 50 μl protein G magnetic beads, blocked with IgG-free BSA, were added to the sample and incubated at 4°C for 30 min, rotating. 1% of the precleared sample was kept out as input, and the remaining sample was used for IP. 50 μl protein G magnetic beads conjugated to 5-10 μg of the appropriate antibody were added to each tube, and incubated at 4°C overnight, rotating. Bead-bound complexes were washed for 5 min each in 1 ml of RIPA Wash Buffer (50 mM HEPES-KOH pH 7.6, 300 mM LiCl, 1 mM EDTA, 1% NP-40, and 0.7% sodium deoxycholate in H2O), 5 times, and 1 time in 1 ml TE Wash Buffer (10 mM Tris-HCl pH 8.0, 1 mM EDTA, and 50 mM NaCl in H2O).
To elute bead-bound complexes, 50 μl of Elution Buffer (for 10 ml total volume, 7.5 ml H2O, 0.5 ml 20% SDS, and 2 ml 0.5M sodium bicarbonate) was added to each sample, and samples were incubated at 65°C for 15 min, shaking at 1000 RPM on a thermomixer (ThermoScientific). Elution was repeated a second time, and then 100 μl RNase Buffer (12 μl of 5M NaCl, 0.2 μl 30 mg/ml RNase, and 88 μl TE) was added to each ChIP and input sample. Samples were incubated at 37°C for 20 min, followed by the addition of PK Buffer (2.5 μl 20 mg/ml proteinase K, 5 μl 20% SDS, and 92.5 μl TE) overnight at 65°C. An equal volume of phenol chloroform solution was added to the samples, which were vortexed for 1 min and transferred to MaXtract High Density tubes (Qiagen). Samples were centrifuged for 8 min at max speed, and the upper phase was transferred to new tubes containing 1.5 μl 20 mg/ml glycogen. Then, 30 μl sodium acetate and 800 μl 100% ethanol were added, and tubes were incubated on dry ice to 30-60 min. DNA pellets were washed in 70% ethanol, air-dried, and resuspended in 30 μl H2O.
ChIP-Seq
Libraries were prepared using Agencourt AMPure XP beads (Beckman Coulter, Brea, CA) and the KAPA HTP Library Preparation Kit (KAPA Biosystems, Wilmington, MA), according to the manufacturer’s protocol (v4.15). DNA fragment size was determined using High Sensitivity DNA Chips read on a 2100 Bioanalyzer (Agilent Technologies, Santa Clara, CA). Libraries were sequenced on the Illumina NextSeq 500 (San Diego, CA; 50bp single reads). FASTQ reads were first trimmed from the 3’ end using Trimmomatic4 version 0.33, such that the Phred33 score of all the nucleotides was above 30 and all reads shorter than 20bp were discarded. The resulting reads were then aligned to the hg19 genome using bowtie version 1.1.2 with the following parameters: bowtie ‐p 5 ‐m 1 ‐v 2 ‐S5. Next, the bam file was sorted and bigwig tracks were created by extending each read by 150 bp and using the GenomicAlignments6 package in R in order to calculate the coverage of reads in counts per million (CPM) normalized to the total number of reads for each sample in the library.
Peak calling
Peaks were called using MACS7 version 1.4.2 with the default parameters, using the specific aligned ChIP-Seq data for a particular antibody as the treatment sample and an aligned bam file of the unprecipitated input as a control sample. Only the top 10,000 peaks ordered by peak score (which is proportional to the FDR of the peak) were chosen for further analysis.
Calculation of overlaps and statistical significance
Overlap between two ChIP-Seq peak datasets were calculated using the mergePeaks tool in the HOMER8 tools. In brief, the intersection between two ChIP-Seq peak datasets was determined by calculating the number of peaks in one set that overlap with the peaks in the second set. Statistical significance of the overlaps between ChIP-Seq datasets was done by using reservoir sampling9 with a set of 161 transcription factor peak binding sites downloaded from http://hgdownload.cse.ucsc.edu/goldenpath/hg19/encodeDCC/wgEncodeRegTfbsClustered/ (wgEncodeRegTfbsClusteredV3.bed.gz, ENCODE data). The tool for implementing the sampling schema is called poverlaps and can be downloaded from github at https://github.com/brentp/poverlap. A total of 100 permutations per pair-wise combination of transcription factor overlaps was used. Venn diagrams of overlaps were generated using an online Venn diagram generator (http://jura.wi.mit.edu/bioc/tools/venn.php).
Motif analysis and pathway enrichment analysis
HOMER, with the standard default parameters, was used to determine the enrichment for known and unknown motifs in the USP7 ChIP-Seq peaks. Pathway enrichment analysis of USP7-bound genes were determined using GREAT (Genomic Regions Enrichment of Annotations Tool)10.
Generation of heatmaps
Heatmap representation of log2 fold-changes in epigenetic marks between DMSO and USP7 inhibition were visualized using ngs.plot11. In brief, log2 fold-changes of H3K27me3, H2Aub, H2Bub, and H3K79me2 upon USP7 inhibition versus DMSO treatment at the top 10,000 USP7 peaks were visualized. A k-means clustering algorithm option was used with the number of clusters set to 5. Correlated gene expression changes were calculated by determining the log2 fold-change in gene expression upon USP7 or JMJD3 inhibition of the nearest protein-coding gene to the USP7 peak. Gene expression changes were visualized using Java TreeView12.
Quantitative polymerase chain reaction (qPCR)
RNA was isolated from T-ALL cells using the Aurum Total RNA Mini Kit (Bio-Rad), and was quantified on a Qubit 3.0 Fluorometer (Life Technologies) using the Qubit RNA HS (High Sensitivity) Assay Kit (Life Technotogies) according to the manufacturers’ instructions. cDNA was made using the High Capacity cDNA RT Kit (Applied Biosystems, Foster City, CA), according to the manufacturer’s protocol. qPCR reactions were carried out using iTaq Universal SYBR Green Supermix (Bio-Rad) and the following primers: USP7 – 5’-CGGTGTTGTGTCCATCACTC-3’ (forward) and 5’ ‐AGTTGAGCGAGCCCGAG-3’ (reverse), NOTCH3 – 5’ ‐GTAGAGGGCATGGTGGAAGA-3’ (forward) and 5’ ‐AAGTGGTCCAACAGCAGCTT-3’ (reverse), DTX1 – 5’ ‐CTCGCCACTGCTATCT ACCC-3’ (forward) and 5’ ‐CGTGCCGATAGTGAAGATGA-3’ (reverse), and HES1 – 5’ ‐GCAGATGACGGCTGCGCTGA-3’ (forward) and 5’-AAGCGGGTCACCTCGTTCATGC-3’ (reverse). Samples were run on a CFX Connect Reak-Time System (Bio-Rad) under the following conditions: 95°C for 10 sec (denaturation), 60°C for 30 sec (annealing), and 72°C for 30 sec (elongation), for 40 cycles. Analyses were performed using GraphPad Prism software (GraphPad Software, La Jolla, CA). Statistical comparisons were made using the Student’s unpaired, two-sided t-test. p values <0.05 were considered statistically significant. Relative mRNA abundance refers to the levels of the gene of interest normalized to housekeeping genes GAPDH or G6PD. All values were then normalized to the control sample.
Analysis of data from publically available databases
Analysis of microarray data from GEO was done using the NCBI GEO2R online tool for microarray analysis. Adjusted p-value calculations were done using Benjamini & Hochberg (False discovery rate or FDR) option. A FDR of <0.05 was considered to be statistically significant.
Generation of CRISPR cell lines
Single-guide RNAs (sgRNAs) targeting USP7 (sgRNA 1, 5’ ‐GAGTGATGGACACAACACCGCGG-3’; sgRNA 2, 5’-AGACACCAGTTGGCGCTCCGAGG-3’), designed using CHOPCHOP (http://chopchop.cbu.uib.no), were cloned into pLX-sgRNA (Addgene, Cambridge, MA, #50662). pLX-sgRNA was amplified using F1 (5’-AAACTCGAGTGTACAAAAAAGCAGGCTTTAAAG-3’) and R1 (sgRNA 1, 5’-CGGTGTTGTGTCCATCACTCGGTGTTTCGTCCTTTCC-3’; sgRNA 2, 5’-GGAGCGCCAACTGGTGTCTCGGTGTTTCGTCCTTTCC-3’), and F2 (sgRNA 1, 5’-GAGTGATGGACACAACACCGGTTTTAGAGCTAGAAATAGCAA-3’; sgRNA 2, 5’-GAGACACCAGTTGGCGCTCCGTTTTAGAGCTAGAAATAGCAA-3’) and R2 (5’-AAAGCTAGCTAATGCCAACTTTGTACAAGAAAGCTG-3’). These products were gel-purified using the QIAquick Gel Extraction Kit (Qiagen, Germantown, MD), and amplified using F1 and R2. PCR products were digested with NheI and XhoI, ligated, and used for STBL3 (ThermoScientific) bacterial transformation, according to the manufacturer’s protocol.
To make virus, 293T cells were seeded in a 6-well plate. The next day, 0.25 M CaCl2, 1X HBS pH 7.05, 2 μg VSVG envelope plasmid, and 3 μg pCMV-dR8.91 (Delta 8.9) lentiviral packaging plasmid were added to 10 μg DNA (sgRNA or empty vector) and added dropwise to the cells. Medium was changed the next day, and after 24h, virus was collected 3 times (6-8h between collections). Pooled viral supernatant (3 ml) was filtered using a 0.45 μM syringe filter, and 1 ml viral supernatant was added to a 6-well plate containing 0.5 million JURKAT T-ALL cells stably expressing pCW-Cas9 (Addgene, #83481), a gift from Navdeep Chandel (Northwestern University). Infection was repeated the next day, and 1 week later, cells were treated for 3 weeks with 5 μg/ml blasticidin to select for cells expressing the sgRNA or empty vector. 1 μg/ml doxycycline was then added to cells to induce the disruption of USP7.
Ubiquitin competition assay
This assay was performed as previously described, using recombinant enzymes and a panel of USP7 inhibitors, including P21756413.
Knockdown of USP7 by shRNA
The following USP7-specific shRNA (Sigma-Aldrich) was used: 5'-CCGGCCTGGATTTGTGGTTACGTTACTCGAGTAACGTAACCACAAATCCAGGTTTTT-3'. The shRNA was cloned into puro-IRES-GFP, and retrovirus was used to infect JURKAT T-ALL cells as previously described14.
Viability assays, apoptosis, and cell cycle analysis
500,000 cells were plated in wells of a 24-well plate, and treated with DMSO or USP7i as indicated in the Figure Legends. Cells were counted each day via trypan blue, and inhibitor/medium was changed. When cells reached a confluency of >1 million cells/ml, cells were diluted 1:2, and this dilution was factored into the cell numbers for viability assays. For apoptosis analysis, cells were stained with LIVE/DEAD Fixable Near-IR Dead CeU Stain (Life Technotogies) according to the manufacturer’s protocol except that cells were stained for 20 min at 4°C, prior to staining with PE-conjugated Annexin V (Life Technologies) in Annexin V Binding Buffer (BD Biosciences, San Jose, CA), according to the manufacturers’ instructions. To measure cell cyde, cells were fixed in 100 μl Fix and Perm Medium A (Life Technologies) for 15 min, washed with PBS, and incubated with 100 μl Fix and Perm Medium B (Life Technologies) + 1 μg/ml DAPI (Invitrogen, Carlsbad, CA) for 1h at 4°C. Flow cytometry was performed on an LSR II (BD, Franklin Lakes, NJ) and analyses were performed using FlowJo software (Tree Star, Ashland, OR). Statistical analyses were performed using GraphPad Prism software (GraphPad Software). Comparisons were made using the Student’s unpaired, two-sided t-test. p values <0.05 were considered statistically significant.
TUBE ubiquitin assay
200 million JURKAT T-ALL cells were treated in duplicate with either DMSO or 5 μM USP7i for 8h. Cell pellets were collected, washed with PBS, and frozen. Ubiquitinated substrates were pulled down using agarose-TUBE beads, eluted, and treated with the deubiquitinase USP2 to remove ubiquitin prior to Western blotting as previously described13.
RNA-Seq
RNA was extracted from up to 10 million T-ALL cells using the Aurum Total RNA Mini Kit (Bio-Rad) according to the manufacturer’s instructions. RNA was quantified on a Qubit 3.0 Fluorometer (Life Technologies) using the Qubit RNA HS (High Sensitivity) Assay Kit (Life Technologies) according to the manufacturer’s instructions. RNA integrity and DNA fragment size were determined using RNA Nano Chips and High Sensitivity DNA Chips read on a 2100 Bioanalyzer (Agilent Technologies). Libraries were prepared using Agencourt AMPure XP beads (Beckman Coulter) and the TruSeq RNA Library Prep Kit v2 (Illumina), according to the manufacturer’s Low Sample (LS) protocol and sequenced on the Illumina NextSeq 500 (50bp single reads). FASTQ reads were aligned to the hg19 genome using tophat version 2.1.015 using the following options ‐‐no-novel-juncs ‐‐read-mismatches 2 ‐‐read-edit-dist 2 ‐‐max-multihits 5. The generated bam files were then used to count the reads only at the exons of genes using htseq-count16 with the following parameters ‐q ‐m intersection-nonempty ‐s reverse ‐t exon. Differential expression analysis was done using the R package edgeR17. Bigwig tracks of RNA-Seq expression were generated by using the GenomicAlignments package in R in order to calculate the coverage of reads in counts per million (CPM) normalized to the total number of uniquely mapped reads for each sample in the library.
Superenhancer analysis
Superenhancers were determined using a H3K27Ac ChIP-Seq dataset in JURKAT cells treated with DMSO or USP7 inhibitor. Aligned bam files of H3K27Ac ChIP-Seq signal and input control were analyzed using the Rank Ordering of Super-Enhancers algorithm (ROSE)18,19. A stitching distance of 12.5 kbp were used to stich together enhancer regions, and regions within 2.5 kbp of a transcriptional start site were ignored in order to prevent promoter bias. The initial set of enhancer regions used in the analysis was determined by merging the peaks of H3K4me1 and H3K27Ac in CUTLL1 cells (ChIP-Seq dataset for H3K4me1 signal and H3K27Ac was downloaded from GEO with the accession numbers GSM732910 and GSM1252938 for H3K4me1 and H3K27Ac, respectively).
Gene set enrichment analysis
Gene set enrichment analysis (GSEA) was done using the Broad Institute GSEA software (http://software.broadinstitute.org/gsea/index.jsp)20,21. RNA-Seq gene expression data were used to create a preranked order of genes, where genes were sorted using the p-value of the differential expression between USP7 inhibition and DMSO treatment, and gene up or downregulation upon USP7 inhibition was determined. In brief, the genes were ranked by calculating ‐log(p-value)*sign(logFC), and a PreRanked GSEA analysis was done using the Hallmark database and the standard weighted enrichment statistic with 5,000 permutations. Enriched datasets with a FDR < 0.05 were considered statistically significant.
Inhibitor wash-off experiment
45 million JURKAT T-ALL cells were treated with DMSO, 1 μM USP7i, or 1 μM USP7i + 2 μM GSKJ4 for 24h, with medium and inhibitors replaced at 12h. 5 million cells from each flask were collected for RNA extraction, and the remaining 40 million cells in each flask were divided equally and treated with either DMSO or GSKJ4 for 2h, 4h, 6h, or overnight, and cells were collected at each time point for RNA extraction.
Intravenous and subcutaneous xenograft studies
All mice were housed in a barrier facility, and procedures were performed as approved by the Northwestern University Institutional Animal Care and Use Committee (protocol Ntziachristos #IS00002058 and Mazar #IS00000556) and the Ghent University Animal Ethics Committee (protocol #ECD16/56).
For JURKAT T-ALL subcutaneous studies, 0.7 million cells were injected subcutaneously into the right flank of 8-week-old NOD.Cg-Prkdcscid male mice (#005557, Jackson Laboratories, Portage, MI) with an equal volume of BD Matrigel, at 50 μl of cells to 50 μl Matrigel. The following day, mice were randomly assigned to treatment groups (7 mice/group), and were treated with either DMSO or 10 mg/kg USP7i 3 times per week i.p. for 8 doses. One week later, mice were treated 5 times per week i.p. for 17 days. Body weight and tumor size (via calipers) were measured 3 times per week.
For JURKAT T-ALL transplant studies, 1 million cells were injected via tail vein into 8-week-old NOD.Cg-Prkdcscid male mice (#005557, Jackson Laboratories) in 100 μl PBS. Animals were monitored by IVIS every 3 days until luciferase signal was detected, and then animals were randomly assigned to treatment groups (9 mice/group). Mice were treated 3 times per week i.p. with DMSO or 10 mg/kg USP7i (in 10% DMSO + 2% Tween 80) for up to 10 doses. IVIS images were taken twice per week (Perkin Elmer) and animal weight was measured 3 times per week to ensure accurate dosing.
For primagraft studies, 1.2 million primary human T-ALL cells (from the spleen of leukemic primary xenograft engrafted with cells of T-ALL patient FV, N16/0267) in 150 μl PBS were injected via tail vein into 1.5-month-old female NGS mice (Jackson Laboratories). Two weeks post-transplant, blood was collected via tail nick for analysis of hCD45 expression (engraftment) using PE-conjugated mouse anti-human CD45 antibody (Miltenyi Biotec, Auburn, CA; clone 5B1). Flow cytometry was performed on and analyzed using software FlowJo. One week later, mice were randomly divided into two groups (7 mice/group) and treated with either DMSO or 10 mg/kg USP7i in 2% Tween 80 + 10% DMSO in PBS. Treatment was administered on days 1-5 and 8-11 i.v., and on days 12 and 15-22 i.p. Blood was collected via tail nick on days 17 and 22 to measure tumor burden by staining for hCD45.
For toxicity studies, 8-week-old NOD.Cg-Prkdcscid male mice (#005557, Jackson Laboratories) were randomly assigned to treatment groups (3 mice/group). Mice were treated with either vehicle (10% DMSO, 2% Tween-80, and 10% captisol in PBS), 10 mg/kg USP7i, 10 mg/kg USP7i + 10 mg/kg GSKJ4, 10 mg/kg USP7i + 20 mg/kg GSKJ4, or 10 mg/kg USP7i + 50 mg/kg GSKJ4 i.v. daily for 5 days to evaluate treatment toxicity.
For combination treatment studies, 1 million JURKAT T-ALL cells were injected subcutaneously into the right flank of 8-week-old NOD.Cg-Prkdcscid male mice (#005557, Jackson Laboratories) with an equal volume of BD Matrigel, at 50 μl of cells to 50 μl Matrigel. After tumors reached 150-200 mm3, mice were randomly assigned to treatment groups and treated i.v. with vehicle (10% DMSO, 2% Tween 80, and 10% captisol in PBS; n=10), 10 mg/kg USP7i (n=6 per inhibitor), or 10 mg/kg USP7i + 50 mg/kg GSKJ4 (n=10) 5 times the first week, and then 3 times per week until tumors reached 1.5 cm3.
Analyses were performed using GraphPad Prism software (GraphPad Software). Statistical comparisons were made using the Student’s unpaired, two-sided t-test. p values <0.05 were considered statistically significant.
Complete blood cell count analysis
Mouse blood samples were collected via cardiac puncture and run on a Hemavet 950 FS (Drew Scientific, Inc., Miami Lakes, FL) to obtain blood cell counts.
Acknowledgments
We want to thank all members of the Ntziachristos laboratory for critical review of the manuscript and their comments. This work was supported by the NIH T32CA080621-11 Oncogenesis and Developmental Biology Training Grant and Cancer Smashers Postdoctoral Fellowship (to K.M.A.), and by the National Cancer Institute (R00CA188293-02), the American Society of Hematology, the Leukemia Research Foundation, the St. Baldrick’s Foundation, and the Zell Foundation (to P.N.). This work is also supported by AIRC IG 19186 grant to G.B. High-throughput sequencing data have been deposited into Gene Expression Omnibus, accession number GSE97435. Proteomics services were performed by the Northwestern proteomics core. Developmental Therapeutics Core (DTC) is supported by Cancer Center Support Grant P30 CA060553 from the National Cancer Institute, awarded by Robert H. Lurie Comprehensive Cancer Center. We want to thank Miklos Bekes and Tony Huang (New York University) for providing USP7-expressing plasmids.
References
Reference


