

Abstract
Eukaryotic communities commonly display a positive relationship between biodiversity and ecosystem function (BEF). Based on current studies, it remains uncertain to what extent these findings extend to bacterial communities. An extrapolation from eukaryotic relationships would predict there to be no BEF relationships for bacterial communities because they are generally composed of an order of magnitude more taxa than the communities in most eukaryotic BEF studies. Here, we sampled surface water of a freshwater, estuarine lake to evaluate BEF relationships in bacterial communities across a natural productivity gradient. We assessed the impact of habitat heterogeneity - an important factor influencing eukaryotic BEFs - on the relationship between species richness, evenness, phylogenetic diversity, and heterotrophic productivity by sampling co-occurring free-living (more homogenous) and particle-associated (more heterogeneous) bacterial habitats. Diversity measures, and not environmental variables, were the best predictors of particles-associated heterotrophic production. There was a strong, positive, linear relationship between particle-associated bacterial richness and heterotrophic productivity that was strengthened when considering evenness. There were no observable BEF trends in free-living bacterial communities. In contrast, per-capita but not community-wide heterotrophic productivity increased across both habitats as communities were composed of taxa that were more phylogenetically clustered. This association indicates that communities with more phylogenetically related taxa have higher per-capita heterotrophic production than communities of phylogenetically distantly related taxa. Our findings show that lake heterotrophic bacterial productivity can be positively affected by evenness and richness, negatively by phylogenetic diversity, and that BEF relationships are contingent on microhabitats. These results provide a stepping stone to compare biodiversity-productivity theory developed for Eukarya to bacterial ecosystems.
Introduction
Our planet is currently experiencing an extreme species extinction event (Thomas et al., 2004; Wake & Vredenburg, 2008). Concern about such declines in biodiversity has resulted in hundreds of studies evaluating the relationship between biodiversity and ecosystem functions (BEF), with a large focus on terrestrial plant ecosystems. BEF relationships are generally positive and asymptotic and thus biodiversity loss causes a small change in ecosystem function at first and then, at some tipping point, a dramatic decrease in function (Cardinale et al., 2012, 2012; Tilman et al., 2014). While the focus of local and global diversity loss is typically on eukaryotic organisms, bacterial biodiversity has also been shown to be decreasing at local scales within the human gut (Blaser, 2014) and terrestrial ecosystems (Singh et al., 2014). Of particular concern is the loss of diversity of bacterial guilds responsible for key geochemical transformations, such as methane oxidation (Levine et al., 2011) that controls rates of methane emissions. Yet, the study of BEF relationships has been more limited for Bacteria and Archaea.
Based on the asymptotic BEF relationships observed for eukaryotic communities of up to 20 species, the large range of species richness observed in natural bacterial communities (hundreds to thousands) may suggest an absence of bacterial BEF relationships. Several studies have indicated no BEF relationships with broad processes such as heterotrophic respiration or biomass production that are performed by many taxa (see figure 5 in Levine et al., 2011; Langenheder et al., 2006; Delgado-Baquerizo et al., 2016). Yet, other studies on denitrification (Philippot et al., 2013) and on narrow metabolic processes that are catalyzed by few bacterial taxa, such as methanotrophy (Levine et al., 2011), and the degradation of triclosan and microcystin (Delgado-Baquerizo et al., 2016) found evidence of bacterial BEF relationships.
Beyond the impact of the number of species, phylogenetic relatedness is predicted to influence BEF relationships based on the phylogenetic limiting similarity hypothesis. The phylogenetic limiting similarity hypothesis posits that distantly related organisms will have more dissimilar niches and therefore reduced competition and a higher likelihood of coexistence (Violle et al., 2011). Therefore, it predicts that communities will have high phylogenetic diversity due to competitive exclusion of closely related species. Indeed, some papers show relationships across different ecosystems between phylogenetic diversity and ecosystem functions (Cadotte et al., 2008; Jiang et al., 2010; Violle et al., 2011). However, studies with freshwater green algae (Fritschie et al., 2014; Venail et al., 2014) did not find this relationship. A recent study found the opposite result by showing that closely related green algal species had weaker competition and more facilitation than distantly related species (Narwani et al., 2017). While relationships between phylogenetic relatedness among community members and ecosystem function have been assessed in bacterial systems (Tan et al., 2012; Galand et al., 2015; Roger et al., 2016), most work has focused on low-diversity, experimentally-assembled communities with bacteria that can be grown in culture. We need to expand these findings to communities with richness levels typically found in natural communities.
The nature of BEF relationships and the mechanism(s) that underpins them may depend on habitat structure or heterogeneity. Increasing habitat heterogeneity has been found to enhance the strength of BEF relationships (Tylianakis et al. 2008), presumably due to a greater role for niche complementarity effects in heterogeneous environments (Cardinale 2011). While habitat heterogeneity contributes to increased diversity within bacterial populations and communities (Zhou et al., 2008; Shade et al., 2008), the influence of habitat heterogeneity on BEF relationships remains unknown for bacterial systems.
In this study, we hypothesized that bacterial diversity would be positively correlated with bacterial heterotrophic production, and that this relationship would be stronger in more heterogeneous environments. We simultaneously surveyed free-living and particle-associated surface water bacterial communities. Particulate matter comprises a variety of types and sizes of particles with each particle also harboring physicochemical gradients (Simon et al., 2002), and hence represents a more heterogeneous habitat than the surrounding water. We tested BEF relationships using a variety of diversity metrics including observed richness, species dominance, and phylogenetic diversity. We focused on heterotrophic bacterial production as our measure of ecosystem function, as it is a key process affecting freshwater bacterial growth that in turn fuels the macroscopic food web through their recycling of nutrients bound in organic matter (Cotner & Biddanda, 2002).
Methods
Lake sampling and sample processing
Surface water samples were collected at 1 meter depth from 4 long-term sampling stations (Steinman et al., 2008) in mesotrophic Muskegon Lake (Figure S1), which is a freshwater estuarine lake connecting the Muskegon River and Lake Michigan. These stations included the mouth of the Muskegon River (43.250133,-86.2557), the channel to Bear Lake (43.238717,- 86.299283; a hypereutrophic lake), channel to Lake Michigan (43.2333,-86.3229; oligotrophic lake), and the deepest basin of Muskegon Lake (43.223917,-86.2972; max depth = 24 m).
Samples were collected during the morning to early afternoon of 3 days in 2015 (May 12, July 21, & September 30) aboard the R/V W.G. Jackson. All water samples were collected with vertical Van Dorn samplers. Additionally, a vertical profile of temperature (T), pH, specific conductivity (SPC), oxidation-reduction potential (ORP), chlorophyll (Chlα), total dissolved solids (TDS), and dissolved oxygen (DO) was constructed at each station to characterize the water column using a calibrated YSI 6600 V2-4 multiparameter water quality sonde (Yellow Springs Instruments Inc.). Total Kjeldahl nitrogen (TKN), ammonia (NH3), total phosphorus (TP), and alkalinity (Alk) were processed from whole water while nitrate (NO3), phosphate (PO4), and chloride (Cl-) were hand filtered using a 60 mL syringe fitted with Sweeny filter holder with a 13 mm diameter 0.45 μm pore size nitrocellulose filters (Millipore) and were determined by standard wet chemistry methods in the laboratory (EPA, 1993).
Bacterial abundance by epifluorescence microscopy
Lake surface water samples were processed within 2-6 hours of their collection for determination of heterotrophic bacterial abundance. Samples (5 mL) were preserved with 2% formalin and 1 mL subsamples were stained with acridine orange stain and filtered onto black 25 mm 0.2 μm pore size polycarbonate filters (Millipore) at a maximum pressure of 0.1 Bar or 1.5 PSI. Prepared slides were stored frozen until enumeration by standard epifluorescence microscopy at 1000x magnification under blue light excitation (Hobbie et al. 1977). Bacteria within the field of view (100 μm x 100 μm) that were not associated with any particles were counted as free-living bacteria, whereas bacteria that were on particles were counted as particle-associated. Sample filtration may bias counts due to free-living or particle-associated cells being hidden on the underside of particles, , free-living bacteria settling on top of particles, or particle-associated cells dislodging. In the absence of any quantitative studies that have rigorously addressed this issue, we have assumed the net effect of these opposing methodological biases to be negligible in the present study.
Heterotrophic bacterial production measurements
Community-wide heterotrophic bacterial production was measured using [3H] leucine incorporation into bacterial protein in the dark (Kirchman et al. 1985; Simon and Azam, 1989). At the end of the incubation with [3H]-leucine, cold trichloroacetic acid-extracted samples were filtered onto 3 μm filters that represented the leucine incorporation by particle-associated bacteria (>3.0 μm). Each filtrate was collected and filtered onto 0.2 μm filters and the activity therein represented incorporation of leucine by free-living bacteria (>0.2 μm-<3 μm). Measured leucine incorporation during the incubation was converted to bacterial carbon production rate using a standard theoretical conversion factor of 2.3 kg C per mole of leucine (Simon and Azam, 1989). Per-capita heterotrophic production was estimated by dividing heterotrophic production by the cell counts measured in each fraction.
Preservation of bacterial filters in the field
Microbial biomass for the particle-associated (> 3 μm) fraction and the free-living (3–0.22 μm fraction) bacterial fraction was collected by sequential in-line filtration on 3 μm isopore polycarbonate (TSTP, 47 mm diameter, Millipore, Billerica, MA, USA) and 0.22 μm Express Plus polyethersulfone membrane filters (47 mm diameter, Millipore, MA, USA). We used 47 mm polycarbonate in-line filter holders (Pall Corporation, Ann Arbor, MI, USA)and an E/S portable peristaltic pump with an easy-load L/S pump head (Masterflex®, Cole Parmer Instrument Company, Vernon Hills, IL, USA). The total volume filtered varied from 0.8–2.2 L with a maximum filtration time of 16 minutes per sample. Filters were submerged in RNAlater (Ambion) in 2 mL cryovials, frozen in liquid nitrogen and transferred to a — 80°C freezer until DNA extraction.
DNA extraction, sequencing and processing
DNA extractions were performed using an optimized method based on the AllPrep DNA/RNA/miRNA Universal kit (Qiagen; McCarthy et al., 2015; details in supplementary methods). Extracted DNA was sequenced using Illumina MiSeq V2 chemistry 2 × 250 (500 cycles) of dual index-labelled primers that targeted the V4 hypervariable region of the 16S rRNA gene (515F/806R) (Caporaso et al., 2012; Kozich et al., 2013) at the Microbial Systems Laboratories at the University of Michigan Medical School in July 2016. RTA V1.17.28 and MCS V2.2.0 software were used to generate data. Fastq files were submitted to NCBI sequence read archive under BioProject accession number PRJNA412984. We analyzed the sequence data using MOTHUR V.1.38.0 (seed = 777; Schloss et al., 2009) based on the MiSeq standard operating procedure accessed on 3 November 2015 and modified with time (see data accessibility and supplemental methods). For classification of operational taxonomic units (OTUs), a combination of the Silva Database (release 123; Quast et al., 2013) and the freshwater TaxAss 16S rRNA database and pipeline (Rohwer et al., 2017, accessed August 18, 2016). All non-bacterial and chloroplast sequences were pruned out of the dataset and replicate samples were merged by summing sample sequencing read counts using the merge_samples function (phyloseq). A batch script for our protocol can be found in this project’s GitHub page at https://github.com/DenefLab/DiversityProductivity/blob/master/data/mothur/mothur.batch.taxass.
Estimating Diversity
To get the best estimate of each diversity metric, each sample was subsampled to 6,664 sequences (the smallest library size) with replacement and were averaged over 100 trials. Observed richness, Shannon entropy, and inverse Simpson’s index were calculated using the diversity function within the vegan (Oksanen et al., 2013) R package via the estimate_richness function in the phyloseq (McMurdie and Holmes, 2013) R package. Simpson’s Evenness was calculated by dividing the inverse Simpson’s index by the observed richness (Magurran, 2004). To calculate phylogenetic diversity, we first removed OTUs that had a count of 2 sequences or less throughout the entire dataset, as these are more prone to be artefacts originating from sequencing errors or the OTU clustering algorithm. Representative sequences of each of the 1,891 remaining OTUs were collected from the aligned fasta file produced within mothur, and header names in the mothur output fasta file were modified using bbmap (Bushnell, 2016) to only include the OTU name. A phylogenetic tree was created with FastTree using the GTR+CAT (general time reversible) model (Price et al., 2010). Mismatches between the species community data matrix and the phylogenetic tree were checked with the match.phylo.comm command (picante). Finally, both abundance-unweighted and -weighted phylogenetic diversity was estimated using specifications described in the next paragraph with the picante R package.
The most common phylogenetic diversity (PD) measure is Faith’s PD (Faith, 1992), however, this metric is very strongly correlated with species richness (Figure S2). Instead, the mean pairwise phylogenetic distance (or MPD) was calculated (ses.mpd function in the Picante R package (Kembell et al., 2010), null.model = “independentswap”). The MPD measures the average phylogenetic distance between all combinations of two taxa pulled from the observed community and compares it with a null community of equal richness pulled from the gamma diversity of all the samples (see supplemental methods for more details). Values higher than zero indicate phylogenetic evenness or overdispersion (higher phylogenetic diversity) while values less than zero indicate phylogenetic clustering (lower diversity) or that species are more closely related than expected according to the null community (Kembel, 2009). Thus, this phylogenetic metric is relative. From here, we will refer to the SESMPD as the “phylogenetic diversity” for simplicity and clarity.
Statistical analysis
Further analysis of sequence data was performed in R version 3.4.2 (R Core Team 2017; see supplemental methods for more details). To test which variable(s) were the best predictors of community and per-capita heterotrophic production, we performed variable selection via a lasso regression (using the glmnet R package, alpha = 1, and lambda.1se as the tuning parameter (Friedman et al., 2010)) on all of the environmental, biodiversity, and principal component variables. To further validate the lasso regression results, we performed ordinary least squares (OLS) regressions on all variables, including the principal components (PCA) of the euclidean distances of the environmental data. We used the Akaike information criterion (AIC) (accessed with the broom⸬glance() command) to select the best performing OLS regression model.
Data and code availability
Original fastq files can be found on the NCBI sequence read archive under BioProject accession number PRJNA412984. Processed data and code can be found on the GitHub page for this project at https://deneflab.github.io/DiversityProductivity/ with the main analysis at https://deneflab.github.io/DiversityProductivity/FinalAnalysis.html.
Results
Free-living communities had more cells and higher community-wide heterotrophic production but particle-associated communities had higher per-capita heterotrophic production
We observed an order of magnitude more cells per milliliter (p = 1 × 10⁻⁶, Figure 1A) and ~2.5 times more community-wide heterotrophic production in the free-living fraction (p = 0.024, Figure 1B). However, when calculated per-capita, particle-associated bacteria were on average an order of magnitude more productive than free-living bacteria (p = 7× 10⁻⁵, Figure 1C). Particle-associated and free-living cell abundances in samples taken from the same water sample did not correlate (Figure S3A). Heterotrophic production between corresponding free-living and particle-associated fractions from the same water sample were positively correlated for both community (Adjusted R2 = 0.40, p = 0.017; Figure S3B) and per-capita production rates (Adjusted R2 = 0.60, p = 0.003; Figure S3C).
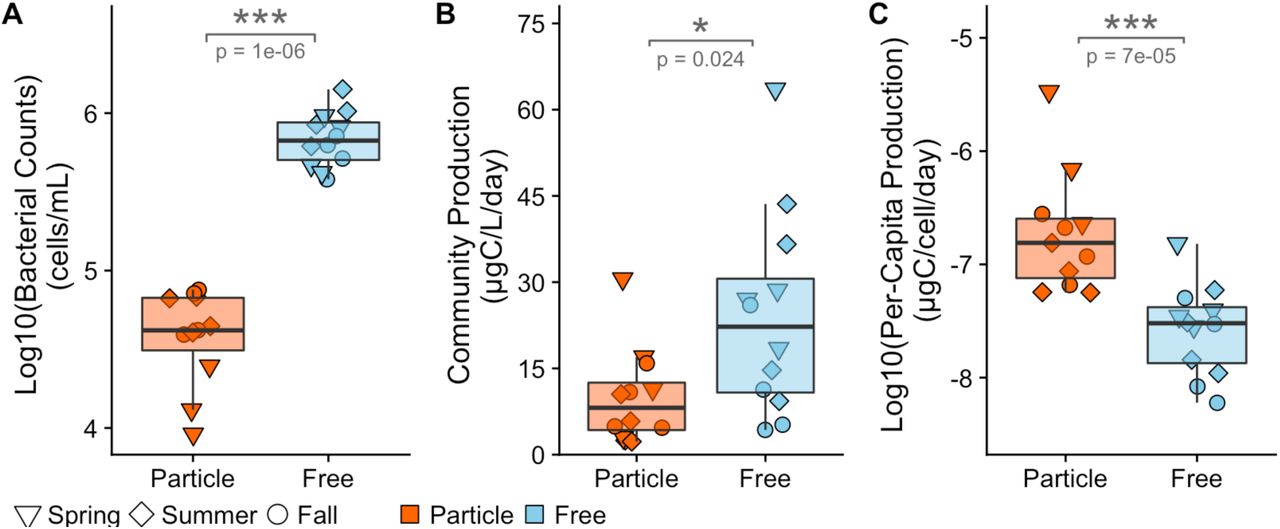
Particle-associated and free-living samples were taken from four stations within Muskegon Lake during 2015 in May, July, and September. (A) Free-living bacteria were an order of magnitude (106 cells/mL) more abundant compared to particle-associated bacteria. (B) Free-living bacteria were more heterotrophically productive compared to particle-associated bacteria. (C) Particle-associated bacteria were disproportionately heterotrophically productive per cell compared to free-living bacteria.
Particle-associated communities are more diverse in terms of observed richness and Shannon Entropy while free-living communities are more phylogenetically diverse
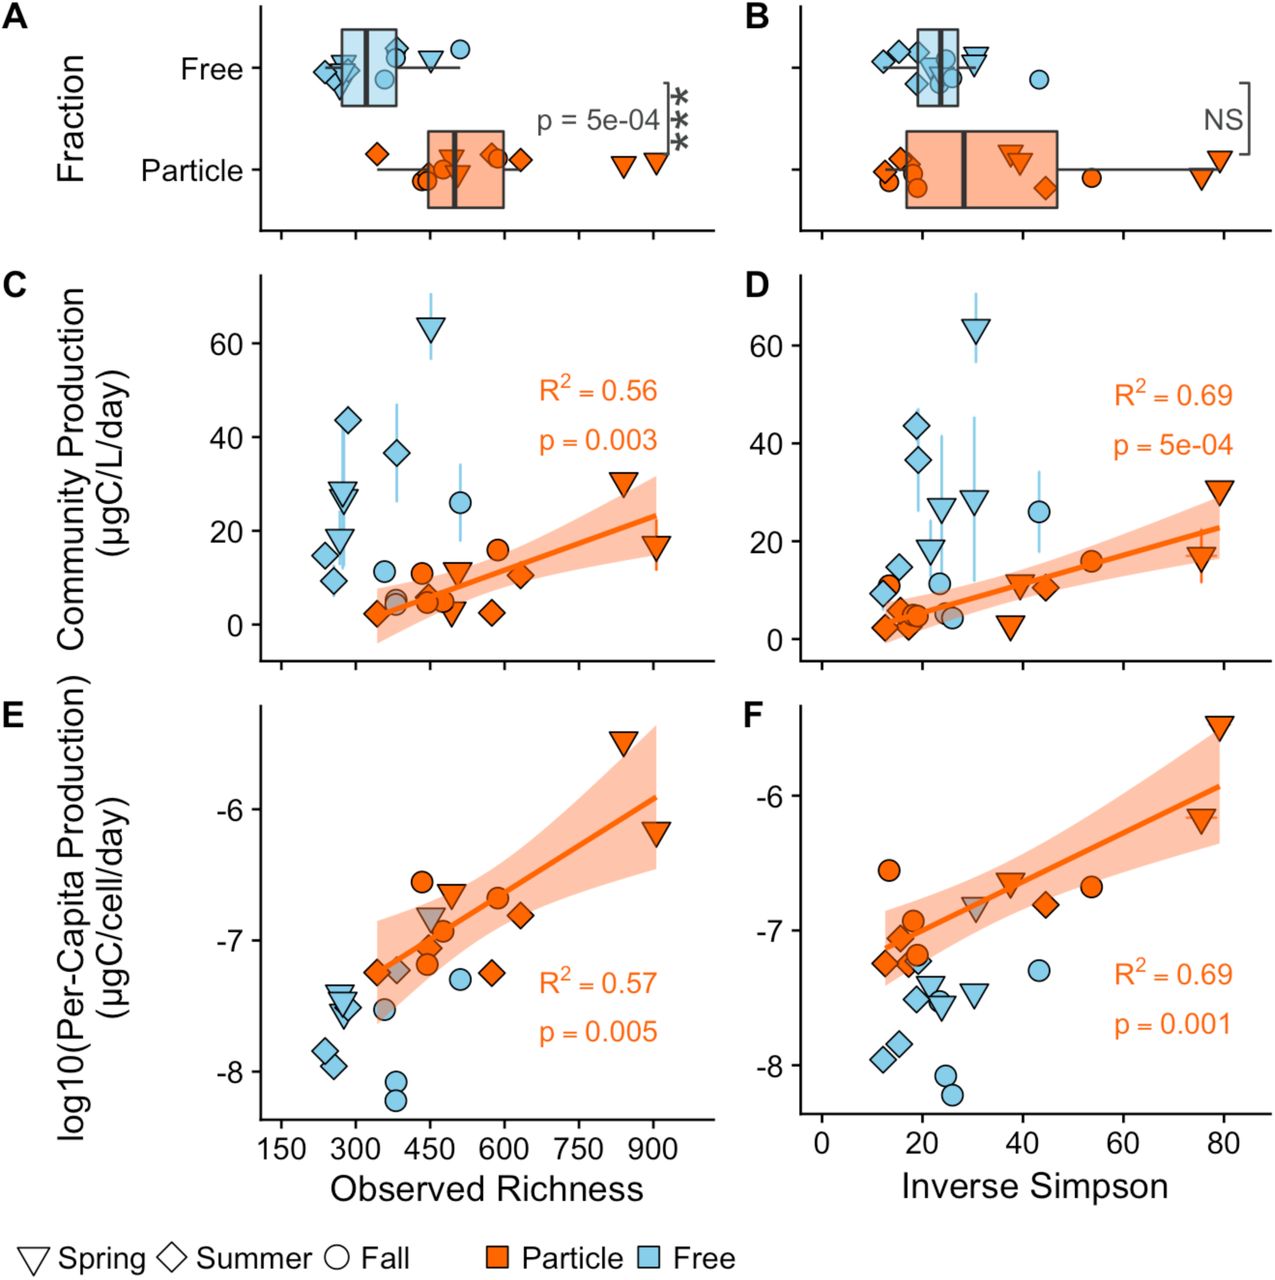
Across all samples, particle-associated bacterial communities were more diverse than free-living communities when considering richness and Shannon entropy (Figures 2A & S4A), but similar in the inverse Simpson’s index and Simpson’s evenness (Figure 2B & S4B).

Top panel: Differences in (A) the observed richness and (B) the inverse Simpson diversity metrics between particle-associated (orange) and free-living (blue) habitats. Middle panel: Biodiversity and community-wide heterotrophic production (ugC/L/day) relationships. The y-axis between (C) and (D) is the same, however, the x-axis represents (C) richness and (D) Inverse Simpson. Bottom panel: Biodiversity and log10(per-capita heterotrophic production) (ugC/cell/day) relationships. The y-axis between (E) and (F) is the same, however, the x-axis represents (E) richness and (F) Inverse Simpson’s index. Solid lines represent ordinary least squares models for the free-living (blue) and particle associated (orange) communities. All R2 values represent the adjusted R2 from an ordinary least squares model.
Particle-associated bacterial community richness was always higher than in free-living communities and was maintained across the four sampling stations in the lake (Figure S5A). Particle-associated samples at the river and Bear lake stations were on average more OTU-rich than the outlet to Lake Michigan and the Deep stations. Additionally, the river station had almost twice the inverse Simpson’s value as compared with all other lake stations (Mean inverse Simpson Indices: Outlet = 23.6; Deep = 23.7; Bear = 35.3; River = 59.1; Figure S5A).
Particle-associated communities were more phylogenetically clustered than free-living communities based on unweighted phylogenetic diversity (p = 0.01, Figure 3A). Compared to other particle-associated samples, the outlet station that connects to oligotrophic Lake Michigan had a much larger unweighted phylogenetic diversity, indicating phylogenetic overdispersion (Figure S5A). Nevertheless, no sample across the entire dataset differed significantly from the null model with a significance threshold p-value of 0.05. There was no difference between weighted phylogenetic diversity in particle-associated versus free-living communities (Figure S5A).

(SESMPD; ses.mpd function in picante with null.model = “independentswap”). Positive phylogenetic diversity values represent communities that are phylogenetically diverse (i.e. overdispersed) while negative phylogenetic diversity values represent communities that are phylogenetically less diverse (i.e. clustered) compared to a null community with equal species richness. (A) Phylogenetic diversity was higher in free-living communities compared to particle-associated communities. (B) Negative relationship between observed richness and phylogenetic diversity. (C) Absence of phylogenetic diversity and community bulk heterotrophic production μgC/L/day) relationships. (D) Negative phylogenetic diversity and per-capita heterotrophic production μgC/cell/day) relationship. Linear models in figure B and D represent trends over all samples.
Diversity-Productivity relationships are only observed in particle-associated communities
There was a strong, positive, linear BEF relationship between community-wide (Figures 2C-D & S4C-D) and per-capita (Figures 2E-F & S4E-F) heterotrophic productivity and all richness and evenness diversity metrics in the particle-associated communities, while no BEF relationships were observed for the free-living communities. The inverse Simpson’s index explained the most amount of variation in community-wide (Figure 2D; Adjusted R2 = 0.69, p = 5 × 10⁻⁴) and per-capita (Figure 2F; Adjusted R2 = 0.69, p = 0.001) heterotrophic production. These results are robust across a range of minimum OTU abundance filtering thresholds (see Sensitivity Analysis of Rare Taxa in the supplemental methods and Figure S6) and hold up for all threshold levels in Inverse Simpson and for richness until removal of 25 counts (community-wide heterotrophic production) and 15 counts (per-capita heterotrophic production). When the particle-associated and free-living samples were combined together into one linear model to test an overall relationship between diversity and productivity, there was no relationship (richness: p = 0.86; Shannon: p = 0.99; Inverse Simpson: p = 0.36), with the exception of a weak correlation for Simpson’s Evenness (Adjusted R2 = 0.12, p = 0.054). However, when particle-associated and free-living samples were combined together into one linear model to test an overall relationship between diversity and productivity, there was a strong relationship with observed richness (Adjusted R2 = 0.63, p = 3 × 10⁻⁶), which broke down as evenness was weighed more (Figure S7: Shannon: Adjusted R2 = 0.52, 6 × 10⁻⁵; Inverse Simpson: Adjusted R2 = 0.48, p = 2 × 10⁻⁴; Simpson’s Evenness: p = 0.48).
Phylogenetic diversity correlated with per-capita heterotrophic production but not with community-wide production
Abundance-weighted phylogenetic diversity was not correlated with community or percapita heterotrophic production (Figure S8C - S8D) and therefore no further analyses were performed with this diversity metric.
There was a moderate, negative, linear relationship when particle-associated and free-living samples were combined together into one linear model to test an overall relationship between unweighted phylogenetic diversity and observed richness (Figure 3B; Adjusted R2 = 0.35, p = 0.001). To further validate this trend, randomized communities were generated with an equal richness as the samples but with OTUs randomly picked across the dataset. The unweighted phylogenetic diversity was then calculated and regressed against each the randomized richness and there was no relationship (Figure S9; Adjusted R2 = −0.02, p = 0.44), verifying the negative relationship in the actual samples. When particle-associated and free-living samples were individually run in separate linear models to test for habitat-specific relationships between unweighted phylogenetic diversity and observed richness, no trend was found in either particle-associated or free-living models (Figure 3B; Particle: Adjusted R2 = 0.14, p = 0.12; Free = Adjusted R2 = −0.10, p = 0.97). In other words, particle-associated and free-living diversities did not have individual effects on community-wide or per-capita heterotrophic production but rather, all samples were necessary for a correlation between per-capita heterotrophic production and unweighted phylogenetic diversity.
There was no correlation between phylogenetic diversity and community-wide heterotrophic production (Figure 3C). However, a negative correlation was found when particle-associated and free-living samples were combined into one linear model to test an overall relationship between unweighted phylogenetic diversity and per-capita heterotrophic production (Figure 3D; R2 = 0.42, p = 5 × 10⁻⁴). Therefore, these two results in combination indicated that communities composed of more phylogenetically similar OTUs had a higher per-capita heterotrophic production rate.
Diversity, and not environmental variation, is the best predictor of particle-associated heterotrophic production
To identify variables that best predicted community-wide and per-capita heterotrophic production (i.e. remove variables that were correlated with each other and/or uninformative variables), we performed lasso regression with all samples and individually with particle-associated and free-living samples. For prediction of community-wide heterotrophic production, only the inverse Simpson’s index was selected for particle-associated samples whereas pH and PC5 were selected for free-living samples, and no variables were selected when all samples were included in the lasso regression. In contrast, for per-capita heterotrophic production, temperature and the inverse Simpson’s index were selected for particle-associated samples whereas pH was the only predictor for free-living samples, and observed richness was the only predictor for all samples (plotted in Figure S7A). Therefore, the best model for particle-associated microhabitats always included inverse Simpson’s index whereas free-living samples only included environmental variables, such as pH.
To further verify that there were no confounding impacts of seasonal and environmental variables on community-wide and per-capita heterotrophic production, we performed ordinary least square (OLS) regressions and a dimension-reduction analysis of the environmental variables through a principal components analysis (Table S1 & S2; Figure S10). Specifically, the first 2 environmental axes explained ~70% of the environmental variation in the sampling sites (Figure S10). Next, we predicted community-wide and per-capita heterotrophic production with all environmental variables and the first six principal components as predictor variables with individual particle-associated and free-living samples, and combined (i.e. all samples) models (Table S1 & S2). The best single predictor of community-wide heterotrophic production was Inverse Simpson for particle-associated samples (AIC = 74.34; R2 = 0.69), pH for the free-living samples (AIC =98.43; R2 = 0.49, p = 0.006), and pH for all samples (AIC = 192.16; R2 = 0.35) (Table S1). Whereas, the best single predictor of per-capita heterotrophic production was Inverse Simpson for particle-associated samples (AIC = 8.29; R2 = 0.69), pH for the free-living samples (AIC = −2.39; R2 = 0.78), and observed richness for all samples (AIC = 24.72; R2 = 0.63) (Table S2). Thus, the OLS regressions are in agreement with the lasso regressions.
Discussion
We examined bacterial biodiversity-ecosystem function (BEF) relationships in relation to two microhabitats within freshwater lakes: particulate matter and the surrounding water. First, we found that community-wide and per-capita heterotrophic productivity of particle-associated but not free-living bacterial communities showed a positive, linear BEF relationship with both richness and evenness contributing. Second, particle-associated heterotrophic production was better explained by diversity (i.e. inverse Simpson’s index) than by environmental parameters. Third, across both particle-associated and free-living communities, higher richness was associated with lower phylogenetic diversity which, in turn, was associated with higher per-capita heterotrophic bacterial production but not associated with community-wide heterotrophic production.
Microbes have a large diversity of metabolisms and the choice of which to focus on may inherently affect the BEF relationship. Indeed, “narrow” metabolic processes that are catalyzed by a small subset of taxa within bacterial communities, such as nitrogen and sulfur cycling, have been found to display BEF relationships (Levine et al., 2011; Delgado-Baquerizo et al., 2016). In contrast, for “broad” processes that are performed by the majority of taxa within a bacterial community, such as heterotrophic production (focus of the present study) and respiration, functional redundancy appears to weaken or remove the presence of BEF relationships (Griffiths et al., 2000; Langenheder et al., 2006; Wertz et al., 2006; Levine et al., 2011; Peter et al., 2011, Galand et al, 2015). These findings are in line with the absence of a BEF relationship for free-living bacterial communities in our study.
However, the above results and hypotheses surrounding narrow and broad processes are in conflict with the strong BEF relationship we observed in particle-associated bacterial communities. As such, our study signifies that microhabitats or habitat heterogeneity can influence bacterial BEF relationships, in agreement with previous research in eukaryotic systems across a variety of ecosystems (Tylianakis et al., 2008; Cardinale 2011; Zeppilli et al., 2016). A study using controlled stream mesocosms by Cardinale (2011) found that niche complementarity effects are particularly important in more heterogeneous environments. In more heterogeneous streams, algal populations used different nutrients and avoided direct competition for resources, resulting in unique species occupying distinct and local microhabitats.
Our observational study could not directly test the role of niche complementarity effects. However, support for niche complementarity alone or in combination with species selection as the mechanism underlying the BEF relationship in particle-associated habitats is provided by the inverse Simpson’s index being the strongest predictor of community-wide heterotrophic production. As the inverse Simpson’s index represents a measure of species dominance, it is strongly affected by the evenness of abundant species. Communities that are more even have an increased likelihood for complementary species to neighbor each other.
In our study, there are several reasons why heterogeneity of particulate matter may allow for niche complementarity effects to occur and result in BEF relationships. First, particles have a two-fold layer of heterogeneity as they (A) may be composed of different substrates such as organic matter from terrestrial or aquatic environments and either heterotrophically or photosynthetically derived (Grossart, 2010), and (B) each particle may comprise physicochemical gradients as well (Simon et al., 2002). Second, microbial interactions are more likely to occur between cells aggregated on particles as the interaction distances are usually much shorter (Cordero & Datta, 2016) compared to free-living bacterial cells. In fact, genes mediating social interactions, such as motility, adhesion, cell-to-cell transfer, antibiotic resistance, mobile element activity, and transposases, have been found to be more abundant in marine particles than compared to the surrounding water (Ganesh et al., 2014).
The importance of niche complementarity in microbial communities can also be deduced from recent findings in the field of microbiology, which have shown widespread metabolic interdependence among bacterial community members. First, a 2016 study that reconstructed 2,540 draft genomes of microbes found that most bacteria specialize in one particular step in sulfur and nitrogen pathways and “hand-off” their metabolic byproducts to nearby organisms (Anantharaman et al., 2016). It is likely that metabolic hand-offs, a specific form of bacterial facilitation, will occur more in particle-associated compared to free-living communities. Indeed, Datta and Cordero’s (2016) work on model marine particles found that taxa that are incapable of breaking down particles and instead rely on carbon produced by primary degraders thrive in later phases of particle degradation. Second, Lilja and Johnson (2016) demonstrated that different microbial cell types eliminate inter-enzyme competition by cross feeding, which increases substrate consumption by allowing intracellular resources to go towards a single enzyme, rather than having two enzymes that perform two separate reactions compete for nutrients within a cell. Third, some bacteria are unable to grow in laboratory cultures unless they are in co-culture with other organisms, which may be due to metabolic hand-offs or to growth factors such as siderophores or catalases (Stewart, 2012).
Taking into account that (i) closely related taxa share more genes and metabolic pathways than distantly related bacterial taxa (Konstantinidis & Tiedje, 2005; Kim et al., 2014) and (ii) bacteria commonly have incomplete metabolic pathways, we propose that closely related bacteria may be most likely to hand-off their metabolic byproducts. This may be why we found that new taxa added to the community represented taxonomic clades similar to or already present in the community, and that these communities with lower phylogenetic diversity (relative to expected) had higher productivities. This result is in line with a recent study using freshwater algae and vascular plants that reject predictions from the phylogenetic limiting similarity hypothesis (Narwani et al., 2017). However, recent bacteria-focused studies from Russel et al. (2017) and Venail and Vives (2013) found higher levels of antagonism (Russel et al., 2017) or more bacterial productivity (measured through colony forming units per mL;Venail and Vives, 2013) with more distantly related taxa. Both of these studies were performed in the lab with r-selected (i.e. copiotrophic) species grown in stable, warm, aerobic, agar plate conditions. Thus, Venail and Vives (2013) and Russel et al. (2017) inherently break up potential interdependent relationship between bacteria either by creating artificial communities or evaluating pairwise interactions and remove the natural effect of spatial heterogeneity, environmental fluctuations, and the rest of the bacterial community. As a result, future studies on bacterial interactions and the role of phylogenetic diversity will need to maintain natural structure and complexity in bacterial communities.
Previous studies on bacterial BEF relationships have used three approaches to manipulate bacterial diversity (Krause et al., 2014): (1) dilution to extinction in which complex communities are diluted to more simple communities (Wertz et al., 2006; Peter et al., 2011; Philippot et al., 2013; see Roger et al., 2016 for a review of this approach), (2) manually assembled communities in culture (Tan et al., 2012; Salles et al., 2009), or (3) natural or manipulated environmental communities (Griffiths et al., 2000; Levine et al., 2011; Galand et al., 2015). In this study, we took the latter approach. In contrast to the other two approaches, this had the benefit of (1) maintaining high diversity with both abundant and rare taxa, (2) including both r- and k-selected organisms, (3) allowing natural environmental and ecological forcings to shape the community, and (4) evaluating BEF relationships in diversity and productivity ranges that reflect natural communities. Admittedly, three inherent weaknesses to our approach were that (1) we cannot measure all the potential variables that influence heterotrophic productivity, (2) we only have 24 samples for a 12 versus 12 study, and (3) our analysis is correlational and we cannot manipulate the system to unequivocally separate causes and consequences of bacterial production. For example, strong correlations with heterotrophic production and pH in the free-living samples (Table S1 & S2) may point to pH being a consequence of rather than a cause of varying production levels. This is because bacterial production and bacterial respiration are positively correlated (del Giorgio & Cole, 1998) and with increased respiration, pH may decrease due to CO2 dissolution into the water.
Finally, we acknowledge that the typical sampling of bacterial communities and analysis using DNA sequencing reflects all bacteria present in the community and not necessarily only the active members of the community contributing to a given ecosystem function. In freshwater systems, up to 40% of cells from the total community have been shown to be inactive or dormant (Jones and Lennon, 2010). If one were to sample plant communities in an analogous way to bacterial systems, one would measure the diversity of all the above- and below-ground plant biomass including seeds, pollen, and detrital biomass. In this context, it is interesting to reflect on the richness in absence of function (i.e. x-intercept) of the observed BEF relationship which is 295. This could be interpreted as a baseline level of 295 inactive (either dead or dormant) bacterial OTUs and in the case of particulate material, environmental DNA adhered the substrate, in the community. This value represents 35-85% of the total particle-associated communities and may obscure the actual diversity (and BEF relationship) of the bacterial community (Carini et al., 2016).
In conclusion, we show that increased bacterial diversity, especially when measured by the inverse Simpson’s index, leads to increased community-wide and per-capita bacterial heterotrophic production in particle-associated but not in free-living communities. As such, we extend the validity of principles of the impact of microhabitat on BEF relationships from Eukarya to Bacteria, contributing to current efforts to integrate ecological theories into the field of microbiology (Barberán et al., 2014). Additionally, we show that communities with low phylogenetic diversity have higher per-capita heterotrophic production rates, which we hypothesize to be related to genome evolutionary patterns specific to bacteria that result in the dependence on metabolic hand-offs. Differences between Bacteria and Eukarya in patterns of genome evolution and its ecological consequences, as well as in how active and dormant fractions of the community are measured need to be taken into account when trying to integrate BEF studies across all domains of life.
Acknowledgements
This work was supported by the National Science Foundation Graduate Research Fellowship Grant No. DGE 1256260 (MLS), the University of Michigan Office for Research MCubed program (VJD), the American Society of Microbiology-Undergraduate Research Fellowship, the University of Michigan Honors Summer Fellowship, and the Beckman Scholars Program (EC). RP was supported by Ghent University (BOFDOC2015000601) and a Sofina Gustave-Boёl grant from the Belgian American Educational Foundation.We are grateful to the crew of the R/V W.G. Jackson and the Grand Valley State University Robert B. Annis Water Resources Institute science staff, and the generous help we received in the field from Amelia Waters and Daniel S.W. Katz. Thank you to Kyle Buffin and Amadeus Twu for help with DNA extractions. Finally, we thank Deborah Goldberg, George Kling, and members of the Denef, Dick, and Duhaime laboratories for their comments on the manuscript.
References


