

ABSTRACT
Experimental work has revealed many genes and pathways affecting flowering time in Arabidopsis thaliana. Despite this, it has been difficult to reveal whether these genes also contribute to the natural variation in flowering-time in the worldwide population. Using a new polygenic association mapping method, we earlier revealed 33 loci associated with flowering time variation in the wild collected A. thaliana accessions from the 1,001-genomes project. Together they explained 66% of the additive genetic variation in time to flowering at 10°C in the greenhouse. Here, we explore how these loci together contribute to the flowering time variation between genetically defined subpopulations collected from the native range of the species. For some loci both alleles were present in all populations, whereas for others one of the alleles was missing in some subpopulations. The globally segregating alleles contributed mostly small individual effects, but together captured the overall pattern of early to late flowering between the subpopulations, illustrating the valuable contribution by polygenic adaptation for flowering time. Several of the loci with local alleles had relatively large effects on flowering and in this way contributed to the more extreme adaptations of some local populations. Several cases of long-range LD between genes in biological pathway were found, indicating a possible role of local coevolution of functionally connected polymorphisms in local adaptation. Overall, this study provides new insights to the polygenic architecture of flowering time adaptation that has facilitated the colonisation of a wide range of ecological habitats by this self-pollinating plant.
INTRODUCTION
Arabidopsis thaliana, a widely used model species in plant biology, has colonised a wide range of ecological habitats around the world. One of the most studied adaptive traits is flowering time due to its role in ecological adaptation and potential impact on agronomic production in related species. Molecular studies in the laboratory, primarily using the reference accession Col-0, have identified many genes with the potential to alter flowering time. Many of them are connected in functionally related pathways, with examples including photoperiod control (El-Assal et al., 2001; Filiault et al., 2008), vernalization (Li et al., 2014; Shindo et al., 2005) and plant hormone signalling (Sharma et al., 2016). The genetics of natural flowering time variation has been studied using a variety of approaches, including QTL and genome wide association (GWA) studies in experimental crosses and collections of wild accessions (Atwell et al., 2010; Alonso-Blanco et al., 2016; Salomé et al., 2011; Brachi et al., 2010). A few associated loci have been dissected to reveal the underlying molecular mechanisms including, for example, important roles of photoreceptors such as CRY2 (El-Assal et al., 2001) and PHYB (Filiault et al., 2008), and signalling molecules such as FT (Schwartz et al., 2009) and FRI (Clarke and Dean, 1994).
Based on the experimental genetics work, flowering time adaptation is expected to be highly polygenic, but studies of natural populations rarely reveal more than a handful of the loci contributing to the genetic variation of this trait (Alonso-Blanco et al., 2016; Shindo et al., 2005; Atwell et al., 2010; Brachi et al., 2010). There are many possible reasons for this. One is that some polymorphisms only lead to small changes the phenotype, making them hard to detect in genome-wide studies where significance thresholds are by necessity very stringent (Collins et al., 2007; Kopp and Hermisson, 2009). Such minor effect polymorphisms could, however, together facilitate rapid selection responses by changing the frequency of available standing variants across many such loci (Teotónio et al., 2009; Orozco-terWengel et al., 2012; Burke et al., 2014). Another possible reason is the confounding between adaptive alleles and the genome-wide genotype of the adapted populations. This confounding leads to an excess of false positive associations if not corrected for, and often a reduction in statistical power if the current methods to account for it are used. The loss of power due to corrections for the effects of population structure is a particular problem in studies of flowering time adaptation in natural populations. This as adaptation to a great extent has taken place along a north-south cline, leading to a confounding between locally adaptive alleles and other changes throughout the genome due to other population genetics forces other than selection on flowering time. It is therefore a considerable challenge to statistically detect adaptive polymorphisms with small effects, and especially when they are confounded with population structure. As a result, the polygenetic basis for flowering time adaptations across the native range of A. thaliana is still relatively unexplored. Nonetheless, it is essential to gain a deeper insight into the polygenic basis of this trait to explore the joint contributions by major and minor effect loci to local and global environmental adaptation.
We have earlier developed and used a new statistical approach to map 33 loci contributing to the polygenic basis of flowering time in 1,004 wild collected Arabidopsis thaliana accessions from the 1,001-genomes project (Zan and Carlborg, 2017). Together these loci contribute 55 (66)% of the total (additive) genetic variance in this dataset. Here, we explore how these loci contribute to the flowering time variation between the earlier genetically defined subpopulations that have colonized the native range of the species (Alonso-Blanco et al., 2016). Loci with globally segregating alleles made, in general, small individual contributions to flowering but together captured the overall pattern of flowering time differences between the subpopulations, suggesting a role of polygenic adaptation in adaptation. The alleles with more restricted geographic distributions made important contributions to the more extreme local adaptations of some subpopulations. The long-range LD between polymorphisms in genes of the same biological pathways suggests that parallel evolution of different pathways has contributed to local adaptation in different geographic areas. Overall this reanalysis of public data provides new insights to the polygenetic basis of flowering time adaptation in A. thaliana.
RESULTS
Flowering time differentiation in A. thaliana accessions from the world-wide population
Flowering time variation of Arabidopsis thaliana accessions sampled from across its native range is strongly associated with geographic variation in climate (Caicedo et al., 2004; Stinchcombe et al., 2004; Samis et al., 2008). To reveal the geographical differentiation in flowering time for the 1001-genomes collection under green house conditions, we analysed two phenotypes - flowering time at 10 and 16°C - on 1,004 Arabidopsis thaliana accessions downloaded from http://www.1001genomes.org (Alonso-Blanco et al., 2016). The genetic population structure and geographic sampling locations for the analysed accessions are illustrated in Figure S1. The two phenotypes were highly correlated (Pearson correlation = 0.88; P< 2.2 × 10⁻¹⁶; Figure S2), and for clarity we therefore focus on the results for flowering time at 10°C (FT10) here.
There was a significant latitudinal cline for FT10 (Pearson correlation = 0.37; P < 2.2 x 10⁻¹⁶; Figure 1A and 1D) and a significant correlation between FT10 and the mean temperature at the sampling locations for the accessions (Pearson correlation = −0.31; P < 2.2 × 10⁻¹⁶; Figure 1B). There was also a substantial variation in the correlation between FT10 and temperature, and FT10 and Latitude, among the genetically defined and geographically separated subpopulations defined by (Alonso-Blanco et al., 2016) in their admixture analysis of this population (Figure 1D). The proportion of the total genetic variance that was additive for FT10 was 82%, as estimated by fitting the IBS (Identity By State) kinship matrix estimated from the genotyped SNPs in standard mixed model analysis (Zan and Carlborg, 2017).
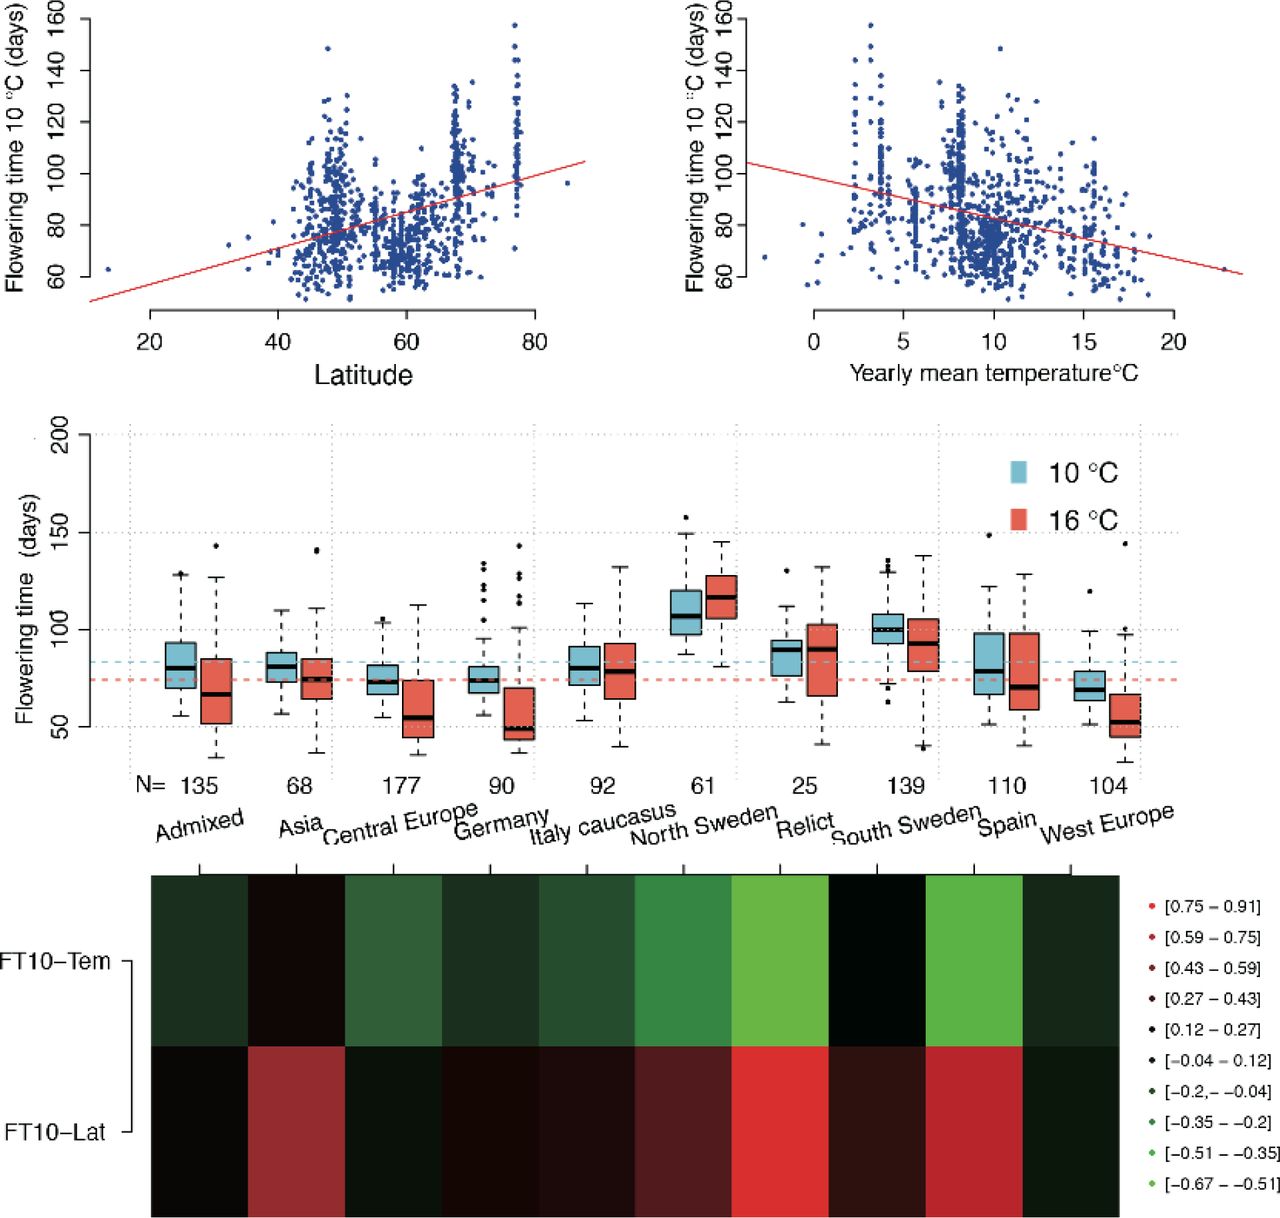
Flowering-time measured at 10°C under controlled green house condition is significantly correlated both with latitude (A) and temperature (B) at the sampling sites for the 1,004 analysed accessions from the 1,001 genomes A. thaliana collection (Alonso-Blanco et al., 2016). The flowering time (C) and correlations between FT10-temperature/FT10-Latitude (D) varies amongst the subpopulations defined in the admixture analysis in this population by (Alonso-Blanco et al., 2016).
Distribution of flowering time alleles in the world wide A. thaliana population
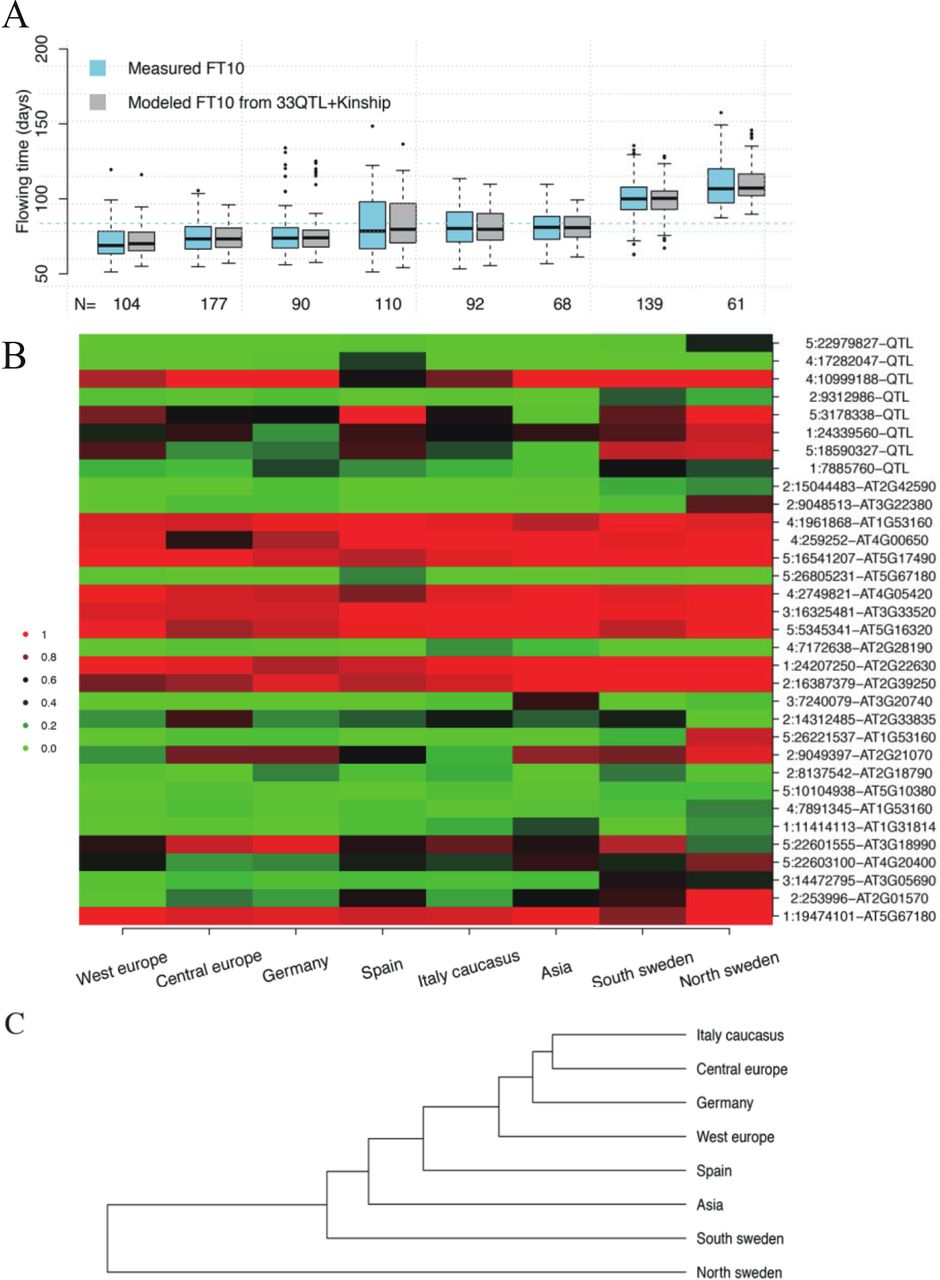
We earlier reported 33 loci associated with FT10 variation in this collection of accessions from the 1,001-genomes project that together explain 55 (66)% of the total (additive) genetic variance for this trait (Zan and Carlborg, 2017). Here, we evaluate how the alleles in these loci contribute to the flowering time variation between the geographically divided and genetically distinct subpopulations identified in this dataset by (Alonso-Blanco et al., 2016). Our assumption in the analyses is that the allele-frequency differences between the subpopulations across these loci, which in its most extreme form will be the complete presence/absence of alleles, will provide information about the genetic architecture of global trait variation and its role in adaptation along latitudinal or geographical clines and in local subpopulations (Allard et al., 1972; Mitton et al., 1977; Barker et al., 2011). The overall pattern of early to late flowering times for the subpopulations in this dataset is captured well by the combined additive effects of the 33 associated loci (Figure 2A). The revealed polygenetic genetic architecture is thus likely to make important contributions to the flowering time variation in the world wide A. thaliana population, making further evaluations of contributions by different subsets of loci motivated. These are described in detail below.
Figure 2B illustrates that the late flowering populations have accumulated late flowering alleles (red) across many loci, where these alleles range in effects from large to small (effect sizes sorted from top to bottom; Figure 2B). In particular the late flowering north Swedish accessions have high frequencies for late flowering alleles across many loci. The overall pattern of the allele-frequencies across the populations (Figure 2B) suggested that populations from nearby geographic locations had a greater overall similarity in allele-frequencies across the loci. Analyses to cluster the sub populations based on the allele frequencies across these 33 loci (Figure 2C), and the pairwise correlations of the allele-frequency spectrums between the populations (Figure S3), both support this. This shows, for example, the close relationship between the accessions from Germany and Central Europe (Figure 2B, Figure 2C). An exception from this general trend was that the relatively late flowering accessions from southern Sweden were overall more similar to the earlier flowering accessions from Central Europe and Germany, than to the late flowering accessions from northern Sweden. This observation will be explored in greater detail later in this report.

Flowering times in, and distributions of early and late flowering alleles across, the 8 subpopulations of the 1,001 genomes collection. A. The flowering times for the 8 subpopulations are modelled well by the additive effects of the 33 loci associated with flowering time. B. Distribution of allele frequencies for the 33 loci in the 8 subpopulations in this data defined by (Alonso-Blanco et al., 2016). Intensity of green/red illustrates frequency of major early/late-flowering alleles, respectively. The subpopulations are sorted from left to right by increasing average flowering time (columns) and the associated loci from top to bottom by large to small additive effect on flowering time (rows). X:YYYYY-ZZZ represent a locus as chromosome:position:type, where position is in bp and “QTL”/locus-id are used to indicate loci detected by a direct association to FT10 (GWAS) or the differential expression of the particular locus. C. A dendrogram showing how the subpopulations cluster based on the allele frequency spectrum across the 33 associated loci.
For some of the loci associated with flowering time differences in this population, both alleles are present at intermediary (here defined as MAF > 0.1) allele frequencies in all the subpopulations (for example chr2: 16,387,379bp and chr4: 1,961,868bp; Figure 2B; Figure S4A-B). For others, one of the alleles is only present at low frequency (MAF < 0.1) or entirely absent in one or more of the subpopulations (for example chr2: 9,312,968bp, chr4: 1,728,204bp and chr5: 22,979,827bp; Figure 2B; Figure S4C-E). This suggests that natural flowering time variation in A. thaliana is due to the combined effects of selection on global and local allelic variation.
Contribution by polygenic adaptation to global flowering time adaptation
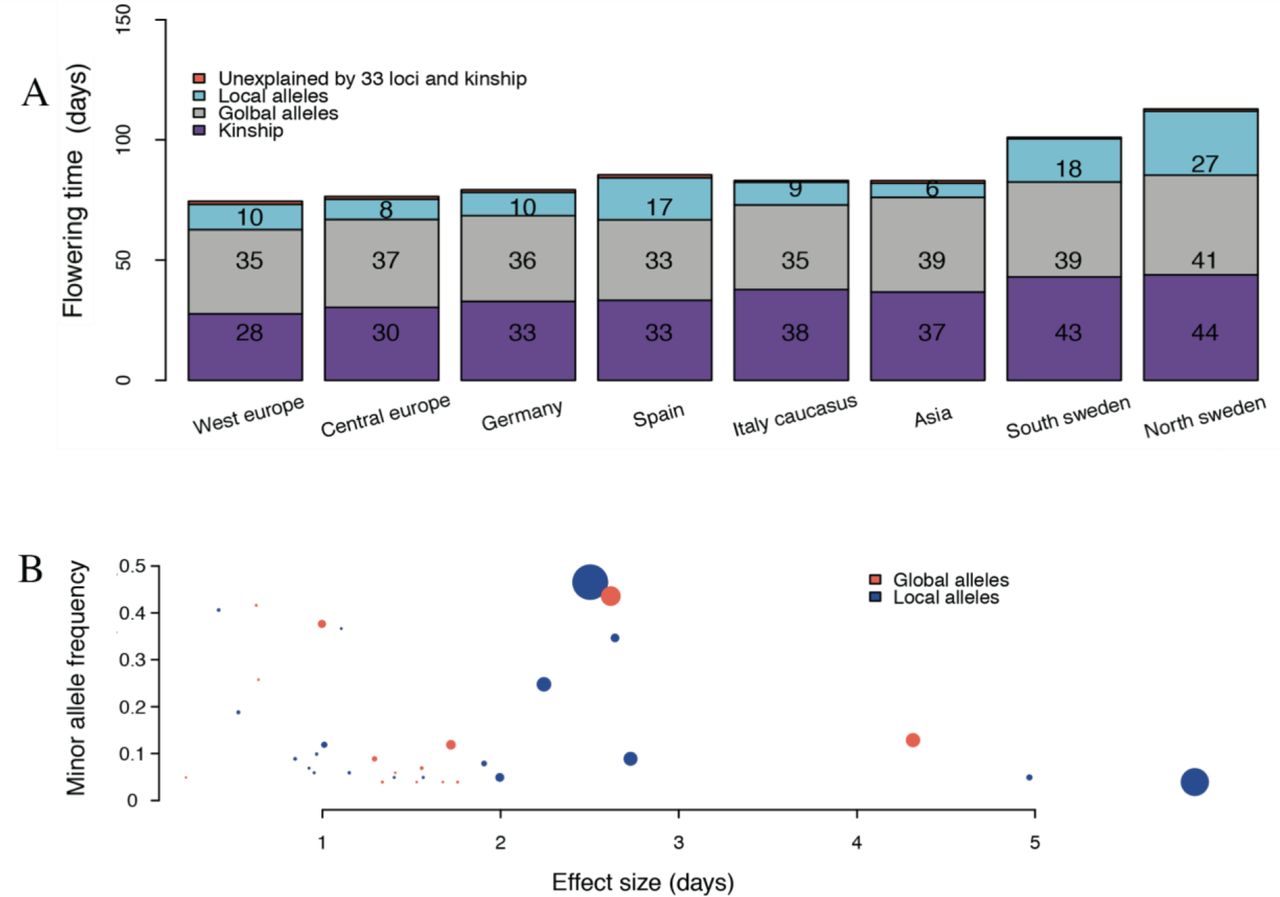
To evaluate the contribution by global alleles to flowering time adaptation, we subdivided the set of loci into those present in all populations (MAF > 0.1 in all populations; n = 14), and those that were absent or at low frequency in at least one subpopulation (MAF < 0.1; n = 19). We then modelled the flowering times in the 8 subpopulations in two additional ways. First by the polygenetic effects captured by the IBS kinship only and then using the estimated additive effects of the global alleles plus the polygenetic effects captured by the IBS kinship. The modelled flowering times from these analyses were then compared to the flowering times modelled by the effects of all 33 loci and those measured experimentally (Figure 3). The kinships capture the overall early to late flowering time pattern for subpopulations well (x days) and adding the global alleles improves the modelling further (y days). This illustrates that the polygenetic effect, and the gradual allele-frequency shifts across the loci with global alleles, make important contributions to the overall pattern of differentiation between the populations. This illustrates the importance of polygenic adaptation in flowering time adaptation in the world wide A. thaliana population. It is noted that the majority of the global alleles have moderate to small effects on flowering time (Figure 3A), relative to the local alleles, but together they contribute 17.4% of the phenotypic variance of the trait.

A). Experimentally measured and modelled flowering times in the 8 genetically defined subpopulations of the 1,001-genomes collection of accessions. The height of the bar represents the experimentally measured mean flowering times at 10°C in the green house for the population. Modelling of the kinship (purple) and effects of globally segregating alleles (grey) captures the overall pattern of early to late flowering times between the sub populations well. Modelling also the local alleles (blue) captures more of the extreme adaptations in some subpopulations, in particular in Spain and Sweden. The unexplained differences in flowering times (tomato) are small. B). Illustration of the dependence of the variance contributed by the individual loci on the allele frequency and effect size. The y-axis gives the minor allele frequency and the x-axis the estimated effect on flowering time in days. The size of each dot is proportional to the amount of phenotypic variance explained by the locus. The colour of the dot indicates whether the minor allele has a global (tomato) or local (blue) distribution in the sub populations.
Contribution by local alleles to subpopulation differentiation
We next explored the loci with alleles that are rare (MAF < 0.1) in at least one of the populations in more detail (Figure 4). Across these loci, the allele frequency spectrums for the late flowering Swedish accessions were more similar (compare with Figure 2B). Few of the local alleles are fixed (or nearly fixed) in the subpopulations, meaning that late flowering alleles are also present in early flowering subpopulations, albeit generally at lower frequencies (Figure 4). One or both Swedish populations do, however, contain some near private late flowering alleles at high frequencies. These include the strongest late-flowering allele of all (locus on chromosome 5:23 Mb; Figure 4), suggesting that this large-effect, novel allele has arisen locally and been strongly selected here. A few other loci with relatively large effects on flowering were also predominantly present in one or a few subpopulations (Figure 3B, Figure 4, Figure S4). When predicting the flowering times in the subpopulations using this set of loci, their primary contribution appears to be to facilitate more extreme adaptations of particular subpopulations than the global alleles (Figure 3A). In contrast to the global alleles, there is not only generally larger allele-frequency differences between the populations for the local alleles, this group is also enriched for alleles with large effects (Figure 3B). They also individually explain larger proportions of the phenotypic variance (Figure 3B), and together contribute 38% of the phenotypic variance in the population. Together, these results suggest that flowering-time adaptation of the subpopulations results from shifts in the allele frequencies of global alleles (Figure 2B), and that more extreme (for example northern Sweden) or variable (for example Spain) local adaptations are provided by private, or near private, local alleles (Figure 3).

The allele frequency spectrum across loci with alleles that are rare (MAF <0.1) in at least one of the genetically defined subpopulations. Green/Red indicates high allele frequency for early/late flowering alleles, respectively. The populations are clustered based on the overall similarity of the allele frequency pattern (left to right) and the loci based on the similarity of the allele frequencies in the subpopulations (top to bottom). X:YYYYY-ZZZ represent a locus as chromosome:position:type, where position is in bp. “QTL”/locus-id are used to indicate loci detected by a direct association to FT10 (GWAS) or the differential expression of the particular locus.
Long-range LD between adaptive loci
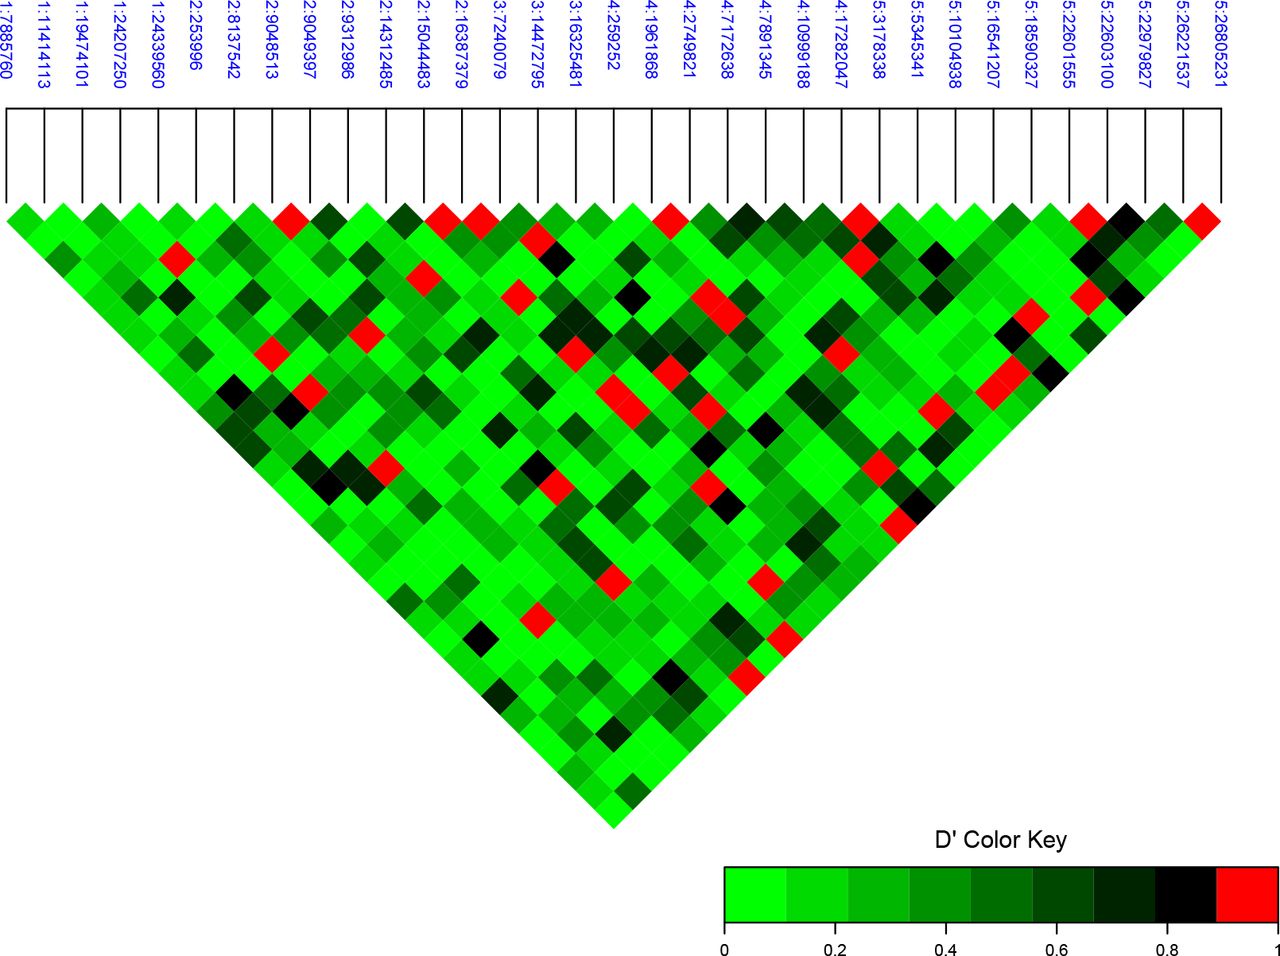
The pairwise LD (D’) between the 33 associated loci is illustrated in Figure 5. In total, 33 pairs have a significant long range LD (see Materials and Methods) and some loci have it with several other loci on either the same or different chromosomes (Figure 5).
Pairwise linkage disequilibrium (LD) between the 33 flowering time associated loci across the genome (D’). Values above the 0.99 quantile of a simulated null distribution are highlighted as red. The loci are labelled as chromosome:position on chromosome in bp.
We explored four groups of genes defined by the four loci that were in long-range LD with more than three other loci in more detail. A literature review suggested functional connections between candidate genes in three of these four clusters. One group contained several genes in a miRNA mediated flowering time regulation pathway that suggesting a functional connection to the FLC-CO/FT module (Liang et al., 2014; Golembeski and Imaizumi, 2015; Hewezi et al., 2012; Lee et al., 2010; Teotia and Tang, 2015; Wang, 2014). Another cluster contained genes in the photoperiod pathway (Hall, 2003; Kim et al., 2008; Zhang et al., 2015) and the third cluster genes connected to FRI/FLC flowering time regulation (Choi et al., 2011; Martin-Trillo, 2006) (Table 1). The minor alleles of the four loci that defined these groups via the long-range LD to the other alleles were enriched in specific geographic regions. One allele on chromosome 2 (15,044,483bp) was found primarily in Sweden, the other on chromosome 2 (9,048,513bp) in northern Sweden and the one on chromosome 3 (7,240,079bp) in Asia (Figure 2B). Together this suggests an importance of these pathways for local adaptation in these geographic regions.
Four groups of genes were identified by their long-range LD to a common SNP (top, italic in each cluster) among the SNPs in the final model from the multi-locus association analysis to flowering time at 10°C.
DISCUSSION
We have analysed the polygenetic basis of flowering time variation in the latest public release of data from the 1,001 genomes A. thaliana project (Alonso-Blanco et al., 2016). The focus is on 33 loci associated with flowering time at 10°C in an earlier study of the same dataset (Zan and Carlborg, 2017) that together explain 66% of the additive genetic variation of this trait. Polygenic adaptation is difficult to detect in natural populations due to, for example, the small contributions by individual loci to trait variation and confounding of adaptive alleles with population structure. A likely consequence of this is that standard genome-wide association mapping approaches have only been able to reveal a small number of flowering time loci in this population (Alonso-Blanco et al., 2016; Atwell et al., 2010; Shindo et al., 2005). We have earlier shown that the use of a more sensitive, false discovery rate based polygenic mapping approach could reveal many more adaptive loci in this population (Zan and Carlborg, 2017). These loci were inferred using a 15% false discovery rate, meaning that a few of the 33 loci are likely false positives. However, by focusing on the overall contributions by this set of loci to adaptation, rather contributions by individual ones, new general insights can be gained to the processes involved in flowering time adaptation in the world wide A. thaliana population.
For many of the flowering time associated loci in this dataset, both reference and alternative alleles were present in all subpopulations of the worldwide population, albeit at different frequencies. Together these contributed to the overall pattern of early to late flowering in the geographically divided subpopulations. Polygenic global adaptation via small allele frequency shifts across many loci thus appears to have contributed to the adaptation of this trait in A. thaliana.
For a number of the associated loci, one of the alleles was absent or rare (MAF < 0.1) in one or more of the subpopulations. Several of these local alleles had strong effects on flowering time, and these loci explain the more extreme flowering time adaptations of individual subpopulations than could be done by the global alleles. Alleles with large effects on adaptive traits have also earlier reported to be present in local populations of Arabidopsis thaliana (Shen et al., 2014; Shindo et al., 2005; Barboza et al., 2013; Rus et al., 2006). The finding that many such alleles are present in locally in the world wide population, confirms earlier speculations that locally adaptive alleles for flowering time variation in Arabidopsis thaliana are likely to have large effects (Salomé et al., 2011). That local populations appear to reach their respective fitness optimums via the effects of alleles that are primarily present in some populations suggests that different combinations of alleles are recruited for adaptation to different local environments.
A potential explanation for the observation that flowering time adaptation in A. thaliana appears to result from global polygenic adaptation combined with strong alleles driving specific local adaptations is that the plant is naturally restricted to its native range over their lifespan and that self-pollination in Arabidopsis thaliana slows down the long distance spreading of new genetic variants. Hence, newly emerged alleles with large beneficial adaptive effects can quickly sweep to high frequency in local populations, but long distance spreading of those alleles will take longer in this selfing plant, although it does happen due to human or animal activities (Tilman and Lehman, 1987). An example that is a likely consequence of human or animals is the large-effect allele in the locus on chromosome 5, 23 Mb. Here, the strong allele is present at high frequency in northern Sweden and in a relict population in Spain (Figure S4F). These populations are geographically far from each other, and this spread is then likely to result from potential lineage mixing between relict and northern populations as inferred in an earlier study of this dataset (Alonso-Blanco et al., 2016).
Two late-flowering alleles, with intermediate to high effect, are private (or nearly so) to the Spanish population (Figure 4). We note that this population has a significantly higher within population variation in flowering time (P = 1.1 × 10⁻⁶; Brown-Forsythe test) than the other populations (Figure 2A). The reason for this is not known, but a possible explanation could be that these strong alleles have contributed to specific local adaptations in this subpopulation. Further studies of these effects would be valuable to evaluate the possible contributions of these alleles to local adaptations.
Four of the associated loci displayed a long-range linkage-disequilibrium (LD) to several other associated loci. These alleles were enriched in relatively distinct areas, suggesting that they have emerged and spread locally. The observed long-range LD might thus be a result of a confounding with population structure, but as they were detected in a statistical multi-locus analysis accounting for population-structure, we consider this unlikely as they capture variation that could not be explained by the other loci. The observation that in three of the four cases the loci involve candidate genes in related biological pathways instead suggests the LD could result from co-selection of multiple functionally connected loci. Further work is, however, needed to confirm this hypothesis that, in several cases, parallel evolution of alleles in multiple loci of the same biological pathway has been a key mechanism for local adaptation.
In conclusion, our study finds that the variation in flowering times between the studied A. thaliana subpopulations is due to a combination of allele frequency shifts across many loci where both alleles are present across the entire range of the species, i.e. polygenic adaptation, and local adaptation due to a smaller number of genes of which some have relatively large effects. The results also suggest that local adaptation might be driven by parallel evolution of multiple polymorphisms in different biological pathways. Overall, this provides new insights to how this self-pollinating plant has been able to colonize such a wide range of ecological habitats around the world
MATERIALS AND METHODS
Data
All phenotype and subpopulation information are publicly available as part of the Arabidopsis thaliana 1,001-genomes project (Alonso-Blanco et al., 2016; Kawakatsu et al., 2016). Flowering times measured at 10°C and 16°C in the green house were downloaded from (Consortium, 2016a; Consortium, 2016b). The subpopulation classifications of the accessions was downloaded from http://1001genomes.org/tables/1001genomes-accessions.html. The imputed whole genome SNP data matrix was downloaded from http://1001genomes.org/data/GMIMPI/releases/v3.1/SNP_matrix_imputed_hdf5/1001_SNP_MATRIX.tar.gz. We filtered for minor allele frequency and only retained loci with MAF > 0.03. SNP markers were pruned to remove loci in pairwise LD of r2 > 0.99. In total, 1,396,438 SNPs on 1,004 individuals remained. The 33 loci associated with flowering time at 10°C were identified in a previous study (Zan and Carlborg, 2017).
Clustering of subpopulations based on the allele frequencies of flowering time associated loci
Euclidean distances between the 8 subpopulations in the 1,001-genomes dataset defined by (Alonso-Blanco et al., 2016) were calculated using the dist function in R based on the allele frequencies at the loci associated with flowering time at 10°C in this dataset. The subpopulations were then clustered using the hierarchical clustering function hclust in R.
>Modelling of the flowering time from the effects of global and local alleles
We fitted a mixed model
 to the 1,004 individual flowering time measurements using hglm function in hglm R-package (Rönnegård et al., 2010). Here, y̅ is the mean flowering time for an individual accession and ZZT = G, where G is the genomic kinship matrix estimated from the whole genome marker set using the ibs function in the GenABEL R-package (Aulchenko et al., 2007). The fitted value from model (1) was used as the modelled flowering time for each accession. Contributions from the local alleles were estimated by X1β1 where X1 is the genotype matrix of the local alleles and β1 is the corresponding estimated effects from model (1). Contributions from the global alleles plus kinship were then estimated by subtracting X1β1 from the fitted value. Then, estimates for each subpopulation were obtained by averaging the individual estimates obtained for each accession.
Testing for significant long-range Linkage Disequilibrium
An empirical significance threshold was derived to test for significant long-range LD between the loci associated with flowering time at 10°C. An empirical null distribution was obtained via 1,000 simulations, where in each the same number loci as detected in the association analysis were simulated with allele frequencies being the same as those of the associated loci.
In each simulated dataset, all pairwise LD (D’) values were calculated and saved to generate a null distribution for the significance test. We used the 0.99 quantile (corresponding to a D’ value of 0.96) as cut-off in our analyses.
Visualization of the analysis results
Figures 2 and 4 were created using the heatmap.2 function in gplots package in R (Warnes et al., 2015). Figure 5 was created using LDheatmap function in the LDheatmap package in R (Shin et al., 2006). Figure S3 was made using R package maptools (Lewin-Koh and Bivand, 2011). All other figures were created using custom R-scripts (R Core Team, 2015).
AUTHOR CONTRIBUTIONS
ÖC and YZ initiated the study, designed the project and the statistical analyses; YZ wrote the analysis scripts and performed the data analyses. ÖC and YZ summarized the results and wrote the manuscript.
DISCLOSURE DECLARATION
The authors declare no competing interest.
SUPPLEMENTARY MATERIAL
Supplementary figure S1-S4 are provided in the file Supplementary_data.pdf
ACKNOWLEDGEMENTS
This work was supported by the Swedish Research Council for Environment, Agricultural Sciences and Spatial Planning (Formas grant ID 2013-450 to ÖC).
REFERENCES


