

Abstract
Background Along with specialized functions, cells of multicellular organisms also perform essential functions common to most if not all cells. Whether diverse cells do this by using the same set of genes, interacting in a fixed coordinated fashion to execute essential functions, remains a central question in biology. Single-cell RNA-sequencing (scRNA-seq) measures gene expression of individual cells, enabling researchers to discover gene expression patterns that contribute to the diversity of cell functions. Current analyses focus primarily on identifying differentially expressed genes across cells. However, patterns of co-expression between genes are probably more indicative of biological processes than are the expression of individual genes. Using single cell transcriptome data from the fly brain, here we focus on gene co-expression to search for a core cellular network.
Results In this study, we constructed cell type-specific gene co-expression networks using single cell transcriptome data of brains from the fruit fly, Drosophila melanogaster. We detected a set of highly coordinated genes preserved across cell types in fly brains and defined this set as the core cellular network. This core is very small compared with cell type-specific gene co-expression networks and shows dense connectivity. Modules within this core are enriched for basic cellular functions, such as translation and ATP metabolic processes, and gene members of these modules have distinct evolutionary signatures.
Conclusions Overall, we demonstrated that a core cellular network exists in diverse cell types of fly brains and this core exhibits unique topological, structural, functional and evolutionary properties.
Background
Life on Earth has gone through many transitions in organizational complexity (Smith and Szathmary 1997). Among these, the evolution of multicellularity stands out as a key milestone. This transition has occurred independently multiple times across the tree of life and paved the way for tremendous phenotypic expansion and biological diversification (Parfrey and Lahr 2013). Although this has led to the evolution of cell-type-specific regulatory pathways that define cells with vastly different functions, all cells in multicellular organisms also carry out common functions that are essential for cell survival. Whether these common functions are supported by a common core of genes functioning in all cells, coordinated to ensure survival in the face of diverse functional demands, remains a central question in biology (Lim, Lee, and Tang 2013; Hart and Alon 2013). In particular, do all cells utilize the same set of genes to accomplish common functions, and do these genes function in a fixed and coordinated fashion—a core regulatory network?
Cellular phenomena can be characterized by different levels of biological organization, or - omes, such as the genome, epigenome, transcriptome, proteome, etc. Investigating core functions from these different levels not only gives insight into essential functions of cellular life, but also helps to reveal the evolutionary forces acting at different levels of biological organization (Sorrells and Johnson 2015; Ghadie, Coulombe-Huntington, and Xia 2018; Wagner 2012). To identify core functions at each level, researchers have used various strategies such as identifying constitutively active genes over temporal or spatial scales, and across environments. These genes are typically referred to as ‘housekeeping genes’ and are thought to perform essential functions. They tend to share aspects of sequence structure, chromatin environment and evolutionary history (Eisenberg and Levanon 2013; Rancati et al. 2018). For example, housekeeping genes are evolutionarily ancient (Zhu et al. 2008), exhibit a high level of evolutionary conservation (Zhang and Li 2004), and are enriched for several functions, including metabolism, RNA binding, protein degradation and cytoskeleton functions (Zhang and Li 2004; Lehner and Fraser 2004).
While core functions are often described based on ‘housekeeping genes’, we recognize that genes do not work in isolation, but work with each other to carry out biological processes. Individual molecular abundances alone cannot adequately capture biological organizations. High-throughput methods that generate high-dimensional ‘omic’ data have greatly increased our understanding of molecular and cellular function and organization, in particular through the analysis of molecular networks (Barabasi and Oltvai 2004; Proulx, Promislow, and Phillips 2005; Thompson, Regev, and Roy 2015; Promislow 2005). Studying core functions from a network perspective may provide novel insights into biological organization. Networks consist of nodes connected to one another by edges. In the search for the underlying molecular structure of cells, researchers have explored many different kinds of edges, including but not limited to gene co-expression, protein-protein interactions (PPI), interactions among transcription factors (TF), TF chromatin occupancy, miRNA-target gene interactions, metabolites covariation, and metabolic reactions (Mitra et al. 2013). For example, co-expression network analysis of human and Arabidopsis bulk transcriptome data has found a substantial number of gene pairs whose co-expression spans multiple datasets (Lee et al. 2004; He and Maslov 2016). In both analyses, gene pairs expressed across samples were enriched in translation, DNA replication, and regulation of transcription functions, all generally considered to be core cellular functions. Recent studies of tissue-level transcriptome data have typically focused on tissue-specific networks (Greene et al. 2015; Sonawane et al. 2017). For example, Skinnider et al. (2021) constructed tissue-specific PPI networks using co-immunoprecipitation within each of seven mouse tissues. They discovered core cellular modules, present in all mouse tissues, composed of evolutionarily ancient proteins, which contrasts with evolutionarily novel accessory modules that are found within individual tissues.
A major drawback of most previous studies is that the networks were inferred from bulk data, which profiles heterogeneous cell populations of an organism or in a tissue. Bulk samples face two main limitations for network construction. First, differences in cellular compositions between samples may confound covariation analysis (Farahbod and Pavlidis 2020). Second, measurements that are averaged over thousands of cells in bulk samples make it difficult to detect interactions between genes in individual cells, such as the presence of co-expression patterns and the cell-specificity of these interactions. Co-expression in particular is an indicator of functional relationships (Hughes et al. 2000), which from a network perspective can provide valuable insight into cell function (Barabasi and Oltvai 2004). The compendium of core housekeeping genes, initially characterized based on the consistency of their expression, may change based on further analyses of gene-gene relationships. For example, does each commonly expressed gene interact with other genes in a fixed and static manner in all cell types, or do the interactions themselves, which define the gene network structure, differ depending on the local cellular contexts? We can gain a clearer understanding of core gene regulatory networks through the analysis of single-cell sequencing data from a network perspective.
With the advent of single-cell RNA sequencing (scRNA-seq), we have an unprecedented opportunity to reveal gene relationships in specific cellular contexts and probe cellular-level networks (Trapnell 2015; Tanay and Regev 2017). One recent study used single cell data from mouse brain samples to construct gene co-expression networks and compared the topology of networks built from different cell type hierarchy levels (i.e., from broad to specific class, subclass, and cluster labels of cell types; Harris et al. 2021). Their results show a high preservation of gene-gene relationships at each hierarchy level and suggest the existence of a core co-regulatory network in the brain. However, they did not directly compare cellular networks across cell types to find commonality or describe a concrete core network with topological and functional features.
Taking together, the prior findings, and the considerable amount of scRNA-seq data now available, lead us to ask several fundamental questions: Can we identify shared co-expression patterns between pairs of genes across different cell types, how common are these specific connections across different cell types, do these shared co-expressed genes define a core cellular network, and if so, what properties does this core network manifest?
To investigate these questions, we used a published scRNA-seq dataset derived from whole fly brains (Davie et al. 2018) and constructed cell type-specific gene co-expression networks. Furthermore, we described the functional enrichment of this network, and the evolutionary age of its constituent genes. Gaining such information not only allows us to understand the composition and function of the detected core network, but also provides insight into the molecular organization of gene co-expression networks and the evolutionary origins of cellular functions. To our knowledge, this is the first study searching for a core cellular network among cell types using single cell data in the fly brain.
Results
Construction of cell type-specific gene co-expression networks
We selected an array of fly brain cell types and filtered expressed genes before network construction. The original dataset contained 17,473 gene expression profiles in 56,902 high-quality brain cells grouped into 116 cell clusters. We selected 33 known cell types that contained at least 200 cells and filtered expressed genes in each cell type separately (Methods and Figure S1). Different cell types showed different numbers of expressed genes, ranging from a minimum of 3,153 expressed genes in the Tm9 cell type, to a maximum of 6,725 expressed genes in the ensheathing glia cell type (Figure 1). In total, there were 8,013 genes expressed in at least one cell type, 2,368 of which were expressed in all 33 cell types (Figure 1). Throughout, we focus on these 2,368 commonly expressed genes to identify covarying gene pairs within and across cell types. We used the bigScale2 algorithm (Iacono, Massoni-Badosa, and Heyn 2019) to identify the top 1% of highly correlated gene pairs within each cell type, which we then used to build cell type-specific networks (Figure S2 and S3, Table S1). Among these 2,368 genes, we identified 600,888 co-expressed gene pairs (21.4% of all possible pairs) that occurred in at least one of the 33 cell type-specific networks.

The number of expressed genes for each brain cell type (left) and the number of cell types one gene was detected as expressed (right). The dotted vertical line on the left panel indicates the 2,368 commonly expressed genes.
Co-expression networks in fly brain cell types are highly context-dependent
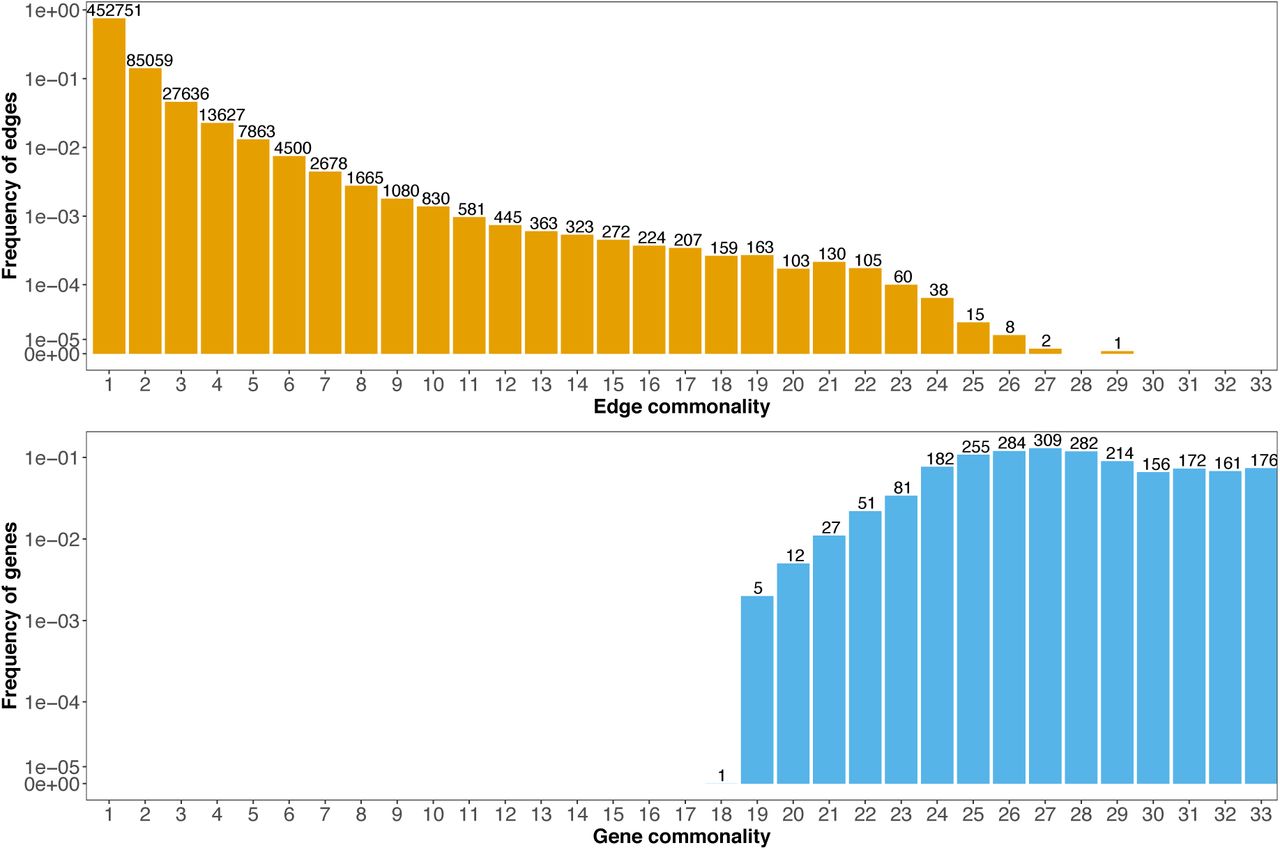
A network is made up of nodes connected by edges. Here, each node is a gene, and an edge between two nodes exists if the genes are significantly correlated with each other across cells within a specific cell type. If a core cellular network exists, we expect edges comprising this core to be present in all cell types. We define the number of cell types in which each edge (i.e., each co-expressed gene pair) is detected as that edge’s ‘commonality’. The distribution of commonality scores exhibited a monotonic decline over most of the range, with more than 75% of the edges specific to one cell type and only 0.5% of edges common to more than 10 cell types (Figure 2). The largest observed commonality score was 29, and was observed for only one edge. The frequency of edge commonality initially decreased rapidly. However, this trend attenuated at approximately an edge commonality of 10. The frequency of commonality stayed at a roughly constant level until 22, before it finally dropped to 0 above 29 (Figure 2). That is, among the 33 cell types we examined, no gene pairs were co-expressed in 30 or more cell types.

The commonality of an edge indicates the number of cell types one edge was detected (top). The commonality of a gene refers to the number of cell types one gene was detected as co-expressed with at least one another gene (bottom). The y-axis shows the frequency of genes or edges in the corresponding commonality score group, the numbers on top of each bar shows the counted number of genes or edges.
As a complement to the observed edge commonality distribution, we also plotted the gene commonality distribution, where gene commonality indicates the number of cell types in which a given gene was found to be significantly co-expressed with at least one other gene (i.e., to have at least one edge). The gene commonality distribution showed that most genes had one or more edges in the majority of cell types, and 176 genes had at least one edge in all 33 cell types (Figure 2). Thus, commonly expressed genes are frequently utilized and wired into co-expression circuits, though the specific wiring varies among different cell types.
Recurrently co-expressed genes in multiple cell types
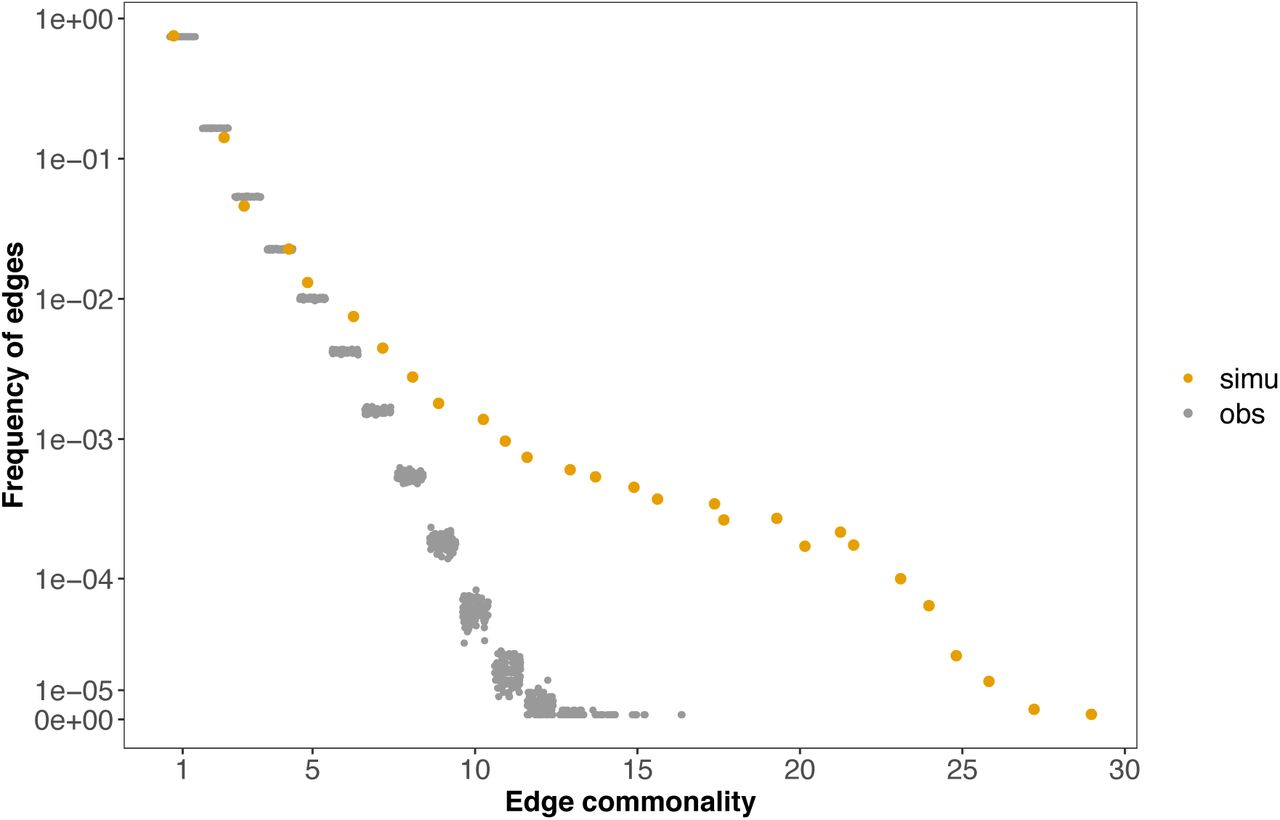
We next asked to what extent the observed decline in edge commonality distribution with increasing cell types (Figure 2) differed from the null expectation. The null hypothesis provides the expected distribution of edge commonality when genes in each cell type are randomly co-expressed with each other, and we evaluate this in two ways. First, we derived a mathematical expectation for the probabilities of edge commonality using the binomial distribution (Methods). For a gene pair to be co-expressed in 0, 1 or 2 cell types, the probability values were 0.7177, 0.2392 or 0.0387, respectively, indicating most gene pairs would be expected to co-express in no cells, or only in one or two cell types. Given the 2,368 commonly expressed genes, we would expect to find 791,068 unique gene pairs to occur (Methods). Our observation of only 600,888 such gene pairs suggests that some genes recurrently co-express in multiple cell types. A full comparison of this analytically predicted distribution and the observed edge commonality showed that the two distributions agreed well at lower, more cell-specific commonality, but the discrepancy became obvious for gene pairs found in >3 cell types (Figure S4). Second, we compared the deviation between the observed edge commonality distribution and a null distribution using network randomization (Methods). This comparison showed that the observed distribution was enriched in high commonality edges. For instance, none of the randomizations generated an edge commonality larger than 15, while the observed distribution included hundreds of edges with commonality ≥15 (Figure 3). This pattern is robust to the percentile cutoff values used in network construction. When we applied a more stringent percentile cutoff and compared the observed with null distributions, the discrepancy became even more prominent, shown as the increasing distance between the two distributions measured using the Jensen–Shannon divergence (Figure S5). These results suggest that there exists a set of co-varying genes that occur more repeatedly than expected by chance across diverse cellular contexts.

The yellow dots show the observed edge commonality distribution and the grey dots the null distribution from network randomization. Network randomization was performed 100 times for each cell type individually with network size (number of nodes and edges) and gene degree (number of co-expressed gene partners per gene) fixed.
In sum, despite the very large number of cell type-specific gene co-expression edges, our analysis points to a core cellular network composed of genes that are co-expressed irrespective of cellular contexts.
Topology pinpoints a core cellular network
By definition, co-expressed genes with high commonality are more likely to contribute to a core cellular network. Although we searched for a core network shared by all cells, we did not observe any edges shared by all cell types. This discrepancy may be due to the percentile cutoff that we used in network construction. Indeed, networks based on a less stringent cutoff value of the top 10% of expressed genes contained edges common to all cell types, and the enrichment of high commonality edges remained (Figure S5). Less stringent cutoffs come with a higher risk of false positive co-expression edges, as indicated by the presence of high-commonality edges in the randomized networks at low stringency (Figure S5). Therefore, we continued our analysis with only the top 1% of edges, and leveraged other information to identify co-expressed genes that might reside in a core cellular network.
Previous network studies suggest that shared edges tend to be tightly connected with each other (Huttlin et al. 2021). We first evaluated the neighborhood density of high commonality edges and then measured the clustering coefficients of networks at different edge commonality cutoffs to determine an informative commonality cutoff value. We combined all cell type-specific networks into a pan-network whose edge weights reflected edge commonality and explored the relationship between edge commonality and edge clustering coefficient (Methods). To aid in comparison, we subsampled 10,000 edges for edge groups that contained >10,000 edges to make them more comparable to edge groups with <10,000 edges. The result showed that edge commonality and edge clustering coefficient were positively correlated (Figure 4A), supporting the idea that recurrently co-expressed genes tend to reside in dense subnetwork neighborhoods.

A. Edge commonality was plotted against edge clustering coefficient. Edge commonality measures the number of cell types one edge was detected. Edge clustering coefficient shows one edge’s neighborhood edge density.
B. The clustering coefficient values of the subgraphs (y-axis) change with increasing edge commonality cutoff values (x-axis). Progressive increasing edge commonality cutoff values were applied to the pan-network and edges whose commonality were equal or larger than the cutoff value were retained, the clustering coefficient of each resulting subgraph was calculated.
C. The edges composing a core cellular network at edge commonality cutoff 14 were highlighted in red.
Next, we progressively extracted edges with increasing commonality cutoffs and calculated each resulting subnetwork’s clustering coefficient. The result showed that with cutoff values of increasing stringency, the clustering coefficient increased to a peak of 0.75 at a cutoff value of 14, declining thereafter (Figure 4B). Based on this result, we chose a commonality of 14 as the minimum value for including an edge in a core cellular network, which gave 1810 non-redundant edges among 179 genes (Figure 4C).
To evaluate the connectivity of the core network, we calculated its clustering coefficient and compared it to an ensemble of coefficients from pseudo core networks each with the same number of genes, edges, and degree distribution as the observed one. The mean simulated clustering coefficient value was 0.15, with a range of 0.12 to 0.18, much smaller than the observed value 0.75 (Figure S6).
We noticed that edges in the defined core network were not present in every surveyed cell type. This could be due to our parameter value choices, such as correlation percentile cutoff or edge commonality cutoff, or alternatively, these edges or gene pairs are not co-expressed in all cell types. To examine these possibilities in detail, we looked at the rank of these edges’ correlation among the distribution of edge correlation values in cell types in which they were below the top 1%. In particular, did they show consistently high ranked correlations across these remaining cell types? To quantify patterns over cell types, we used a rank aggregation method and estimated a P value per edge (Method). The estimated P value ranges from 0 to 1 and serves as an upper bound of the computationally expensive exact P value, with a small value indicating one edge is ranked consistently higher across cell types and a larger value meaning one edge’s rank distribution over cell types follows a random pattern. Due to computational limitations, we randomly sampled 100 edges in 10 edge commonality groups separately and computed their respective P values (Figure S7). More than 94 percent of edges sampled from the core network (edge commonality ≥14) are highly ranked in the remaining cell types (P < 0.05), whereas none of the 100 cell type-specific edges (edge commonality=1) that were tested were significant (P > 0.05 in all cases), suggesting that although these core edges did not make to the top 1% correlations in a set of cell types, they are relatively highly co-expressed across the remaining cell types.
Structure, function and evolutionary signatures of the core cellular network
Having defined a core cellular network, we next examined its structure, functional enrichment and evolutionary signature. Many complex networks can be divided into modules, where genes are more highly interconnected within modules than between modules (Newman 2003). Modules identified from gene co-expression networks tend to take part in the same biological processes or pathways (Ruprecht, Proost, et al. 2017; Wolfe, Kohane, and Butte 2005). To explore the structural and functional organization of this core, we decomposed it into highly connected modules using the Markov Clustering Algorithm (Methods). In total, we identified seven modules with at least five gene members (Figure 5 and Table S2). We then annotated each module’s biological function through Gene Ontology (GO) enrichment analysis. The results revealed an array of ‘housekeeping’ and brain related functions enriched within different modules (Figure 5 and Table S3). The largest module (module 7) contained 78 genes, and was enriched for ribosome related functions, such as cytoplasmic translation, suggesting tight correlation of genes encoding ribosomal proteins across cells. The second largest module (module 6), contained 15 genes and was enriched for glycolysis, a process central to cellular energy homeostasis. Modules 1 and 2 appeared to facilitate ATP metabolic process and proton transport, and module 3 was related to synaptic signaling, perhaps reflecting neuronal functions. Module 5 formed a fully interconnected subnetwork without any edges from outside, and its gene members were heat-shock proteins (HSP) or co-chaperones, key players in protein folding. The smallest of the modules, module 4, showed enrichment in the rhodopsin biosynthetic process.

A. The heatmap of gene co-expression relationships and decomposed modules in the core cellular network. Modules which have at least 5 gene members are highlighted in different colors and numerically indexed. Gene symbols are shown on the right side of the matrix with colors matched to the corresponding module.
B. Network visualization of the core modules.
C. Enriched GO terms for each core module. We used the R package ‘clusterProfiler’ to perform gene set enrichment analysis of Gene Ontology with a Bonferroni correction and an adjusted P value cutoff of 0.05. In each module, the top terms are shown (up to 6). A full list of enriched GO terms for each module is provided in Table S3.
To characterize the evolutionary signature of each module, we used phylostratigraphy, assigning each gene in each module to one of 10 different evolutionary time periods (Table S4). Broadly speaking, genes involved in the core network were enriched for genes with ancient origins, compared with genes commonly expressed in the fly brain (Figure 6A). Looking in detail, different modules had different gene age compositions (Figure 6B). Gene members of the ribosomal (module 7) and protein folding (module 5) modules predated the divergence of the eukaryota, while those of the ATP metabolic (module 1 and 2), glycolysis (module 6) and synaptic signaling (module 3) modules included genes distributed across both ancient and relatively recent evolutionary time periods. Module 4 showed the youngest age signature, with all gene members emerging after eumetazoa. These diverse age signatures of different core modules suggest that they arose by integration of both young and old genes, perhaps involving step-wise recruitment of young genes into ancestral core modules.
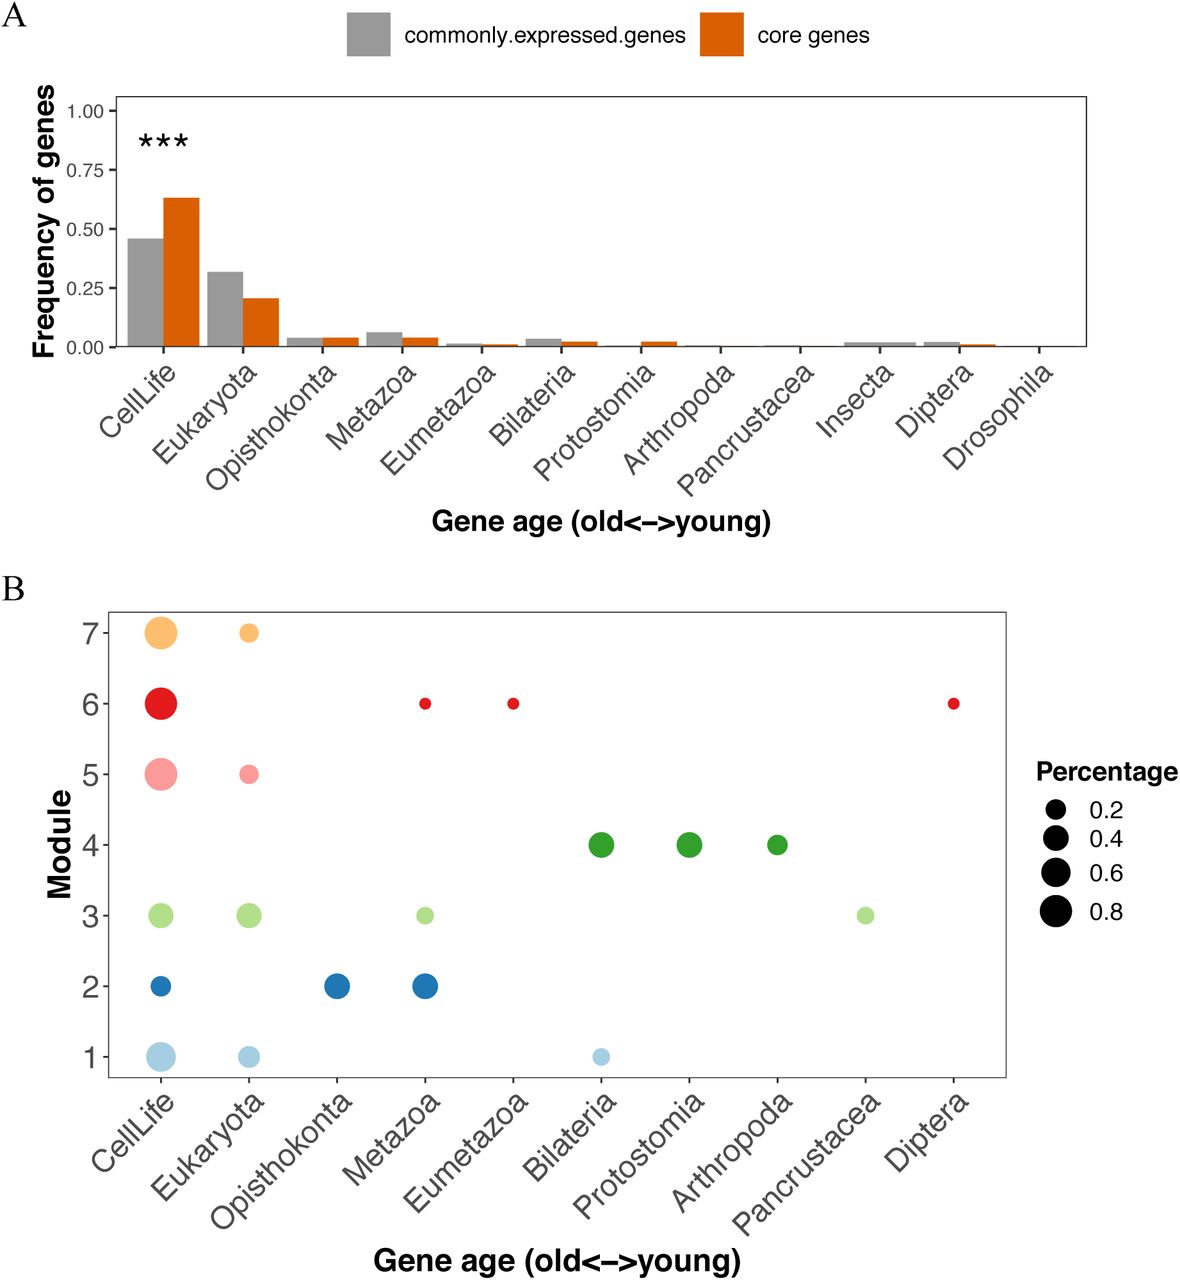
A. We assigned fly genes into different evolutionary age groups in a phylostratigraphy framework. The number of genes in each evolutionary age group were compared between commonly expressed genes and genes constituting the core using a one-sided fisher exact test. Multiple-testing was adjusted using the p.adjust function in R with the Benjamini & Hochberg method. ***, p.adjust < 0.001.
B. The age distribution of gene members of each core module. The size of each circle represents the proportion of genes in that evolutionary age group in the corresponding module.
Discussion
To what extent do all cells in an organism rely on a common core of interacting genes? To investigate this question, we examined cell type-specific gene co-expression networks using fly brain scRNA-seq data. We described a core gene co-expression network and found it to be small and more densely connected relative to the larger, more cell-specific gene co-expression networks. The core is composed of numerous co-expression modules that appear distinct from each other in terms of functional enrichment and the distribution of gene age.
Our study is distinct in at least three ways from previous work interrogating core networks. First, a large body of studies has relied heavily on protein interactions to derive biological networks and find commonalities. While these studies are informative, they suffer from the bias that protein interaction data are enriched for highly-studied proteins, which may lead to an incomplete picture of network structure (Skinnider, Stacey, and Foster 2018; Gillis, Ballouz, and Pavlidis 2014; Schaefer, Serrano, and Andrade-Navarro 2015). Moreover, these studies are typically lacking information on the cell specificity of such interactions. In our study, we analyzed transcriptome data, which interrogate almost all genes in the genome and are less biased with respect to knowledge from prior databases or existing literature.
Second, instead of relying on expression levels of individual genes to identify genes common across cell types, we examined covariation between genes as the measure of functional commonality, which provides not only a stricter criterion to infer gene function (Hughes et al. 2000), but also likely captures conserved gene regulatory networks (Yu et al. 2003; Stuart et al. 2003; Segal et al. 2003).
Third, we identified covarying gene pairs using scRNA-seq data, which unlike bulk tissue data, can be defined by cell type, even within a single biological sample. In contrast to bulk transcriptomic analysis and PPI data, where the cellular specificity of each interaction is largely ambiguous, scRNA-seq enabled us to build cell type-specific networks at a resolution that has hitherto not been possible.
Is there a core network active in all cells?
To determine whether there is a core network common to all cells at the level of single-cell gene-gene covariation, we focused our analysis on genes that were expressed across all cell types, which allowed us to directly compare the diverse co-expression patterns among a common set of genes. We limit the question to the fly brain, acknowledging that the core modules we identify might be absent in non-brain cells. Even among the genes expressed in all cell types, we found that the co-expression of most genes was cell type-specific, and yet there also existed a significantly large number of genes whose co-expression occurred among multiple cell types. This enrichment of shared co-expressed genes suggests the existence of a core co-expression network across diverse cell types. We applied a relatively high statistical significance threshold to extract shared co-expressed genes, which we defined as the core network.
While we identified edges common to many cell types, our inferred core cellular network lacks edges shared by all cell types. We consider two alternative explanations for this observation. First, it is possible that a common core co-expression network for all brain cells does not exist, and that cell co-expression networks are so diverse as to lack such rigid network structure across the cells of the Drosophila brain. Alternatively, we considered the possibility that a core does exist, but that the statistical inference of gene co-expression and the threshold value we use to build the network might not fully resolve the core in all cells. To define the core, we specify multiple parameters, including a gene correlation metric, a correlation threshold to select co-expressed genes, and an edge commonality cutoff to extract a core network. Given that our definition of gene interactions is based on statistical inference of correlations, we might simply fail to observe a real interaction in one or more cell types due to type II error (false negatives). As we explored this parameter space, moving from relaxed to stringent parameter values, a few features of the network became apparent. In particular, more relaxed parameter values revealed co-expressed gene pairs observed in all cell types in the brain, but this inherently increased the risk of false positive gene pairs (type I error), as revealed by network permutation. In an effort to reduce the risk of false positives, we examined a more conservative parameter space, which still yielded many edges shared widely across cell types, but did not identify edges shared by all cells. We looked in detail at those edges that were in our defined core cellular network, with edges present in ≥14 cell types, and yet were absent from the top 1% of most significantly correlated gene pairs in the remaining cell types. We found that almost all of these edges were in fact ranked among the most highly co-expressed, but below the initial threshold, in the remaining cell types. Thus, their absence from the core appeared to be due to their relatively weak co-expression strengths compared to the cell type-specific gene pairs. Together, our analysis indicates the existence of a core cellular network, though the size and composition that we define is conditional on parameter choices.
Topological properties of the core network
With our current parameter choices, the defined core network is remarkably small when compared to the much larger network of cell-specific interactions. In particular, only 0.5% of co-expressed gene pairs are shared by ≥10 cell types in the fly brain. This number is at the lower end compared with previous studies of different biological networks. For example, Skinnider et al. (2021) constructed tissue-specific PPI networks for seven mouse tissues and found 0.7% of all detected PPIs were shared by all tissues. Neph et al. (2012) built TF interaction networks for 41 cell types in humans and found that five percent of interacting TFs were common to all cell types. Almass et al. (2005) used flux-balance analysis to study active metabolic reactions of Escherichia coli in 30,000 diverse simulated environments and found 90 of 758 (11.9%) reactions were always active.
What are the factors that contribute to the size of a core network? From a statistical perspective, the number of co-expressed genes change along with parameter choices, which in turn modify the observed core network size. From a biological perspective, different biological contexts, such as organ, sex, genotype and age, might have condition-specific co-expressed gene pairs, which would affect the core network edge compositions and hence its size. Our defined core network was discovered using fly brains, a complex organ with highly heterogeneous cell type composition. Projecting such an analysis to more organs, or even to a whole fly, would very likely reveal an even smaller core, as the inclusion of a larger set of diverse cells would lead to a smaller set of universal edges. Furthermore, some of the modules that we find in the core we describe here appear to be related to the brain in particular, and so it seems reasonable to presume that those modules would not be found in an analysis that includes more organs or tissues. We therefore speculate that the relative core size of 0.5% that we observe is an overestimate of the true core network size for all cells found in Drosophila melanogaster. While the 1810 edges and 179 genes in the core might decrease in an organism-wide analysis, we postulate that such an analysis could ultimately identify modules with a low but constant number of co-expressed genes due to the presence of a small core network common to all cells in an individual.
Another prominent feature of this core network is its dense connectivity. The gene network architecture we observed, which embodies extensive cell-type specific interactions along with a shared and densely connected core, echoes findings from other types of biological networks. For example, Liu et al. (2020) identified 13,764 PPIs in yeast across nine environments and found that 60% of PPIs were found in only one environment. They also show that PPIs, present in ≥8 environments, form ‘tight’ modules of high node degree, while PPIs in ≤3 environments form less-connected modules of smaller node degree (Liu et al. 2020). Protein interaction networks based on just two human cell lines revealed that shared interactions tend to reside in dense subnetworks and correspond to known protein complexes such as the exosome and the COP9 signalosome (Huttlin et al. 2021). Similarly, network analyses of gene co-expression from bulk transcriptomics in Arabidopsis and humans suggest a highly connected core, which appears alongside an extensive number of condition-specific gene interactions (He and Maslov 2016; Lee et al. 2004). Taken together, these results suggest a universal organizing principle in biological systems, where widely shared components of interaction networks are relatively small and densely connected (Milo et al. 2004; 2002; Csermely et al. 2013).
An evolutionary perspective of the multi-part core network
Previous work suggests that biological systems evolve and function in a modular fashion, where groups of genes that share functional relationships tend to co-evolve independently of genes in other functional groups, and where genes and proteins that share function tend to be co-regulated (Hartwell et al. 1999; Schlosser and Wagner 2004; Ryan et al. 2012; Ge et al. 2001; Martin and Fraser 2018). Consistent with this, we find the core network is modularly structured. Modules within the core network have different evolutionary signatures and enrich different biological functions. In our analysis of the age distributions of module gene members, we found some modules with genes of ancient origin, and others with a mixture of ancient and young genes, and at least one having a surprisingly young signature.
It is obviously of great interest to determine the origination time and evolutionary dynamics of the core network modules. As a first step, we dissected the module gene members into phylostratographic age groups. However, this gene age information is not sufficient to infer module ages, as the mere presence of two ancient genes is not equivalent to ancient co-expression, genes can be co-opted to generate new functions by changing their patterns of regulation (Ruprecht, Vaid, et al. 2017; Thompson, Regev, and Roy 2015). To better estimate the evolutionary origin of each module, we would need to apply a phylogenetic analysis of gene co-expression, and thus module dynamics, across multiple species. Given the focus here on a single species, we cannot infer the degree of evolutionary conservation of the co-expression relationships themselves, and so we cannot determine if the network modules we describe are themselves of different ages. That said, there is still some evolutionary inference we can draw based on the evolutionary ages of the genes within each module. Gene modules with a young age signature are only feasible after those young genes emerged. Thus, gene age sets an upper bound on module origination time. For example, the ages of genes in module 4 are distributed among ‘Bilateria’, ‘Protostomia’, and ‘Arthropoda’ evolutionary periods. The most recent of these groups, the Arthropoda, thus sets an upper bound on module age—it must have arisen sometime after the origin of arthropods.
Our observation of core modules with genes of different ages is in line with previous comparative studies based on bulk transcriptomics, which suggest that core modules may have evolved at different times (Pembroke, Hartl, and Geschwind 2021; Stuart et al. 2003). Our work however points toward a more limited core network, both in size and in function, than these studies. At the resolution afforded by bulk transcriptomic analysis, ancient co-expression modules preserved across species appear quite broad in function, including ribosome, proteasome, energy generation, cell cycle, secretion, transcription and translation functions (Stuart et al. 2003), while less evolutionarily conserved modules are naturally involved in an even broader range of functions (Pembroke, Hartl, and Geschwind 2021; Stuart et al. 2003). We show however that even in a single species, the conserved core network is enriched in a smaller range of functions, and we argue that this is an overestimate of the core network that may be conserved across a whole organism, much less across species. Of the two modules that we describe that consist of evolutionarily ancient genes, one was functionally enriched for ribosome biogenesis and the other for protein folding. Due to the gene-age distribution of these modules relative to the others we identify, we speculate that these two modules are most likely to be conserved across the widest range of cells and of species. The ‘hybrid’ modules, containing both young and old genes, enrich ATP metabolic processes, oxidative phosphorylation, glycolysis, and chemical synaptic transmission. This pattern points to these hybrid core modules being important for energy metabolism, perhaps in brain cells in particular, but regardless, we suspect that these modules would be less conserved across cells and species. To obtain a more complete understanding of the emergence, assembly and evolutionary dynamics of the core cellular network and its conserved functions, future studies should focus on obtaining single cell data from more tissues and from multiple species.
Limitation and future directions
In this study, we sought a core of interacting genes found across cell types in the fly brain. While the work described here benefits from access to high quality single-cell transcriptome data, there are still several caveats worth noting. First, the fly brain cell atlas (Davie et al. 2018) was generated using a mixture of two genotypes, and with cells from both female and male fly brains and from individuals of several ages. Thus, genotype, sex or age-specific gene co-expression patterns are hidden. Future studies targeting individual genotypes, separate sexes, and/or specific age groups might identify core networks that differ by age, sex or genotype. Second, we inferred co-expressed gene pairs from gene expression data statistically. Gene co-expression is not equivalent to gene co-regulation, which may be more indicative of functional relationships. Further experimental work is needed to validate the functional implications of these gene pairs. Lastly, we note that this analysis is based on scRNA-seq data, rather than single nuclear RNA-seq. These two approaches might capture different aspects of cell activity (H. Wu et al. 2019; Denisenko et al. 2020; Thrupp et al. 2020).
To fully understand the molecular basis of cell functions, we need to integrate biological networks from different domains—e.g., transcriptome, proteome, or metabolome. It would be of considerable interest to compare core networks defined for each domain and to study their relationships. For example, it has been shown that genes whose protein products physically interact tend to be co-expressed together, suggesting an interdependence of network structure between biological domains (Fraser et al. 2004; Ge et al. 2001; Lemos, Meiklejohn, and Hartl 2004). A number of challenges exist however, such as how to define core networks for different types of data, and how to relate networks between domains (Civelek and Lusis 2014; Mitra et al. 2013). Future studies addressing these challenges may identify a systematic approach to comprehensively survey and compare core networks in different domains. Such an analysis could elucidate the organizing principles of cellular networks and provide deeper insight into the evolutionary origin and molecular functions shared by all cells.
Conclusions
In summary, we leveraged single cell transcriptome data to reveal a core cellular network in fly brains, and deciphered its topological, structural, functional, and evolutionary properties. Our study demonstrates that studying single cell data through a network approach can provide novel insights into understanding cellular functions in a complex organ. It would be valuable to apply our analysis to similar data from different organs, and in multiple species, to reveal the most conserved network components, and the core networks that exist in cells of all multicellular organisms.
Materials and Methods
Dataset collection and preprocessing
We downloaded the fly brain atlas data from NCBI Gene Expression Omnibus with GEO accession ‘GSE107451’. The original dataset contains 17,473 gene expression data in 56,902 high-quality brain cells grouped into 115 cell clusters. As a quality control step, we first removed 668 cells in a cell cluster named ‘Hsp’ as they represent stressed cells (Jasper Janssens, personal communication). We then removed cells that had either less than 200 expressed genes, less than 500 total unique molecular identifier counts, or a total fraction of mitochondrial gene expression exceeding 30%. These criteria led to the removal of another 42 cells, leaving 56,192 cells. These cells were annotated to 115 cell clusters (Davie et al. 2018). We selected 33 cell clusters which had at least 200 cells and were annotated to known brain cell types in the following analyses (Figure S1).
We filtered genes for each cell type individually by removing genes that were expressed in less than 15 cells, or in fewer than 0.5% of cells in that cell type. This gene filtering procedure led to 8013 genes as expressed in at least one cell type, 2368 of which were commonly expressed in all 33 cell types (Figure S1).
Constructing cell type-specific gene co-expression networks
We used the bigScale2 algorithm (Iacono, Massoni-Badosa, and Heyn 2019) to compute a gene-gene correlation matrix for each cell type (Figure S2). This algorithm was tailored to mitigate the impact of sparse counts at the single-cell level. It first groups cells into homogenous cell clusters, then performs differential expression (DE) analysis between all pairs of clusters. With N clusters, we obtain N*(N-1)/2 unique comparisons and each comparison generates one Z-score for each gene, indicating the likelihood of an expression change between the corresponding two clusters. Finally, bigScale2 uses transformed Z-scores instead of original expression values to calculate Pearson correlation coefficients (Figures S3). For each cell type, we ranked gene pairs by their absolute correlation values and placed the top 1% of correlated gene pairs into a co-expression network, with the corresponding absolute correlation values ranging from 0.53 to 0.93. Network summary statistics, including major component size, average path length, and clustering coefficient were calculated using functions from the R package iGraph (Csardi and Nepusz 2006) (Table S1).
Computing gene and edge commonality distributions
To evaluate commonality and specificity across cell type-specific networks, we plot the node and edge commonality distributions. The commonality of a node (gene) refers to the number of cell types in which this gene was found to be co-expressed (edge) with at least one other gene. The commonality of an edge linking a given pair of genes refers to the number of cell types in which this edge is detected.
A mathematical approximation of the edge commonality distribution
We derived a mathematical approximation for the probability of a gene pair to be co-expressed in a given number of cell types. As we focused on 2,368 commonly expressed genes and selected the top 1% highly correlated genes in each cell type, a gene pair has a probability of 0.01 as being co-expressed in any one cell type. Examining 33 cell types and using the binomial distribution, the probability P(k) of a gene pair co-expressed in k cell types equal
 with the first term representing the combinatorial number describing the number of ways of picking k items from a pool of 33 cell types. Following this equation, the probability of a gene pair not co-expressed in any cell type is 0.7177 at k = 0. Given the 2,368 commonly expressed genes, C (2358,2) * (1 − 0.7177) = 791,068 non-redundant gene pairs were expected to co-express in at least one cell type.
Network randomization
To obtain a null distribution for edge commonality distributions, we used a network randomization approach. We randomized the edges in each cell type-specific network individually keeping the gene connectivities fixed using the rewire function in iGraph. A set of randomizations for all 33 cell types resulted in one pseudo edge commonality distribution. We performed the randomization procedure 100 times and used the ensemble of the 100 pseudo edge commonality distributions as the null distribution. We computed the null distribution with different percentile cutoff values and used Jensen–Shannon divergence with the JSD function from the R package Philentropy (Drost 2018) to measure the distance between two distributions.
Calculation of clustering coefficient per edge
To determine the topological properties of edges with different levels of commonality, we calculated a clustering coefficient for each edge following the approach in Huttlin et al. 2021. We combined all cell type-specific networks into a pan-network whose edge weights reflected edge commonality. For each edge in the pan-network, we extracted all first-degree neighbors of the two genes constituting this edge. These neighbors and the two focal genes defined a subgraph from the whole pan-network. For each subgraph, we calculated the clustering coefficient as the number of triangles (3 vertices with three edges) divided by the number of connected triples (3 vertices with two edges). As the clustering coefficient of a graph is related to its connectivity, or edge density, a high local clustering coefficient indicates that this edge is located in a dense subnetwork.
Rank aggregation analysis
Each gene pair or edge has an rank based on its absolute correlation value in a given cell type. To quantify if one edge is ranked consistently higher across a set of cell types based on its absolute correlation value, we used the aggregateRanks function from the R package RobustRankAggreg (Kolde et al. 2012). This function is based on a probabilistic model of order statistics and computes a derived P value for each edge. The derived P value ranges from 0 to 1 and serves as an upper bound of the computationally expensive exact P value, with a small value indicating one edge is ranked consistently higher across cell types and a larger value meaning one edge’s rank distribution over cell types follows a random pattern. We chose 10 edge commonality groups: 1, 4, 8, 10, 12, 14, 16, 18, 20, and 22. Within each edge commonality group, we randomly sampled 100 edges. For each edge, we first collected the cell types that this edge was absent (didn’t make to the top 0.1% correlations), and then calculated the derived P values on these cell types. The derived P values were corrected for multiple testing using the p.adjust function in R with the Benjamini-Hochberg method, referred to as adjusted P values hereafter. We plotted the adjusted P value distribution of the 100 sampled edges for each edge commonality group separately.
Module decomposition and functional annotation of the core
To decompose the core cellular network into highly connected modules, we used the mcl function from the R package MCL (Jäger 2015) which implements a Markov cluster algorithm to identify clusters in networks. After module detection, we performed Gene Ontology (GO) enrichment analysis of genes in each module using the R package clusterProfiler (T. Wu et al. 2021) with a Bonferroni correction and an adjusted P value cutoff of 0.05. Significant GO terms were identified and refined to reduce redundant GO terms via the simplify method from the clusterProfiler package.
Assigning genes into evolutionary age groups
We downloaded data from a previous study to assign genes into different evolutionary age groups using a phylostratigraphy framework (Domazet-Lošo et al. 2017). This framework allows us to date the evolutionary origination time of a gene by identifying its homologs across the tree of life. There were 13,794 genes assigned to 12 age groups in the original publication, 2,222 of which overlapped with the 2,368 expressed genes in this study, including 1,021 genes in the oldest age group “CellLife”, 707 in “Eukaryota”, 88 in “Opisthokonta”, 140 in “Metazoa”, 34 in “Eumetazoa”, 78 in “Bilateria”, 15 in “Protostomia”, 17 in “Arthropoda”, 16 in “Pancrustacea”, 46 in “Insecta”, 48 in “Diptera” and 12 in the youngest age group “Drosophila”.
Declarations
Ethics approval and consent to participate
Not applicable
Consent for publication
Not applicable
Availability of data and materials
The fly brain atlas dataset analyzed during the current study is available at GEO with accession number GSE107451. R scripts for data analyses are available from the following GitHub repository: https://github.com/mingwhy/fly.brain.core_coexpr.net.
Competing interests
The authors declare that they have no competing interests.
Funding
This work was supported in part by National Institute on Aging grants R21AG56872901, R01AG057330, and R01AG063371.
Authors’ contributions
MY and DP designed the study. MY collected and analyzed the data. MY, BH and DP interpreted the data and wrote the manuscript. All authors read and approved the final manuscript.
Acknowledgements
This work was in part facilitated through the use of advanced computational, storage, and networking infrastructure provided by the Hyak supercomputer system at the University of Washington.


