

Abstract
Reading involves the functioning of a widely distributed brain network, and white matter tracts are responsible for sending information between constituent network nodes. Several studies have analyzed fiber bundle microstructural properties to shed insights into the neural basis of reading abilities and disabilities. Findings have been inconsistent, potentially due to small sample sizes and varying methodology. To address this, we analyzed a large data set of 690 children ages 5-18 using state-of-the-art neuroimaging acquisitions and processing techniques. We searched for associations between fractional anisotropy (FA) and single-word and nonword reading skills in both typical and poor readers across multiple tracts previously thought to contribute to reading. Consistent with prior studies, FA increased with age across all tracts. There were significant correlations between better reading skills and higher FA in several fiber bundles among poor readers, but fewer and occasionally negative associations among proficient readers. The left superior longitudinal fasciculus and arcuate fasciculus unexpectedly exhibited higher FA within those diagnosed with reading disabilities compared to those without a diagnosis, while their right-hemisphere homologs exhibited higher FA in those with higher reading scores, regardless of diagnostic status. These results suggest a different relation between white matter pathways in children with typical reading ability versus those with reading disabilities.
Highlights
Fractional anisotropy (FA) positively correlated with age across all examined tracts.
We looked for group differences in FA and correlations between FA and reading skills.
Those with reading disabilities had higher FA in left-hemisphere reading tracts.
Several tracts’ FA positively correlated with reading skills among poor readers.
Few tracts’ FA correlated with reading skill among proficient readers.
1 Introduction
The development of reading skills is vital for progress in education and communication. Reading disability is the most prevalent learning disability and is characterized by difficulty with word reading accuracy and/or fluency [Roongpraiwan et al., 2002, Lyon et al., 2003]. Multiple studies have reported structural and functional brain differences in children and adults with reading disability [Eckert, 2004, Maisog et al., 2008, Pugh et al., 2000, Cattinelli et al., 2013, Richlan et al., 2013, Jednorog et al., 2015, Linkersdörfer et al., 2012], including differences in white matter pathways as measured by diffusion tensor imaging (DTI) [Vandermosten et al., 2012b]. Studies of this nature often report the relationship between reading scores and tract fractional anisotropy (FA), which quantifies how restricted water movement is in a given area [Hagmann et al., 2006, Basser and Pierpaoli, 1996] and can be interpreted as an index of white matter coherence [Beaulieu, 2002]. Such associations may be important to identify because these fiber bundles of myelinated axons connect the gray matter regions that support reading, and especially the left-hemisphere reading network comprised of the angular gyrus, precuneus, middle temporal gyrus, superior temporal gyrus, fusiform gyrus (including the visual word form area), and inferior frontal gyrus (including Broca’s area) [Cattinelli et al., 2013, Wandell and Yeatman, 2013, Murphy et al., 2019].
Studies of white matter microstructural properties as they relate to reading abilities in children and adults have yielded interesting, albeit sometimes inconsistent, results. The most commonly implicated tract in DTI studies of reading skills is the superior longitudinal fasciculus (SLF), particularly in the left hemisphere, which connects frontal and temporoparietal brain regions [Wang et al., 2016]. Multiple studies have found that higher FA in bilateral SLF is associated with better reading outcomes, whether that manifests from group comparisons between dyslexic and typically reading individuals [Richards et al., 2008, Steinbrink et al., 2008, Carter et al., 2009, Marino et al., 2014] or correlations with reading test scores on a continuous scale [Steinbrink et al., 2008, Carter et al., 2009, Hoeft et al., 2011, Feldman et al., 2012, Lebel et al., 2013, Zhang et al., 2014, Horowitz-Kraus et al., 2015, Borchers et al., 2019]. However, other studies that have investigated the SLF, whether from a whole-brain or targeted approach, have failed to replicate this [Odegard et al., 2009, Welcome and Joanisse, 2014, Arrington et al., 2017], and a few studies have even reported negative FA-reading associations in the SLF [Carter et al., 2009, Frye et al., 2011]. The temporal sub-component of the SLF, the arcuate fasciculus (AF), has also been linked to reading performance [Rauschecker et al., 2009], and has often been analyzed separately from other SLF components due to its unique contributions to the language network [Catani et al., 2005]. Similarly, FA reductions in dyslexia have been reported in the left AF [Marino et al., 2014, Klingberg et al., 2000, Deutsch et al., 2005, Vandermosten et al., 2012a, Christodoulou et al., 2017, Su et al., 2018], and its FA has been positively associated with reading skills [Borchers et al., 2019, Klingberg et al., 2000, Deutsch et al., 2005, Christodoulou et al., 2017, Yeatman et al., 2012a, Horowitz-Kraus et al., 2014]. However, bilateral AF regions of higher FA in dyslexia have been identified [Žarić et al., 2018], and separate studies have reported negative FA-reading associations in the left AF [Christodoulou et al., 2017, Yeatman et al., 2012a, Huber et al., 2018]
Two fiber bundles that run under the SLF, the inferior longitudinal fasciculus (ILF) and inferior fronto-occipital fasciculus (IFO), serve to connect occipital and temporal-occipital areas to anterior temporal and frontal regions, respectively [Herbet et al., 2018, Martino et al., 2010], and have been identified as candidate reading tracts [Vandermosten et al., 2012a, Yeatman et al., 2013]. The left ILF has exhibited increased FA in typically developing readers compared to dyslexic readers [Steinbrink et al., 2008, Marino et al., 2014, Su et al., 2018], and bilateral ILF FA has been positively related to reading performance [Steinbrink et al., 2008, Feldman et al., 2012, Lebel et al., 2013, Zhang et al., 2014, Horowitz-Kraus et al., 2015, Odegard et al., 2009, Yeatman et al., 2012a, Horowitz-Kraus et al., 2014]. However, a few studies have found negative associations between FA and reading scores in the left ILF [Yeatman et al., 2012a, Huber et al., 2018], and a study has found increased left ILF FA in dyslexic individuals compared to their neurotypical counterparts [Banfi et al., 2019]. While studies have only identified positive correlations between FA and reading in bilateral IFO [Steinbrink et al., 2008, Feldman et al., 2012, Lebel et al., 2013, Zhang et al., 2014, Odegard et al., 2009, Welcome and Joanisse, 2014, Arrington et al., 2017], only a single study has found a reduction in left IFO FA in dyslexia [Steinbrink et al., 2008]. It is worth noting that other investigations have also yielded null results in these tracts [Borchers et al., 2019, Frye et al., 2011, Klingberg et al., 2000].
The uncinate fasciculus (UF) is thought to contribute to the ventral orthographic pathways of reading, connecting temporal and orbitofrontal regions [Catani et al., 2002, Schlaggar and McCandliss, 2007]. Despite reports of positive associations between FA and reading skills in bilateral UF [Feldman et al., 2012, Zhang et al., 2014, Odegard et al., 2009, Welcome and Joanisse, 2014, Arrington et al., 2017], the only significant group difference in FA that has been reported favored higher FA in dyslexia [Arrington et al., 2017]. The same study also reported a negative correlation between FA and one of their reading measures in the right UF [Arrington et al., 2017]. The splenium of the corpus callosum is also thought to contribute to reading, as it subserves interhemispheric communication between visual cortices [Putnam et al., 2010]. Opposing results for both group [Marino et al., 2014, Frye et al., 2008] and continuous analyses [Feldman et al., 2012, Lebel et al., 2013, Zhang et al., 2014, Odegard et al., 2009, Huber et al., 2018, Frye et al., 2008] have been reported.
One theory of the etiology of dyslexia is the cerebellar hypothesis, which implicates cerebellar dysfunction in deficits of procedural learning and reading fluency [Nicolson and Fawcett, 2007, Nicolson et al., 2001, Stoodley and Stein, 2011]. To this end, the contributions of the superior (SCP), inferior (ICP), and middle (MCP) cerebellar peduncles to reading have been investigated. The SCP contain efferent fibers that connect the deep cerebellum to inferior prefrontal regions involved in reading [Bruckert et al., 2020]. The ICP and MCP contains primarily afferent fibers which connect brainstem with the cerebellum. Such connections may facilitate automation of articulatory and oculomotor control [Bruckert et al., 2020]. Bilateral SCP FA has exhibited negative relations to reading skill [Bruckert et al., 2020, Travis et al., 2015], while the left ICP has shown both positive [Borchers et al., 2019] and negative [Travis et al., 2015] associations. In the MCP, separate studies have paradoxically reported a higher FA in dyslexia compared to typically developing readers [Richards et al., 2008] as well as a positive association between FA and reading skills [Lebel et al., 2013, Travis et al., 2015].
Despite the general trend of higher FA relating to better reading and modest agreement in reading tract outcomes, a recent meta-analysis showed no evidence for systemic FA disruptions in dyslexia [Moreau et al., 2018]. Small cohort sizes, inhomogeneous acquisition parameters, and diversity in processing and analytical methods may underlie the inconsistencies in past results [Ramus et al., 2018, Moreau et al., 2018, Schilling et al., 2021]. To address this, we leveraged the large database from the Healthy Brain Network [Alexander et al., 2017] to investigate white matter microstructural correlates of individual differences in single-word and single-nonword aptitude in children with diverse reading abilities. We additionally looked for tract-specific differences in FA between typical and poor readers. We implemented two criteria independently for delineating between reading proficiency groups, one based on diagnoses by clinicians of specific learning disorder with impairment in reading (similar to dyslexia), and the other based on a standardized reading measure.
2 Methods
2.1 Participants
We downloaded data from 1221 participants across the first 8 data releases of the Healthy Brain Network project [Alexander et al., 2017]. Participants were all scanned at Rutgers University. All data were accessed in accordance with a data use agreement provided by the project team. The Healthy Brain Network project was approved by the Chesapeake Institutional Review Board (https://www.chesapeakeirb.com/). The research team obtained written informed consent from participants age 18 or older. For younger participants, written informed consent was collected from their legal guardians, while written assent was obtained from the participant. Full inclusion and exclusion criteria are described in the project’s publication [Alexander et al., 2017]. Of note, each participant was fluent in English, had an IQ over 66, and did not have any physical or mental disorder precluding them from completing the full battery of scanning and behavioral examinations. Several behavioral and cognitive evaluations were collected as part of the project. Relevant to this study, participants completed the Test of Word Reading Efficacy 2nd edition (TOWRE) [Torgesen et al., 1999] and the Edinburgh Handedness Inventory (EHI) [Oldfield, 1971].
The TOWRE consists of two subtests, Sight Word Efficiency (SWE) and Phonemic Decoding Efficiency (PDE). For Sight Word Efficiency, each participant is shown a list of words and asked to read the words aloud as quickly as possible. Raw scores are based on the number of words read correctly within the 45-second time limit and then converted to a standard score (population mean = 100, SD = 15). For Phonemic Decoding Efficiency, each participant is shown a list of pseudowords and asked to read the pseudowords aloud as quickly as possible. Raw scores are based on the number of pseudowords read correctly within the 45-second time limit and then converted to a standard score (population mean = 100, SD = 15). The composite TOWRE score is the mean of the two standardized scores.
After quality control (QC), there were 690 participants aged 5-18 years old. Two sets of comparisons were made in this study. The first comparison was between children with diagnosed reading disabilities (RD, n = 106) and typically reading children (TR, n = 584). Participants were included in the RD group if they were diagnosed with “Specific Learning Disorder with Impairment in Reading.” These diagnoses came from a panel of clinicians associated with the Healthy Brain Network and were made following the 5th edition of the Diagnostic and Statistical Manual for Mental Disorders [Edition et al., 2013], although the specific criteria were not made available. All other participants were included in the TR group. The second comparison used a TOWRE cutoff of 85 to delineate poor (Low-TOWRE, n = 165) and proficient (High-TOWRE, n = 525) readers (Figure 1). This threshold is 1 standard deviation below the population mean and is conventionally used for diagnosing reading disabilities [Heath et al., 2006, Pugh et al., 2014, Johnston et al., 2016].

Distribution of standardized TOWRE composite scores across all participants. Gray bars denote TR participants, and black bars denote RD participants. The black dotted line marks a TOWRE score of 85 which separates the Low-TOWRE and High-TOWRE groups.
We compared the ages, sex distribution, and handedness between the groups (Table 1). Both the TR and High-TOWRE groups were older than their poorer reading counterparts (for both comparisons, p < 0.05, Welch’s t-test). There were overall more males than females in the cohort, and the proportions of sexes did not significantly differ between groups (between RD and TR: p > 0.05; between Low-TOWRE and High-TOWRE: p > 0.9; χ2 tests). Handedness did not differ between groups (for both comparisons, p > 0.4, Welch’s t-test).
Phenotype information in the different reading proficiency groups. Values are listed as mean (standard deviation). For group comparisons of age, * denotes p < 0.05, and † denotes p < 0.01 (Welch’s t-tests).
2.2 Neuroimaging Acquisition
Participants were scanned using a Siemens 3T Tim Trio scanner while wearing a standard Siemens 32-channel head coil. A high resolution T1-weighted (T1w) sequence was collected with the following parameters: TR = 2500 ms, TE = 3.15 ms, Flip Angle = 8◦, 0.8 mm isotropic voxel resolution. A diffusion kurtosis imaging scan was administered with the following parameters: TR = 3320 ms, TE = 100.2 ms, Flip Angle = 90◦, 1.8 mm isotropic voxel resolution, 1 b = 0 image, 64 noncollinear directions collected at b = 1000 s/mm2 and b = 2000 s/mm2. A pair of PEpolar fieldmaps were collected before the diffusion scan to quantify magnetic field inhomogeneity. Detailed scanner protocols are published on the Healthy Brain Network project website (http://fcon_1000.projects.nitrc.org/indi/cmi_healthy_brain_network/File/mri/HBN_RU_Protocol.pdf).
2.3 Neuroimaging Preprocessing
Results included in this manuscript come from preprocessing performed using QSIPrep 0.13.0RC1 [Cieslak et al., 2021, RID:SCR_016216] (https://qsiprep.readthedocs.io/en/latest/) which is based on Nipype 1.6.0 [Gorgolewski et al., 2011, 2018, RRID:SCR_002502]. Many internal operations of QSIPrep use Nilearn 0.7.0 [Abraham et al., 2014, RRID:SCR_001362] and Dipy 1.3.0 [Garyfallidis et al., 2014, RRID:SCR_000029]. For more details of the pipelines, see the section corresponding to workflows in QSIPrep’s documentation (https://qsiprep.readthedocs.io/en/latest/preprocessing.html#preprocessing-pipeline-details). The text in the following two sections was provided by QSIPrep under a CC0 license with the explicit instruction that it be included in a manuscript for the sake of transparency and reproducibility. We made minor changes for readability.
2.3.1 Anatomical Preprocessing
The T1w image was corrected for intensity non-uniformity (INU) with N4BiasFieldCorrection [Tustison et al., 2010], distributed with ANTs 2.3.3 [Avants et al., 2008, RRID:SCR_004757], and used as the T1w-reference throughout the workflows. The T1w-reference was then skull-stripped with a Nipype implementation of the antsBrainExtraction.sh workflow (from ANTs), using OASIS30ANTs as the target template. Brain tissue segmentation of cerebrospinal fluid (CSF), white matter (WM) and gray-matter (GM) was performed on the brain-extracted T1w using fast [Zhang et al., 2001, FSL 5.0.9, RRID:SCR_002823].
2.3.2 Diffusion MRI Preprocessing
MP-PCA denoising as implemented in MRtrix3’s dwidenoise [Veraart et al., 2016] was applied with a 5-voxel window. After MP-PCA, Gibbs unringing was performed using MRtrix3’s mrdegibbs [Kellner et al., 2016]. Following unringing, B1 field inhomogeneity was corrected using dwibiascorrect from MRtrix3 with the N4 algorithm [Tustison et al., 2010]. After B1 bias correction, the mean intensity of the diffusion-weighted imaging (DWI) series was adjusted so all the mean intensity of the b = 0 images matched across each separate DWI scanning sequence.
FSL’s (version 6.0.3:b862cdd5) eddy function was used for head motion correction and Eddy current correction [Andersson and Sotiropoulos, 2016]. The function was configured with a q-space smoothing factor of 10, a total of 5 iterations, and 1000 voxels used to estimate hyperparameters. A linear first level model and a linear second level model were used to characterize Eddy current-related spatial distortion. q-space coordinates were forcefully assigned to shells. Field offset was attempted to be separated from participant movement. Shells were aligned post-eddy. eddy’s outlier replacement was run [Andersson et al., 2016]. Data were grouped by slice, only including values from slices determined to contain at least 250 intracerebral voxels. Groups deviating by more than 4 standard deviations from the prediction had their data replaced with imputed values. Data were collected with reversed phase-encoded blips, resulting in pairs of images with distortions going in opposite directions. Here, b = 0 reference images with reversed phase encoding directions were used along with an equal number of b = 0 images extracted from the DWI scans. From these pairs the susceptibility-induced off-resonance field was estimated using a method similar to that described in [Andersson et al., 2003]. These susceptibility maps were ultimately incorporated into the Eddy current and head motion correction interpolation. Final interpolation was performed using the jac method.
Several confounding time-series were calculated based on the preprocessed DWI: framewise displacement (FD) using the implementation in Nipype (following the definitions by Power et al. [2014]). The head-motion estimates calculated in the correction step were also placed within the corresponding confounds file. Slicewise cross correlation was also calculated. The DWI time-series were resampled to ACPC, generating a preprocessed DWI run in ACPC space with 1.2mm isotropic voxels.
2.4 Tractometry and Statistical Analysis
We used TractSeg version 2.2 [Wasserthal et al., 2018a] (https://github.com/MIC-DKFZ/TractSeg), a deep-learning based white matter segmentation method, to reconstruct white matter tracts and perform tractometry with FA values. We chose this method due to its favorable balance between the accuracy of manual fiber tracking and objectivity of atlas-based methods [Genc et al., 2020]. This involved the following steps: First, we fit the diffusion tensor with a weighted least-squares algorithm [Chang et al., 2005] and produced an FA map using TractSeg’s calc_FA function, which is based off of Dipy [Garyfallidis et al., 2014]. Then, a DWI-to-MNI transformation was calculated with FSL 6.0.4’s flirt [Jenkinson and Smith, 2001] by rigidly aligning the participant’s FA map to a MNI FA template distributed with TractSeg. This transformation was additionally applied to the preprocessed diffusion image and brain mask. We did this to ensure orientation homogeneity across subjects. B-vectors were rotated accordingly using TractSeg’s rotate_bvec function. Multi-tissue fiber response functions were estimated using MRtrix3’s dhollander algorithm [Dhollander et al., 2016, 2019]. Fiber orientation densities (FODs) were estimated via multi-shell multi-tissue constrained spherical deconvolution (CSD) [Tournier et al., 2004, 2008, Jeurissen et al., 2014]. FODs were intensity-normalized using mtnormalize [Raffelt et al., 2017]. The first three principal FOD peaks were extracted and flipped along their x-axis to correct their orientation.
We then segmented 9 bilateral tracts: AF, SLF (I, II, and III), ILF, IFO, UF, SCP, and ICP. We also reconstructed the MCP and splenium of the corpus callosum (CC_7 by TractSeg naming convention), leading to a total of 20 fiber bundles to analyze. To make each tract, we fed the FOD peaks into TractSeg to create binary masks of the tract, the ROIs that define its endpoint, and a corresponding tracking output map (TOM) [Wasserthal et al., 2018b]. These were used as inputs to a pre-trained convolutional neural network to output the segmented fiber bundle [Wasserthal et al., 2019, 2020]. We generated a fixed large number (5000) of fibers per instance to account for the stochastic nature of reconstruction. This reduces inter-run variability. Using an approach based on Dipy’s Bundle Analytics framework [Chandio et al., 2020], FA values were calculated for 100 nodes along the length of the tract. At each node, we employed a non-parametric permutation-based statistical comparison [Nichols and Holmes, 2002] with 5000 iterations to look for correlations (Pearson’s r) between node FA and standardized TOWRE composite scores, accounting for multiple comparisons given the correlative structure between adjacent nodes [Yeatman et al., 2012b]. We linearly regressed out sex (binary 0 or 1) and handedness (EHI score) before performing the regression. Additionally, we ran the same model but correlated FA against single-word (SWE) and nonword (PDE) standardized subscores separately. Finally, we looked for group differences in FA in each tract between reading proficiency groups, employing a two-sample t-test at each node while regressing out age, sex, and handedness. Given the recency of our analysis methods, we first checked for associations between FA and age as a way of validating our method, given the well-established trend of FA increasing with age [Lebel et al., 2019]. For this model we also regressed out sex and handedness.
2.5 Data Inclusion and Quality Control
Of the original 1221 participants, 858 participants had all the necessary neuroimaging data (T1w, diffusion, and fieldmap) and were able to be run through QSIPrep and TractSeg without errors. 6 of those participants had incomplete fiber bundle segmentations. 710 of the remaining participants had all the necessary phenotypic data. An additional 17 participants were excluded for being over 18 years old. For the remaining participants, due to the sheer volume of images included in the cohort, visual inspection of each DWI image was not possible. We instead adopted an automated QC procedure described in [Yeh et al., 2019], which has been integrated into the outputs of QSIPrep. This involves rejecting a scan if it had different or incomplete scanning acquisitions (no participants excluded) or if over 0.1% of slices (9 slices at 72 slices/volume × 128 diffusion volumes) had significant signal dropout based on changes in slice-wise correlation (3 participants excluded). Therefore, a total of n = 690 participants were analyzed.
2.6 Data and Code Availability
Neuroimaging and phenotypic data can be collected following directions on the Healthy Brain Network Data Portal (http://fcon_1000.projects.nitrc.org/indi/cmi_healthy_brain_network/index.html) after signing a data use agreement. We cannot distribute this data publicly. All code for pre-processing neuroimaging data as well as instructions for replicating this study can be found at https://github.com/smeisler/Meisler_ReadingFA_Associations. With minimal modification, the preprocessing code should be able to run on most BIDS-compliant data sets using the SLURM job scheduler [Yoo et al., 2003]. Some software we used was distributed as Docker [Merkel, 2014] containers, and compiled and run with Singularity (3.6.3) [Kurtzer et al., 2017]:
QSIPrep 0.13.0RC1 (singularity build qsiprep.simg docker://pennbbl/qsiprep:0.13.0RC1)
TractSeg 2.2 (singularity build tractseg.simg docker://brainlife/tractseg:2.2)
MRtrix 3.0.2 with FSL 6.0.4 and ANTs 2.3.4 (singularity build mrtrix_fsl_ants.simg docker://sclove/mrtrix3.0.2:latest)
Newer versions of these softwares have since been produced, and we encourage anyone to use the latest stable releases.
3 Results
3.1 Age-FA Correlations
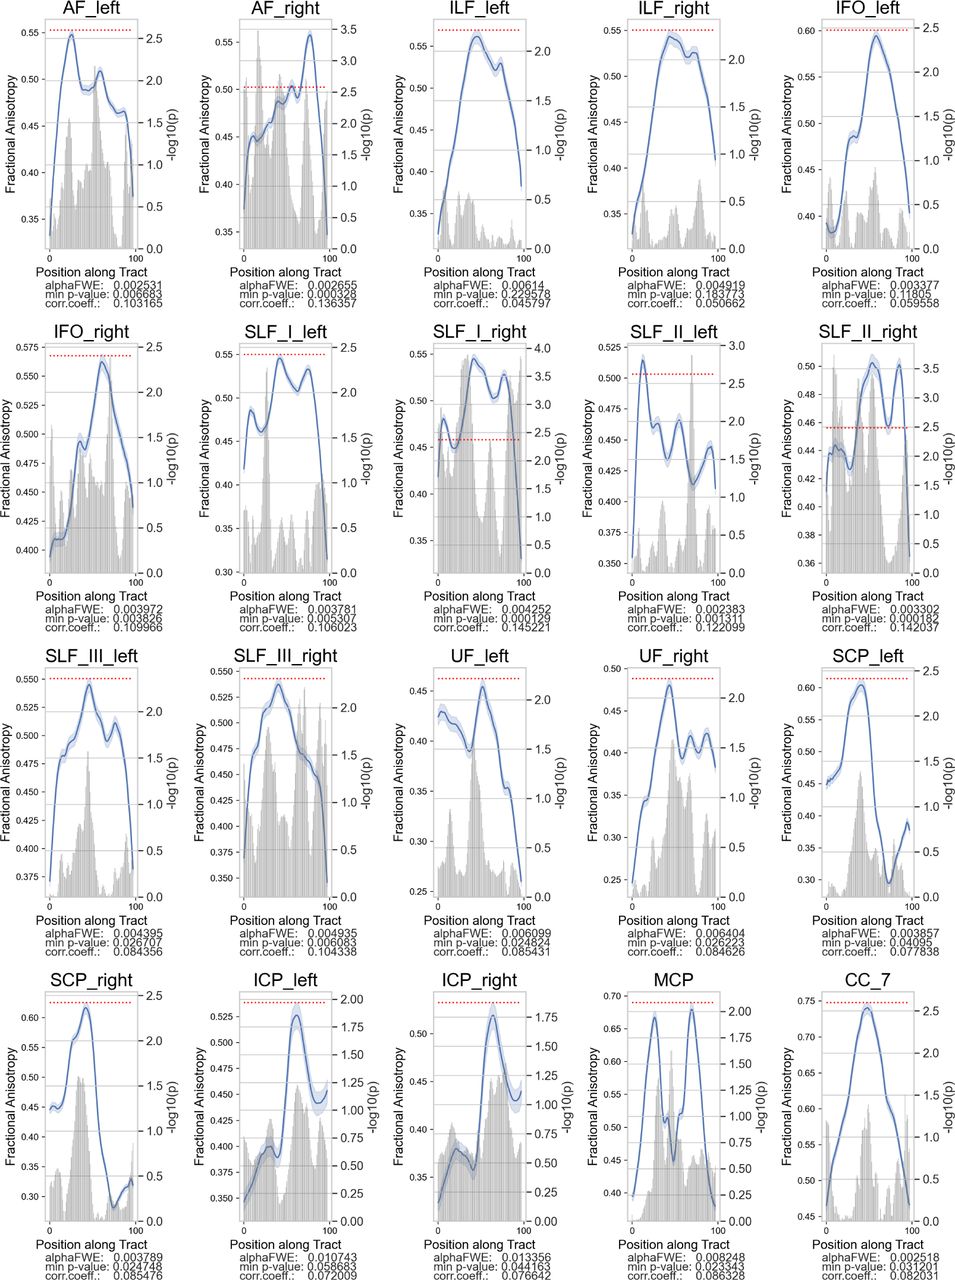
To validate our methods, we checked for associations between FA and age in the entire participant cohort, expecting to see ubiquitously strong positive associations in each tract. All nodes in all 20 tracts besides the splenium, MCP, bilateral SCP, and right ILF, IFO, and UF were significantly positively correlated. In these seven fiber bundles, significant positive associations were still present, but not across the whole tract (Figure 2).

All 20 tracts exhibited significant FA correlations with age across the entire cohort. Each plot represents a different fiber bundle. The blue curve represents the average FA after regressing out sex and handedness. The shaded region surrounding the curve is the 95% confidence interval. The red dotted line depicts the critical FWE-adjusted α (given an uncorrected α of 0.05). The gray bars represent the p-value of the correlation at each node, measured on a -log scale. A gray bar extending above the red line (p < αFWE) denotes a significant node. Below each plot, the critical FWE-adjusted α is listed, along with the strongest correlation achieved in the tract and its associated p-value.
3.2 Reading-FA Associations
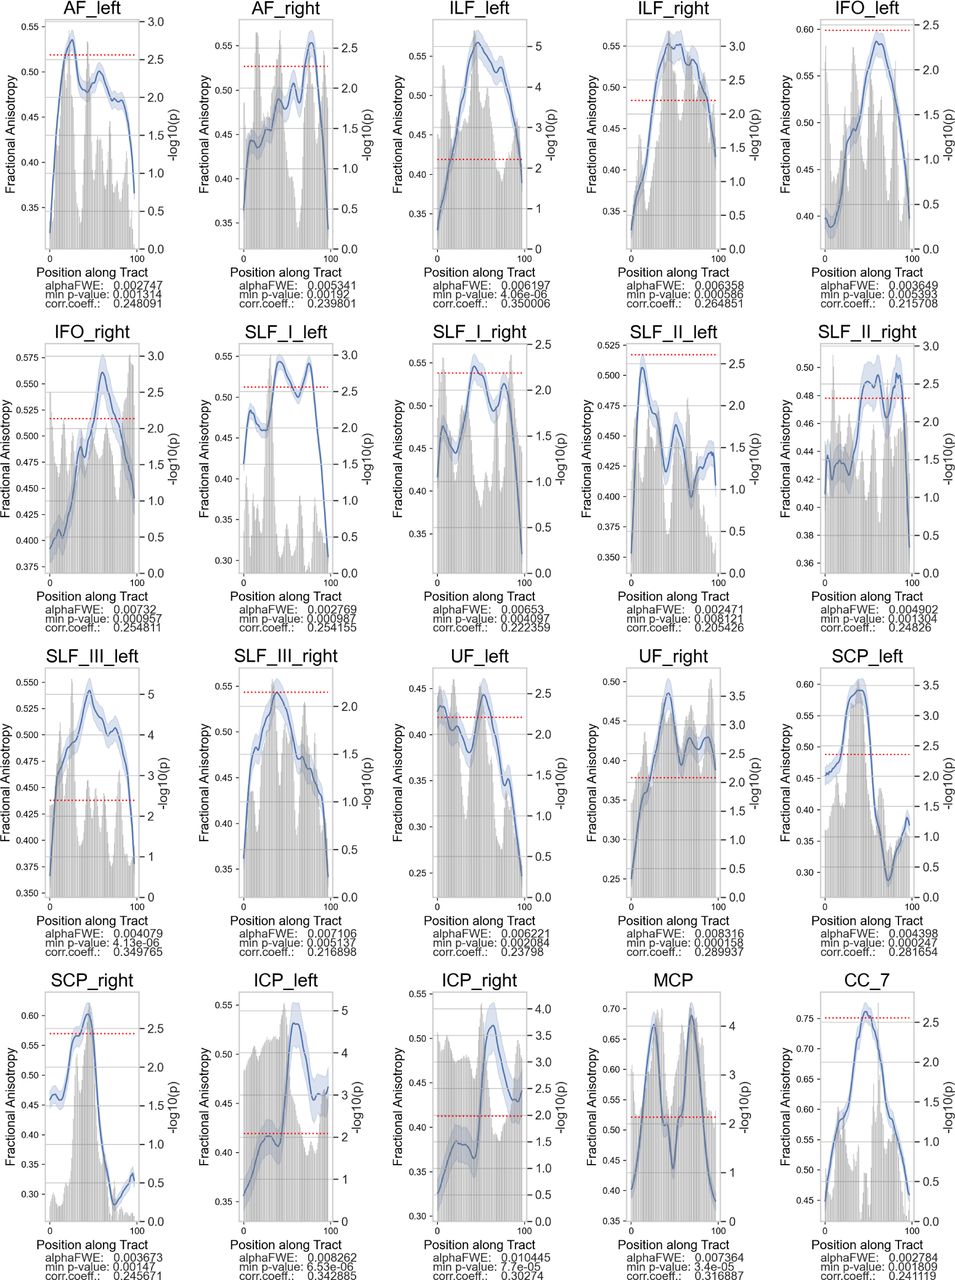
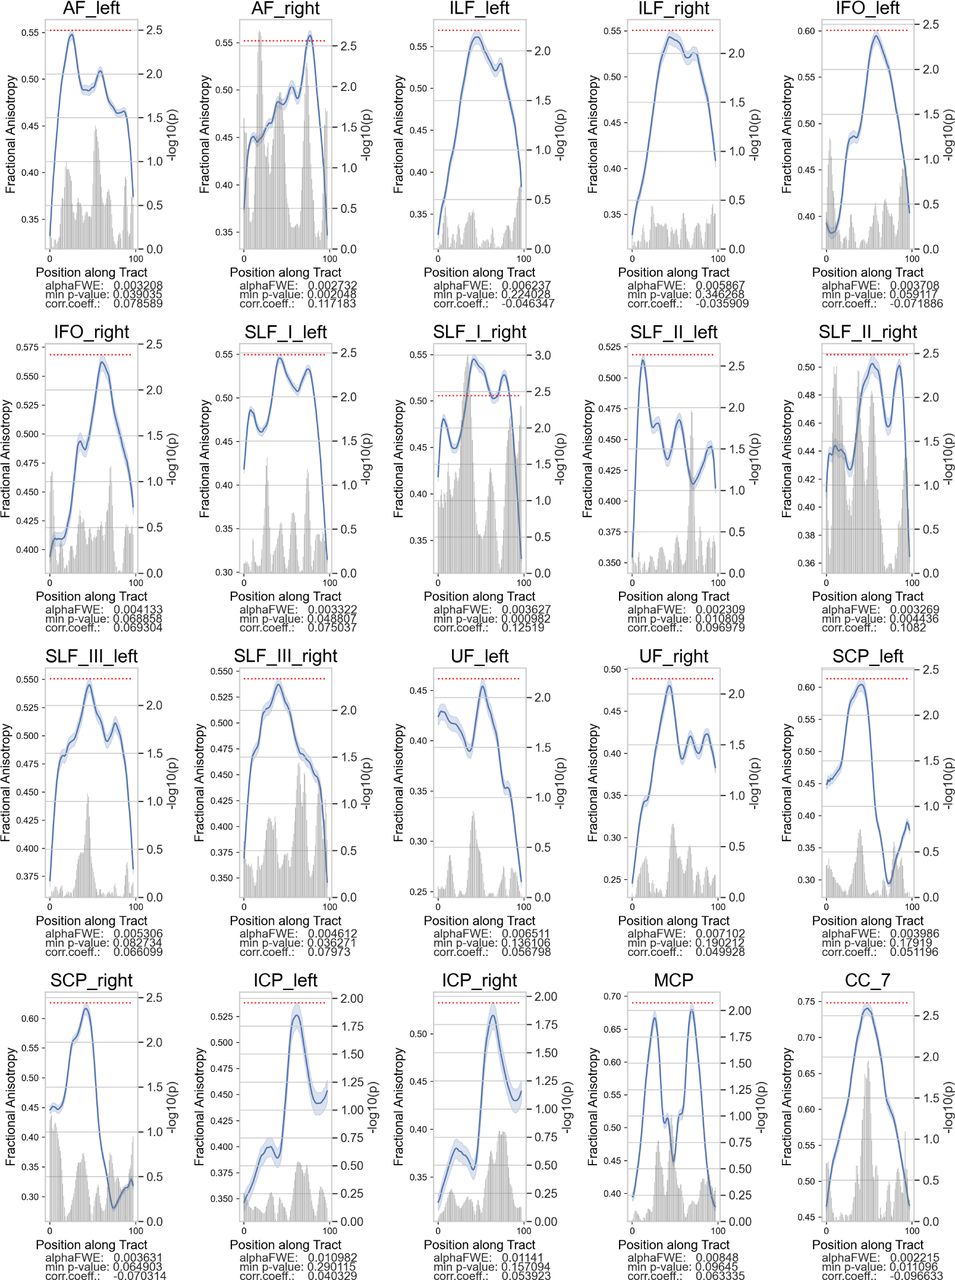
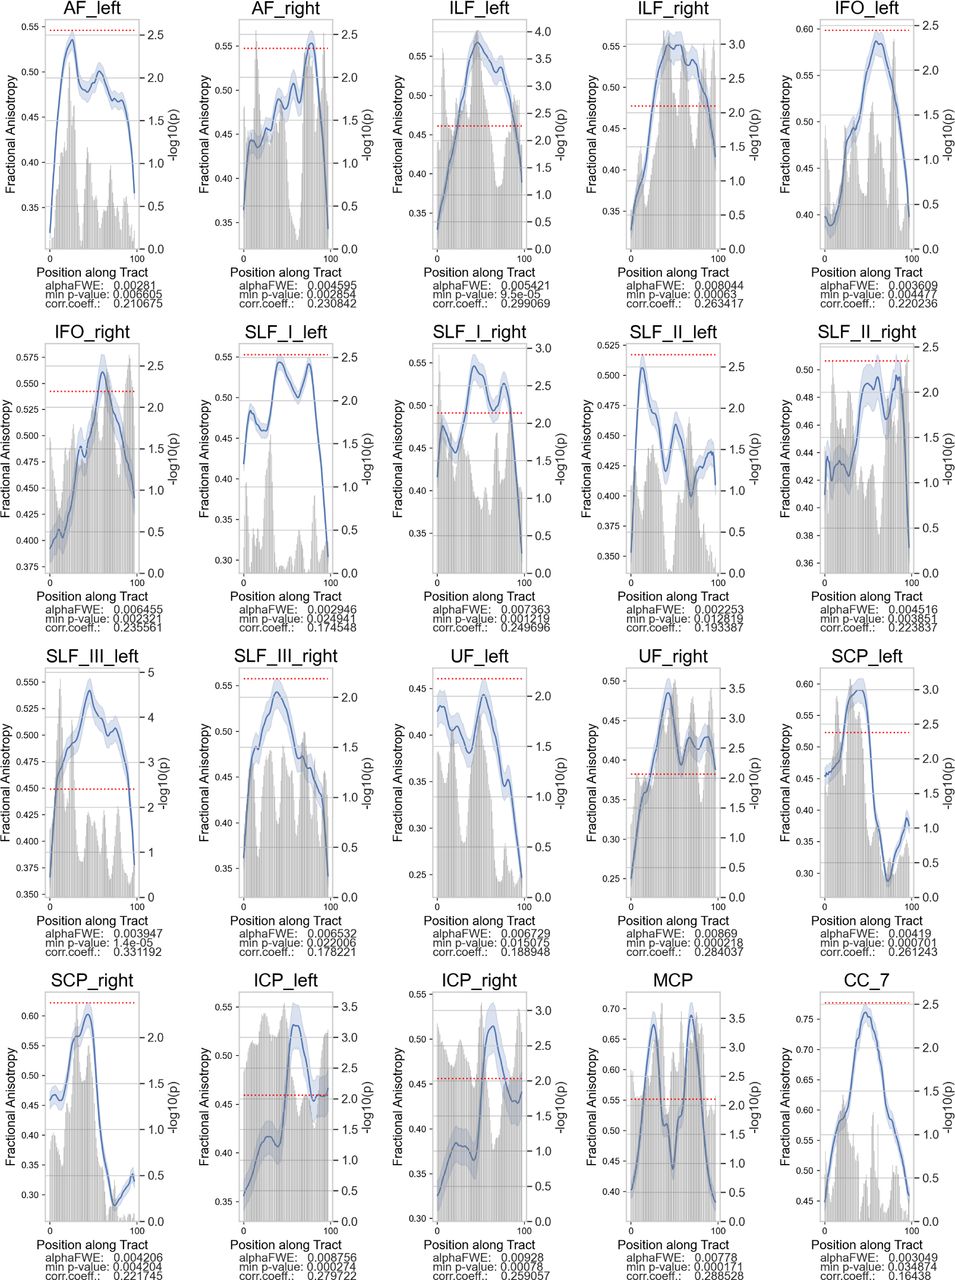
We correlated tract FA in each node with the participants’ standardized TOWRE composite scores (Table 2). Among the Low-TOWRE group, significant positive correlations were present in all 20 tracts besides the left IFO and SLF II, which both had trends towards significance (Figures 3, S1). In the High-TOWRE group, only a single negative correlation between right ILF FA and TOWRE scores reached significance (Figure 4). Positive correlation prevalence was lower among the RD group compared to the Low-TOWRE group, as no nodes in the splenium, right UF, right IFO, or any cerebellar peduncle reached significance (Figure 5). In the TR group, unlike in the High-TOWRE group, a few tracts, including bilateral AF and right SLF I and II, had significant positive associations with reading aptitude, while no tract’s FA negatively correlated with TOWRE scores (Figure 6). Across the entire cohort, fewer tracts’ FA values were significantly positively related to reading skills compared to within either the RD or Low-TOWRE group alone (Figure S2).

Several tracts exhibited significant positive FA correlations with reading ability (TOWRE composite score) among the Low-TOWRE group. Plotting convention is the same as Figure 2.

Only the right ILF exhibited a negative correlation with TOWRE composite scores among the High-TOWRE group. Plotting convention is the same as the previous figure.

Several tracts exhibited significant positive FA associations with TOWRE composite scores among the RD group. Plotting convention is the same as the previous figure.

Only a few tracts exhibited significant positive FA associations with TOWRE composite scores among the TR group. Plotting convention is the same as the previous figure.
A summary of results across the group difference and correlation analyses. LT and HT are used to abbreviate the Low and High-TOWRE groups, respectively. A “+” or “-” sign denotes a significant positive or negative association between FA and reading scores, respectively.
We repeated the same analyses but instead correlated against the SWE and PDE TOWRE subscores (Figures S3-S12; Table 2) to probe whether there were similar or dissimilar relations between white matter and performance with words (SWE) versus pseudowords (PDE). Of note, more tracts’ FA positively correlated with PDE scores across all subjects, compared to associations with SWE or TOWRE composite scores. In addition, more fiber bundles exhibited negative correlations with SWE scores among the High-TOWRE group compared to associations with other reading scores in other reading groups.
3.3 Group Differences in FA
We looked for differences in FA between the RD and TR groups and between the Low-TOWRE and High-TOWRE groups (Table 2). The right AF, IFO, and SLF I and II exhibited significantly greater FA for the High-TOWRE group than the Low-TOWRE group (Figures 7, S13). Four tracts, the left AF and all three SLF components, showed significantly higher FA in the RD group than the TR group (Figures 8, S13).

The FA of the right AF, SLF, and IFO was greater in the High-TOWRE group compared to the Low-TOWRE group. Each plot represents a different fiber bundle. The blue line represents the average FA in the High-TOWRE group, and the orange curve is the average FA in the Low-TOWRE group. Both lines have age, sex, and handedness regressed out. The shaded regions surrounding the lines are the 95% confidence intervals. Below each plot, the FWE-adjusted α (given an original α = 0.05) is listed, along with the largest t-statistic (positive indicates High-TOWRE > Low-TOWRE) achieved in the tract and its associated p-value. The gray bars and dotted red lines retain their meanings from previous figures.

The FA of the left AF and SLF was greater in the RD group compared to the TR group. Each plot represents a different fiber bundle. The blue line represents the average FA in the TR group, and the orange curve is the average FA in the RD group. Both lines have age, sex, and handedness regressed out. The shaded regions surrounding the lines are the 95% confidence intervals. Below each plot, the FWE-adjusted α (given an original α = 0.05) is listed, along with the largest t-statistic (positive indicates TR > RD) achieved in the tract and its associated p-value. The gray bars and dotted red lines retain their meanings from previous figures.
4 Discussion
This study is the first large-scale investigation of tractometry-derived white matter microstructural associations with single-word reading abilities across a diverse child participant cohort. The size of our participant cohort is large relative to other DTI studies, particularly those relating to reading aptitude. We used high-quality publicly available data and state-of-the-art analytical methods, showcasing the rapid advances in diffusion acquisition and processing techniques. Because clinical diagnoses of reading disabilities are somewhat subjective and reading thresholds in cutoff-based approaches are set somewhat arbitrarily, we examined both of these two methods of delineating poor and typical readers separately. In general, more associations between higher FA and better reading skills were present in poorer readers, regardless of how they were defined. There were very few correlations between FA and reading skills in the more proficient reading groups, and among them were associations between lower FA and higher reading skills. The reading disability (RD) group exhibited higher FA than the typical reading (TR) group in left-hemisphere tracts often associated with reading, including the left arcuate fasciculus (AF) and the left superior longitudinal fasciculus (SLF). Conversely, when children were divided into groups based on reading skills alone (TOWRE scores), children with better reading skills (High-TOWRE), relative to children with worse reading skills (Low-TOWRE), exhibited higher FA in multiple right-hemisphere tracts.
We found significant correlations between higher FA and age in all tracts. Our study is the largest investigation of linear white matter development patterns to date (for a review, see Lebel et al. [2019]; for a similarly-sized group-based analysis, see Chiang et al. [2011]). Our findings are consistent with prior reports of linear FA-age relationships during child development [Barnea-Goraly et al., 2005, Bonekamp et al., 2007, Muetzel et al., 2008, Mukherjee et al., 2002, Schmithorst et al., 2002], although more recent studies suggest an exponential trajectory [Lebel et al., 2008, Tamnes et al., 2010, Taki et al., 2013, Simmonds et al., 2014] which we did not evaluate in this study. The consistency of our developmental findings of widespread growth of FA with age with prior studies also confirms the quality of the DTI acquisition and the validity of our analytic method.
This is the first study of reading skills that has used TractSeg, which has been shown to outperform several popular white matter segmentation methods [Wasserthal et al., 2018a]. Newer tract-based approaches, as employed here, represent a paradigm shift from several earlier DTI studies. Many previous papers of FA-reading relationships, particularly before the publication of Vandermosten and colleagues’ review of DTI applications to reading [Vandermosten et al., 2012b], performed whole-brain voxel-based analyses (VBA). VBA sensitivity suffers from stricter multiple-comparison correction across the entire brain. In addition, VBA methods tend to be less precise due to their being run on a group-averaged image because the shape of long-range fiber bundles varies among people [Wassermann et al., 2011, Yeatman et al., 2011]. Spatial smoothing and affine transformation to MNI before group analysis in VBA, as opposed to the rigid alignment employed in this study to ensure orientation homogeneity, may obfuscate unique properties of a participant’s anatomy [Christensen et al., 1997]. Significant findings from VBA are not always assigned to tracts. In fact, a single voxel may contain multiple fiber bundles, so it is possible early studies may have incorrectly ascribed significant voxels to fiber bundles due to not also considering the primary diffusion directionality in these areas. Tract-Based Spatial Statistics (TBSS, [Smith et al., 2006]), a popular method that improves upon traditional VBA by restraining analyses to a skeletonized white matter voxel map, also suffers in tract localization [Tsang et al., 2010]. Methodological delves into TBSS have revealed bias in the FA map used for spatial normalization, sensitivity to pathologies and noise that affect brain anatomy, incorrect voxel-to-tract assignments [Bach et al., 2014], and instability dependent on tensor-fitting methods [Maximov et al., 2015]. VBA tends to depend on FA to determine tissue class (e.g., white vs gray matter). FA is prone to underestimation and noise in voxels that contain both gray and white matter or crossing fibers [Oouchi et al., 2007], which would especially confound segmentation of the corpus callosum. In contrast, tracking with CSD methods first, as employed here, resolves crossing fibers better [Tournier et al., 2008]. VBA can still be valuable as a data exploratory tool, but tract-based methods likely provide for superior sensitivity and reduced ambiguity of fiber bundle localization (for a review, see Ramus et al. [2018]). These benefits have already been observed in multiple clinical populations [Wasserthal et al., 2020, Kamagata et al., 2013, Kuchling et al., 2018].
With these limitations in mind, it may not be surprising that tract-based methods have yielded occasionally opposing findings to voxel-based methods. For example, in the left AF, observations of lower FA being associated with higher reading scores came from tract-based methods [Yeatman et al., 2012a, Christodoulou et al., 2017, Huber et al., 2018], as did findings of higher FA in dyslexia compared to controls [Žarić et al., 2018]. This could reflect increased anatomical specificity and/or mitigated partial volume effects. However, tractography applications to reading are still in their infancy, and different tractography measures may provide different insights. For example, CSD methods are better at resolving fiber bundles that pure DTI methods have difficulty with, such as the right AF [Yeatman et al., 2011, Catani et al., 2007, Zhao et al., 2016]. The field may best be served by harmonizing diffusion acquisition and analysis protocols [Cieslak et al., 2021, Schilling et al., 2021, Ramus et al., 2018], particularly scanning with multiple shells at high b-values (at least b = 1300) to optimally use CSD.
There is debate surrounding whether dyslexia can properly be described as a neurodevelopmental difference. Population reading skills tend to follow a normal distribution, even when including those with developmental dyslexia (Figure 1).
One may argue that dyslexia is not a brain difference, but rather a way to group those on the lower end of the reading skills distribution (or bell curve). From this perspective, both reading differences and associated brain differences should lie along a continuum [Protopapas and Parrila, 2018, 2019]. Findings that would most strongly align with this view would be if reading-FA correlations were positively correlated across the entire participant cohort. However, that was rarely the case (Table 2), with the most obvious difference being the near-ubiquitous positive reading-FA associations in the Low-TOWRE groups (Figure 3) and non-significant correlations in the High-TOWRE group (Figure 4). While we cannot draw any causal conclusions, our results suggest a different relation between white matter structural properties and reading skills in children with lower reading ability versus those with typical reading skills.
This stark difference in FA-reading associations between proficiency groups may also be the result of extensive reading experience (or training), in and out of school, and additionally intervention experiences for children with reading difficulty. Training in a given skill, such as reading, can lead to an initial increase in FA in putative white matter regions, followed by a decline when reaching proficiency [Scholz et al., 2009]. Such trends have been observed in mathematical abilities in dyslexia [Koerte et al., 2016], musicianship [Schmithorst and Wilke, 2002], and dance [Hänggi et al., 2010]. This could explain why we observed near-ubiquitous positive associations between FA and reading abilities in the Low-TOWRE group (who are not proficient), but not in the High-TOWRE group (who are proficient).
There has also been some evidence that poor readers utilize right-hemisphere pathways to compensate for limitations of the left-hemisphere pathways that are typically most associated with single-word reading. Several studies have reported enhanced right-hemisphere brain activation in individuals with dyslexia while reading, which has been interpreted as a compensatory mechanism [Hoeft et al., 2011, Milne et al., 2002, Temple et al., 2003, Waldie et al., 2013]. In the Low-TOWRE group, every right-sided tract we analyzed contained significant positive FA correlations with better reading skill. Right-hemisphere pathway recruitment during reading training in low proficiency readers may reflect this continuing training towards single-word reading proficiency.
The present findings are surprising in several ways, especially given the exceptional statistical power of the present sample. First, it is noteworthy that there were so few associations between white-matter microstructure and single-word reading proficiency among the 584 typically reading children. The use of age-standardized reading scores controlled for simple age-related gains in reading, but there was little relation between reading ability and white-matter pathways. Second, the finding that children classified as having a reading disability had greater FA in left-hemisphere pathways associated with reading (left AF and SLF) differs from a frequent focus in dyslexia research on reduced FA in left-hemisphere tracts connecting the major occipito-temporal, temporal-parietal, and frontal nodes of the reading network.
Reduced FA in these tracts has been observed in both children and adults with dyslexia [Klingberg et al., 2000, Richards et al., 2008, Steinbrink et al., 2008, Carter et al., 2009, Christodoulou et al., 2017, Su et al., 2018, Žarić et al., 2018], children with reduced pre-reading language skills [Saygin et al., 2013], and even infants from families with a history of dyslexia [Langer et al., 2017]. In contrast, multiple other studies have either failed to find this difference or had the opposite findings of increased FA in the left-hemisphere tracts [Arrington et al., 2017, Žarić et al., 2018]. Indeed, a meta-analysis concluded that there were no reliable findings relating either reading skill as a continuous ability or comparing groups with versus without dyslexia to variation in white-matter microstructure [Moreau et al., 2018].
The results of this study should be interpreted in the context of some limitations. First, the composition of the participant cohort is unique in that most participants in the Healthy Brain Network have at least one psychological, neurodevelopmental, or learning disorder [Alexander et al., 2017]. Incentives for participating in the study included a cash reward as well as a free behavioral examination, and advertisements were targeted towards parents who may have been concerned about their child’s psychological state. The proportion of Low-TOWRE and RD participants in the cohort were approximately 24% and 15% respectively. Both of these figures exceed estimates of dyslexia prevalences which tend to range from 5-10% [Roongpraiwan et al., 2002]. Secondly, we used FA as our tract metric of interest since it has largely been interpreted as a measure of tract integrity. That is, a higher FA may relate to more myelination, which in turn may increase synaptic efficiency [Lebel and Deoni, 2018]. While myelination certainly modulates FA, other factors such as axonal diameter, density, and coherence also influence it [Shemesh, 2018, Friedrich et al., 2020, Beaulieu, 2009]. The dueling mechanisms underlying FA may confound results, as both axonal pruning and increased myelination may relate to positive brain development but have opposing effects on FA [Yeatman et al., 2012a]. Analysis of T1 relaxation time in tracts using quantitative MRI may better quantify the degree of myelination per se [Lutti et al., 2014, Schurr et al., 2018]. The tract-based approach employed here, in which FA is sampled at several points across the length of the tract, allows researchers to report group differences that may be localized to certain portions of a tract, even if the mean FA does not differ between groups. However, it is unclear if these localized differences are a result of true structural differences in a given tract, or more global structural differences such as inhomogeneities in the location of a crossing fiber [Ramus et al., 2018]. While our results lend themselves to theories of the etiology of dyslexia, we cannot interpret our findings to make causal statements of white matter microstructural properties’ connection to reading disabilities. Longitudinal interventional studies should continue to be performed to better understand this relationship. Finally, multivariate pattern analysis could shed insight into the relative contributions of different tract microstructural properties to classifying reading aptitude, similar to what was done in the study by Cui et al. [2016].
In several ways, this study of the relation between white-matter microstructure and single-word reading ability had features that ought to have yielded conclusive findings, but the study raises some open questions. The number of participants was exceptionally large, the TOWRE is a widely used and well-established measure of single-word reading ability, and the analyses took advantage of progress in DTI analytic methods. Children could be categorized by clinical criteria for reading disability or by TOWRE performance, and analyses could be conducted between groups or continuously within groups. There were a number of findings that aligned with some but not other previous findings. Only future research can resolve the apparent contradictions among findings, but one possibility is that there is greater diversity among poor readers than has been heretofore imagined, perhaps combined with developmental variation from infancy to beginning readers to more advanced readers.
CRediT Authorship Contributions
Steven L. Meisler: Conceptualization, Formal analysis, Investigation, Methodology, Software, Visualization, Data Curation, Writing - original draft, Writing - review & editing. John D.E. Gabrieli: Conceptualization, Supervision, Writing - original draft, Writing - review & editing.
Funding
This work was funded by the National Institutes of Health (grant numbers 5T32DC000038-28 and 5T32DC000038-29) and the Halis Family Foundation.
Conflicts of Interest
Declarations of interest: none
Supplementary Materials

Anatomical depictions of white matter regions whose FA correlated with TOWRE composite scores in the Low-TOWRE group. Red coloring denotes regions of significant positive correlation. The left IFO and SLF III had no significantly correlated regions.
Few tracts exhibited significant FA correlations with TOWRE composite scores across the entire participant cohort. Each plot represents a different fiber bundle. The blue curve represents the average FA after regressing out sex and handedness. The shaded region surrounding the curve is the 95% confidence interval. The red dotted line depicts the critical FWE-adjusted α (given an uncorrected α of 0.05). The gray bars represent the p-value of the correlation at each node, measured on a -log scale. A gray bar extending above the red line (p < αFWE) denotes a significant node. Below each plot, the critical FWE-adjusted α is listed, along with the strongest correlation achieved in the tract and its associated p-value.

Several fiber bundles exhibited significant FA correlations with TOWRE SWE scores among the Low-TOWRE group. Plotting convention is the same as in the previous figure.

Multiple tracts exhibited significant negative FA correlations with TOWRE SWE scores among the High-TOWRE group. Plotting convention is the same as in the previous figure.

Several fiber bundles exhibited significant FA correlations with TOWRE SWE scores among the RD group. Plotting convention is the same as in the previous figure.

Only the FA of right SLF I was positively associated with TOWRE SWE scores among the TR group. Plotting convention is the same as in the previous figure.

Only the right AF and SLF I FA values were positively associated with TOWRE SWE scores across the entire cohort. Plotting convention is the same as in the previous figure.

Several fiber bundles exhibited significant FA correlations with TOWRE PDE scores among the Low-TOWRE group. Plotting convention is the same as in the previous figure.

Only bilateral ICP displayed significant FA correlations with TOWRE PDE scores among the High-TOWRE group. Plotting convention is the same as in the previous figure.

Several fiber bundles exhibited significant FA correlations with TOWRE PDE scores among the RD group. Plotting convention is the same as in the previous figure.

Several fiber bundles exhibited significant FA correlations with TOWRE PDE scores among the TR group. Plotting convention is the same as in the previous figure.

Several fiber bundles exhibited significant FA correlations with TOWRE PDE scores across the entire participant cohort. Plotting convention is the same as in the previous figure.

Anatomical depictions of white matter regions where group differences in FA existed between the Low and High-TOWRE groups and between the RD and TR groups.
Acknowledgements
We thank the Healthy Brain Network team for their diligence in collecting the data and generosity in sharing it. We thank all of the participants and their families for volunteering their time to participate in the study. Finally, we thank Amanda O’Brien for proofreading the manuscript.
References
- 1.↵
- 2.↵
- 3.↵
- 4.↵
- 5.↵
- 6.
- 7.↵
- 8.↵
- 9.↵
- 10.↵
- 11.↵
- 12.↵
- 13.↵
- 14.↵
- 15.↵
- 16.↵
- 17.↵
- 18.↵
- 19.↵
- 20.↵
- 21.↵
- 22.↵
- 23.↵
- 24.↵
- 25.↵
- 26.↵
- 27.↵
- 28.↵
- 29.↵
- 30.↵
- 31.↵
- 32.↵
- 33.↵
- 34.↵
- 35.↵
- 36.↵
- 37.↵
- 38.↵
- 39.↵
- 40.↵
- 41.↵
- 42.↵
- 43.↵
- 44.↵
- 45.↵
- 46.↵
- 47.↵
- 48.↵
- 49.↵
- 50.↵
- 51.↵
- 52.↵
- 53.↵
- 54.↵
- 55.↵
- 56.↵
- 57.↵
- 58.↵
- 59.↵
- 60.↵
- 61.↵
- 62.↵
- 63.↵
- 64.↵
- 65.↵
- 66.↵
- 67.
- 68.↵
- 69.↵
- 70.↵
- 71.↵
- 72.↵
- 73.
- 74.↵
- 75.↵
- 76.↵
- 77.↵
- 78.↵
- 79.↵
- 80.↵
- 81.↵
- 82.↵
- 83.↵
- 84.↵
- 85.↵
- 86.↵
- 87.↵
- 88.↵
- 89.↵
- 90.↵
- 91.↵
- 92.↵
- 93.↵
- 94.↵
- 95.↵
- 96.↵
- 97.↵
- 98.↵
- 99.↵
- 100.↵
- 101.↵
- 102.↵
- 103.↵
- 104.↵
- 105.↵
- 106.↵
- 107.↵
- 108.↵
- 109.↵
- 110.↵
- 111.↵
- 112.↵
- 113.↵
- 114.↵
- 115.↵
- 116.↵
- 117.↵
- 118.↵
- 119.↵
- 120.↵
- 121.↵
- 122.↵
- 123.↵
- 124.↵
- 125.↵
- 126.↵
- 127.↵
- 128.↵
- 129.↵
- 130.↵
- 131.↵
- 132.↵
- 133.↵
- 134.↵
- 135.↵
- 136.↵
- 137.↵
- 138.
- 139.↵


