

ABSTRACT
The locus and extent of brain damage in the event of vascular insult can be quantitatively established quickly and easily with vascular atlases. Although highly anticipated by clinicians and clinical researchers, no digital MRI arterial atlas is readily available for automated data analyses. We created a digital arterial territory atlas based on lesion distributions in 1,298 patients with acute stroke. The lesions were manually traced in the diffusion-weighted MRIs, binary stroke masks were mapped to a common space, probability maps of lesions were generated and the boundaries for each arterial territory was defined based on the ratio between probabilistic maps. The atlas contains the definition of four major supra- and infra-tentorial arterial territories: Anterior, Middle, Posterior Cerebral Arteries and Vertebro-Basilar, and sub-territories (thalamoperforating, lenticulostriate, basilar and cerebellar arterial territories), in two hierarchical levels. This study provides the first publicly-available, digital, 3D deformable atlas of arterial brain territories, which may serve as a valuable resource for large-scale, reproducible processing and analysis of brain MRIs of patients with stroke and other conditions.
BACKGROUND AND SUMMARY
Vascular atlases provide means to quickly establish the locus and extension of brain damage in the event of vascular insult 15, can assist in stroke treatment planning and determining recovery prognosis 2,3, and can be used to inform future clinical trials of relevant scores (e.g., ASPECTS 4). Research-wise, atlas-based analysis increases the statistical power and greatly improves the feasibility and reproducibility of lesion-based studies that usually require large scale data. Prior to the advent and use of modern neuroimaging techniques, vascular atlases were derived mainly from post-mortem injection studies 6-8 and depicted schematic representations of the vascular territories. Such studies typically included single cases or very small samples, and thus, these atlases did not account for the high inter-individual variability in vascular distributions. Two -dimensional, manually-drawn atlases 9-13 also suffer from a lack of flexibility; if the template slices provided in the atlas do not match the slice thickness or orientation of acquired clinical neuroimages, the atlas utility is diminished 7,10,14-16. Even with well-aligned slices, printed templates lack precision and do not allow for quantitative assessment of vascular territories in a single patient.
Contemporary, digital atlases often derived from in vivo perfusion studies in healthy individuals 16-18 or analysis of stroke lesions 14,15,19-21 overcome the aforementioned limitations and can provide a fast and objective measure of vascular damage in individual patients. In particular, digital atlases that incorporate data from a large number of stroke patients are likely most representative of the vascular anatomy of older adults who are most likely to experience infarct. Recently, Kim et al. 20 used a large dataset of stroke patients from academic centers in Korea to map supratentorial cerebral arterial territories. Despite its strengths, infratentorial and deep perforating arterial territories were not defined, even though approximately 20% of all strokes occur in both the infratentorial 26 and deep perforating arterial zones 27. Furthermore, a publicly accessible electronic version of the atlas is not available, thus reducing applicability. Wang et al. 28 later used MRIs of 458 patients to create a “stroke atlas” using voxel-wise data-driven hierarchical density clustering. Although this atlas represents major and end-arterial supply territories, the difficulties in accessing the stability of small clusters and the lack of unitary-defined boundaries reduces applicability for individual brain mapping.
To remedy the limitations of existing vascular atlases, we created a novel whole-brain arterial territory atlas based on lesion distributions in 1,298 patients with acute stroke. Our atlas covers supra- and infra-tentorial regions, includes straightforward and robustly-defined watershed border zones, and contains hierarchical segmentation levels created by a fusion of vascular and classical anatomical criteria. The atlas was developed using diffusion weighted MRIs (DWIs) of patients with acute and early subacute ischemic strokes, expert annotation (lesion delineation), and metadata (radiological evaluation) of a large and heterogeneous sample, both in biological terms (e.g.., lesion pattern, population phenotypes) and technical terms (e.g., differences in MRI protocols and scanners). The biological and technical heterogeneity of the sample is advantageous in that it increases the generalization and robustness of the atlas, and consequently its utility. This first publicly-available, digital, 3D deformable atlas can be readily used by the clinical and research communities, enabling to explore large-scale data automatically and with high levels of reproducibility.
METHODS
Cohort
This study included Magnetic Resonance Images (MRIs) of patients admitted to the Johns Hopkins Stroke Center with the clinical diagnosis of acute stroke, between 2009 and 2019. Baseline MRIs adequate for clinical analysis and evidence of ischemic stroke in DWI were included. From the 1,878 patients identified under these criteria, 580 individuals were excluded because their stroke lesion was 1) characteristic of embolic etiology, 2) bilateral, 3) multifocal / involving more than one major arterial territory, 4) exclusively within “watershed” areas, and/or 5) hemorrhagic. Ultimately, 1,298 MRIs were included with acute or early subacute ischemic strokes affecting exclusively one major arterial territory (anterior, middle, and posterior cerebral, or vertebro-basilar arteries).
The characteristics of the cohort are summarized in Table 1. The distribution of strokes according to arterial territories (MCA > PCA > VB > ACA) and the demographic and clinical characteristics reflect the general population of stroke patients. We note that our population includes a higher percentage of Black, and lower percentage of Hispanic/Latinx and Asian patients than many urban stroke centers, therefore a regional bias may exist. The vast majority of scans were performed more than 2 hours after the onset of symptoms, reducing the odds of significant further change in the lesion volume 25.
Demographic and clinical characteristics of the cohort, and imaging and lesion characteristics.
Image analysis
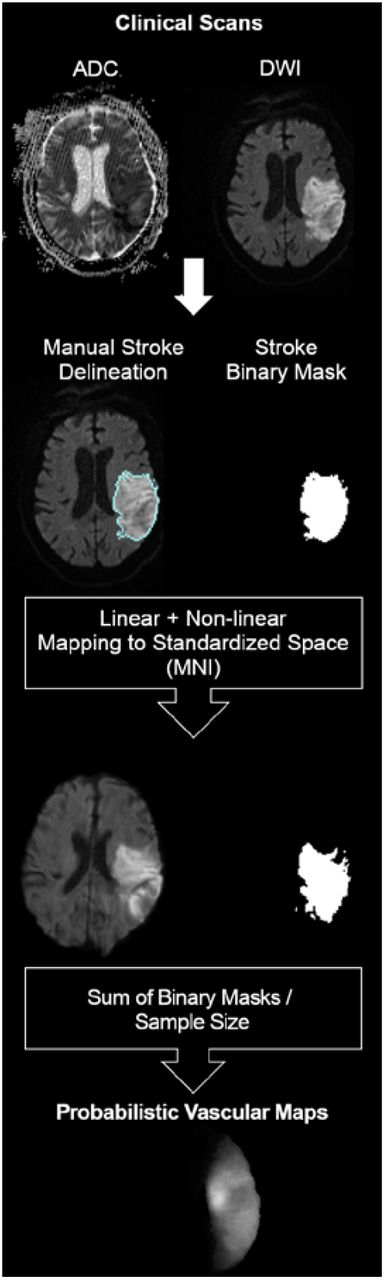
MRIs were obtained on seven scanners from four different vendors, in different magnetic fields, with dozens of protocols. The DWIs had high in plane (axial) resolution (1×1mm, or less), and typical clinical large slice thickness (ranging from 3 to 6 mm). The delineation of the stroke core was defined in the DWI by 2 experienced evaluators and revised by a neuroradiologist until reaching a final decision by consensus. Details are described in Technical Validation. The binary stroke masks (ischemic lesion = 1; brain and background = 0) were then used to create probabilistic maps, as shown in Figure 1.

Creating probabilistic maps and atlases requires transforming images to a common space for consistency among image coordinates and biological structures. Clinical stroke images offer three additional challenges to image mapping: 1) the typical high slice thickness, often associated with large rotations out-of-plane, 2) the presence of drastic changes in image morphology and intensity, caused by the stroke as well as associated chronic conditions (e.g., white matter microvascular chronic lesions), and 3) the variable and often remarkable degree of brain atrophy in elderly participants who primarily constitute the stroke population. As linear deformations are not enough to accurately map internal brain shapes, and high elastic transformations (e.g., diffeomorphic) are very sensitive to focal abnormalities in morphology and contrast, we applied sequential steps of linear and non-linear deformation, using Broccoli 22. To minimize the effects of the acute stroke, we used the “B0” images (less affected by the acute lesion intensity) for mapping. As a template, we used the JHU_SS_MNI_B0 23, a subject in standard MNI coordinates. The optimization of the parameters and other details of the image mapping are described in the Technical Validation.
Probabilistic maps
The cohort was divided into four groups based on the major arterial territory that was exclusively affected in each patient, according to radiological classification: 1) Anterior Cerebral Artery (ACA), 2) Middle Cerebral Artery (MCA), 3) Posterior Cerebral Artery (PCA), or 4) Vertebro -Basilar artery (VB). The MCA infarcts affected the lateral lenticulostriate territory, or the “lobar” (cortex and adjacent subcortical white matter) MCA territory, or both; the PCA infarcts affected the posterior and anterior thalamoperforating territory, or the “lobar” PCA territory, or a combination of both; the ACA infarcts affected the medial lenticulostriate territory, or the “lobar” ACA territory, or both; the VB infarcts affected the inferior or superior cerebellar areas, or the basilar territory, or a combination of both.
Probabilistic maps were generated by summing the stroke binary mask in the common space and dividing by the sample size for each of these territories. Each subject has an annotated pair (si, Xi), where si is the group label, si ∈ {ACA, MCA, PCA, VB}, and Xi is the stroke mask. Then, we can define the probabilistic map for MCA region as following,
 , where NMCA is the sample size in the MCA group. Similarly, we compute pACA, pPCA, and pVB. These probabilistic maps can be considered as an estimate for the likelihood of voxels belonging to a certain territory. The more samples in a group, the more accurate the estimate is. For the “border zone” between the major cerebral arteries (ACA, MCA, PCA), we considered each voxel that had a probability greater than zero to belong to two arterial territories. By dividing the probabilities, we estimated the likelihood that voxels in the border zone belong to one or another major arterial territory. For example, a ratio of pMCA/pPCA > 1 indicates that the given “border zone” voxel is more often affected in MCA strokes than in PCA strokes while pMCA/pPCA <1 indicates the opposite. We acknowledge the sample imbalance (the ACA group is smaller than the others) as a possible bias for the conditional probability ratio. Yet, because this imbalance reflects the regular distribution of strokes, and given the lack of adequate means to measure the possible bias, we adopted the simplest estimation.
Definition of arterial territories
Our ultimate goal was to create a 3D deformable atlas of the major arterial territories, which requires sharp boundaries between neighbor regions. After adding the major probabilistic maps (ACA, MCA, PCA, VB), the vast majority of voxels belonged to an exclusive vascular territory and were attributed an integer intensity that identified that territory. When a voxel belonged to more than one vascular territory (which occurred in the border zone) it was attributed to the territory with the highest probability. The resulting atlas had a relatively coarse contour and was smoothed by a kernel filter followed by manual editing by an expert neuroradiologist. The manual adjusts were “cosmetic” (no more than 3 voxels, in plane, at 1×1×1 mm resolution).
The same procedure was applied to define the sub-territories of lateral lenticulostriate (within MCA), thalamoperforating (within PCA), and anterior and posterior cerebellar and basilar (within VB) arteries. The “lobar” sub-areas of MCA (frontal, parietal, temporal, insular, occipital) and PCA (occipital, temporal), were defined based on classic anatomical landmarks (gyri, as defined in our previous atlas 24). In less stroke-prone territories, such as medial lenticulostriate and anterior thalamopeforating (that have less than 10 cases of exclusive strokes each), the probabilistic maps would be less reliable as they derive from small samples. For those territories, we chose to rely on anatomical knowledge derived from prior studies; future studies can refine the boundaries using probabilistic maps once we accumulate additional cases. The medial lenticulostriate territory, within ACA, corresponds to the topography of corpus callosum. The anterior thalamoperforating territory, within PCA, corresponds to the topography of the mesial temporal area and hippocampus. As a result, we created a hierarchical (2-level) brain atlas of arterial territories (Figure 2).

3D reconstruction of the arterial atlas. The right columns represent the major vascular territories; the left columns show subdivisions of biological importance, based on probabilistic maps and / or anatomical landmarks.
Arterial Atlas
Figure 3A shows the probabilistic maps of the four major arterial territories overlaid in the template. Figures 3B-D show the probabilistic maps of strokes in “sublevels” of MCA (lateral lenticulostriates, Fig 3B), PCA (posterior thalamoperforating, Fig 3C), and VB (anterior and posterior cerebellar, and basilar; Fig 3D). The sample size employed for each probabilistic map is summarized in Venn Diagrams in Table 1. Figure 3E shows the border zone between the MCA -PCA and the MCA-ACA territories, represented by the ratio between the probabilistic maps. Values higher than 1 indicate that the given “border zone” voxel is more often affected by MCA strokes than by PCA or ACA strokes.

A) Probabilistic maps of the four major arterial territories: anterior cerebral artery (ACA), medium cerebral artery (MCA), posterior cerebral artery (PCA), and vertebra -basilar (VB). C-D) Probabilistic maps of strokes in “sublevels” of the major territories, with lesion affecting: C) the territories of lateral lenticulostriate arteries exclusively, or the “lobar” (cortex and adjacent white matter) MCA; D) the territories of posterior thalamoperforating arteries exclusively, or the “lobar” (cortex and adjacent white matter) PCA; D) the vertebro-basilar territory, composed of the anterior cerebellar, posterior cerebellar and basilar arteries. Color scales for each territory indicate the frequency of lesions. E) Border zone between MCA-PCA (blue-green) and MCA-ACA (red-yellow). The color intensity represents the ratio between the respective probabilistic maps. Values higher than 1 indicate that the given “border zone” voxel is more often affected by MCA strokes than by PCA or ACA strokes.
Figure 4 is the 2D version of Figure 2 and shows our arterial territory atlas overlaid in T1 -weighted axial slices of a brain in standardized MNI space. The bottom row shows the major arterial territories (ACA, MCA, PCA, VB) and is the result of the combination of the respective probabilistic maps (Figure 3A) followed by categorical definition of the border zones plus smoothing and manual cosmetic editing. The top row represents the sublevels defined in the major territories by probabilistic maps (lateral lenticulostriate, posterior thalamoperforating, anterior and posterior cerebellar, and basilar strokes; as in Figures 3B-D) or by prior knowledge of structural anatomy (medial lenticulostriate, anterior thalamoperforating, and “lobar” segments).

Digital arterial atlas overlaid on axial T1WIs of the template in standardized space (MNI). At the bottom, the major arterial territories: anterior (ACA), middle (MCA), and posterior (PCA) cerebral arteries, and vertebro-basilar (VB). At the top, sub segments of ACA (frontal (ACAf) and medial lenticulostriate (medLS)), MCA (frontal (MCAf), parietal (MCAp), temporal (MCAt), occipital (MCAo), insula (MCAi) and lateral lenticulostriate (latLS)), PCA (temporal (PCAt), occipital (PCAo), Posterior Choroidal and Thalamoperforating (postChThp), Anterior Choroidal and Thalamoperforating (antChThp)), and VB (inferior cerebellar (IC), superior cerebellar (SC), and basilar). See 3D reconstruction in Figure 2
DATA RECORDS
The atlas of the arterial territories is available in NITRC (https://www.nitrc.org/projects/arterialatlas). Any questions, concerns, or comments related to the atlas are welcome and can be publicly reported, so users are aware and we can resolve any issues in a timely manner. The images are in Montreal Neurological Institute (MNI) coordinates and the data format is “Nifti”, as recommended by the Brain Imaging Data Structure (BIDS). The description of the files is as follows:
– ArterialAtlas.nii: Image defining 30 arterial territories and ventricles. The intensities of the parcels correspond to their labels IDs, listed in the lookup table “ArterialAtlasLabels.txt”, that accompanies the documentation. If visualized in 3D, the ArterialAtlas.nii corresponds to the left of Figure 2 of this paper; if visualized in 2D over an anatomical slide, it corresponds the top row of Figure 4.
– ArterialAtlas_level2.nii: The combination of ArterialAtlas.nii parcels in 4 major territories (ACA, MCA, PCA, VB). Again, the intensities of the parcels correspond to their labels, listed in the ArterialAtlasLabels.txt. If visualized in 3D, the ArterialAtlas_level2.nii corresponds to right column of Figure 2 of this paper; if visualized in 2D over an anatomical slide, it corresponds the bottom row of Figure 4.
– ArterialAtlasLabels.txt: is the “lookup table”. It contains the labels (descriptive and acronyms) for the regions defined in ArterialAtlas.nii and ArterialAtlas_level2.nii. The intensity of the region, in the images, corresponds to the label ID, in the lookup table.
TECHNICAL VALIDATION
Lesion Delineation
Although there is no perfect method for defining the stroke core, we chose to use DWI and Apparent Diffusion Coefficient maps (ADC), based on the fact that DWI is the most informative and most common sequence performed for acute stroke detection. Likewise, prior acute stroke studies and trials have defined lesions in DWI, so our data will be broadly comparable to those investigations. The delineation of the stroke core was defined in the DWI by 2 experienced evaluators and revised by a neuroradiologist until reaching a final decision by consensus. The evaluators looked for hyper intensities in DWI and / or hypo intensities (<30% average brain intensity) in ADC. Additional contrasts were used to rule out chronic lesions or microvascular white matter disease. A “seed growing” tool in ROIEditor (MRIStudio.org) was often used to achieve a broad segmentation, followed by manual adjustments. In a subset of 130 training cases (random selected 10% of cases) traced twice in a two-week interval, the index of agreement, DICE, was 0.76±0.14, inter-evaluator, and 0.8±0.13, intra-evaluator. Although this is a satisfactory level of agreement (Dice values range from 0 to 1; where 1 indicates total agreement), it demonstrates that human segmentation has suboptimal reproducibility, even when performed by experienced, trained evaluators, reinforcing the importance of the consensus agreement and the multiple revisions performed.
Image Mapping
The parameters for the non-linear deformation were chosen to maximize the accuracy on mapping structures such as the ventricles and the brain contour. For the linear registration we used the default setting of the affine transformation in BROCCOLI RegisterTwoVolumes function (https://github.com/wanderine/BROCCOLI/blob/master/code/Bash_Wrapper/RegisterTwoVolumes.cpp). As for the non-linear transformation, there are two important parameters, sigma and iterationsnonlinear (N_iter), to determine the smoothness of the displacement field and the number of iteration steps. To find the optimal sigma and N_iter, we “hyperparameter-searched” all the combinations of sigma in [1,3,5] and N_iter in [10, 15, 20] to register a set of 470 subjects with “not visible” strokes to the template. We evaluated the deformation results for each combination of parameters across all subjects, as follows:
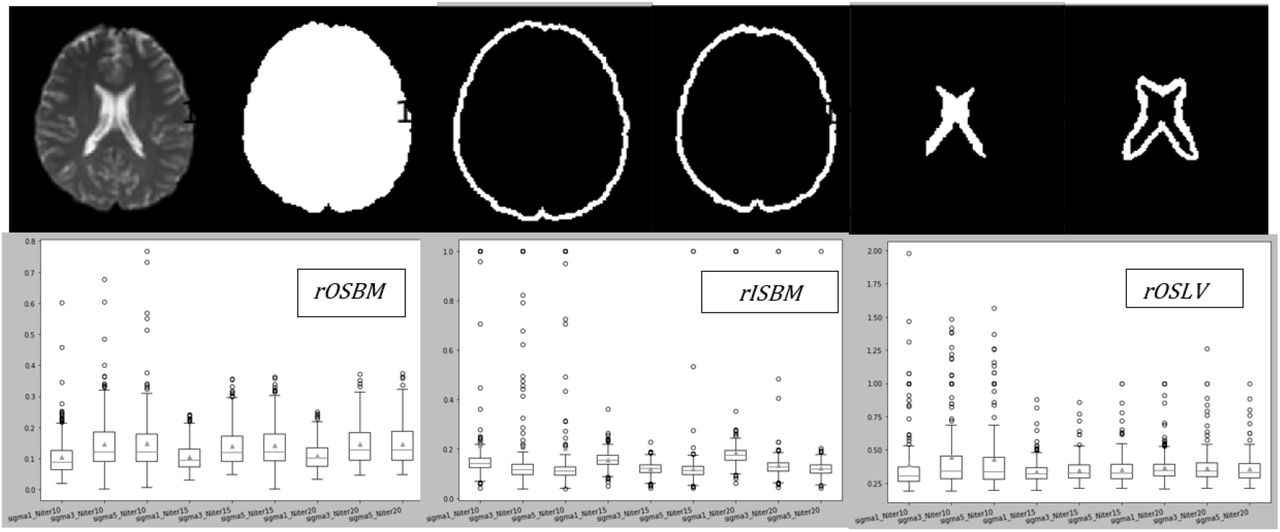
Three regions of 5 voxels bandwidth were defined in the template: the outside strip of the brain mask (OSBM), the inside strip of the brain mask (ISBM), and the outside strip of the lateral ventricles (OSLV), as shown in Figure 5, top.
Figure 5:Optimization of parameters for the non-linear brain deformation. At the top, areas used for optimization, from left to right: the brain template, the brain mask, the outside strip of the brain mask (OSBM), the inside strip of the brain mask (ISBM), the lateral ventricles mask, and the outside strip of the lateral ventricles (OSLV). B) Boxplots of ratios of OSBM, ISBM, and OSLV for all parameter’s combinations tested.
The ratio of the mis-deformed voxels in OSBM, ISBM and OSLV for each subject, defined as rOSBM, rISBM, and rOSLV, was calculated as follows:
 rOSBM indicates the ratio of the deformed B0 voxels aligned outside the template brain mask and rISBM indicates the ratio of the background voxels aligned inside the template brain mask. High rOSBM or rISBM mean the global deformation on B0 boundary is not good enough. rOSLV indicates the ratio of voxels from a subject’s deformed ventricles that exist outside the template lateral ventricle boundaries. High rOSLV is common in this population since aged subjects’ lateral ventricles are usually larger than the template’s lateral ventricles and indicated the need for local deformation. Figure 5, bottom, shows the statistics of rOSBM, rISBM, and rOSLV for all parameter’s combinations tested.
The optimal parameters were sigma=3 and N_iter=15. The registration with these parameters achieved better global deformation around the brain mask and comparable (to sigma=1 and N_iter=15) local deformation around the lateral ventricles.

Visual quality control followed parameter optimization. The deformation matrix of each image was then applied to the respective stroke mask using near neighbor interpolation to preserve the binary nature. Images of patients with strokes in the right hemisphere were flipped along the x -axis so that all the stroke masks were considered in the left hemisphere in the standard space.


