

Abstract
Schwannomas are common sporadic nervous system tumors and diagnostic features of familial neurofibromatosis type 2 (NF2) that develop predominantly on cranial and spinal nerves and cause severe neurological deficits and significant morbidity. Virtually all schwannomas result from inactivation of the NF2 tumor suppressor gene with few, if any, cooperating mutations. Despite their genetic uniformity schwannomas exhibit remarkable clinical and therapeutic heterogeneity, which has impeded the success of early rational therapies. An understanding of how heterogeneity develops in NF2-mutant schwannomas is critically needed to improve therapeutic options for these patients. We have found that loss of the membrane:actin cytoskeleton-associated NF2 tumor suppressor protein, merlin, yields unstable intrinsic polarity and enables Nf2-/- SCs to adopt distinct programs of coordinated autocrine ErbB ligand production, polarized signaling and metabolism according to nutrient availability. We validated biomarkers of these programs in a well-established mouse model of schwannoma. Our studies suggest a self-generating model of heterogeneity and identify biomarkers that can now be mapped to the variable clinical and therapeutic behaviors of human schwannomas.
Introduction
Schwannomas account for a large proportion of sporadic nervous system tumors in humans and are hallmarks of the inherited tumor predisposition syndrome neurofibromatosis type 2 (NF2)1–4. Although usually benign, the development of schwannomas predominantly on and around spinal and cranial nerves causes significant neurological deficit, chronic pain and morbidity. Few targeted therapies have been developed to treat schwannomas and instead, high-risk surgical removal is often necessary. This is particularly difficult for familial NF2 patients, who frequently develop multiple, recurring tumors.
Whether inherited or sporadic, virtually all schwannomas are caused by inactivating mutations in the NF2 tumor suppressor gene, and few cooperating mutations have been identified5. Despite being genetically ‘cold’, schwannomas exhibit surprising heterogeneity, including remarkably variable natural histories, growth rates, histological features and clinical impact1. Neither growth rate nor tumor burden correlates with the ability of schwannomas to cause pain or nerve dysfunction, and the few rational therapies that have been tested for schwannoma have yielded at best a heterogeneous and cytostatic response, often followed by accelerated tumor regrowth after drug cessation6–8. An understanding of the molecular basis of schwannoma heterogeneity is essential for the development of non-surgical therapies.
Schwannoma heterogeneity is also evident histologically and ultrastructurally9–11. Hematoxylin and eosin stained schwannoma tissue reveals regions of spindle-shaped cells that form concentric whorls or aligned arrays, and others of more radially-shaped cells with shorter cell processes (see Fig. 6E). Ultrastructurally, cells within schwannomas exhibit striking variation in the extent of cell-cell versus cell-basal lamina contact, with surfaces coated with dense basal lamina or forming interlocking cell-cell contacts in widely varying proportions, and some regions featuring denuded basal lamina, prominent vacuoles and microcysts9. Such ‘Antoni A and B’ regions exhibit different patterns of immune infiltration and vascularity, suggesting that they harbor distinct paracrine environments12. It is not known how these visible features of cellular heterogeneity are established within otherwise genetically homogeneous tumors.
Schwann cells (SCs) are uniquely polarized epithelial cells that can transition between a bipolar, migratory state during development and wound repair, and an apicobasally polarized state that relies on heterotypic contact with the nerve cell body or axon as an extrinsic spatial polarity cue13,14. Rather than the discrete junctional and fluid-exposed apical surfaces of conventional epithelia, apicobasally polarized SCs form a hybrid ‘apicojunctional’ adaxonal surface that is dedicated to contacting the nerve and enriched in both apical and cell-cell adhesion proteins15–18. The SC:axon interface is also a crucial site of metabolic communication between the two cell types19. The remaining abaxonal surface contacts self-generated basal lamina. Importantly, signaling at the two SC surfaces is distinct14. For example, neuregulin 1 (Nrg1) that is tethered to the nerve surface activates ErbB3 on the adaxonal SC surface to induce the growth of axon-ensheathing membrane and mammalian target of rapamycin complex 1 (mTORC1)-activated protein translation at the expanding membrane edge, while laminin signaling through a6-containing integrins promotes mTORC2-dependent activation of serum and glucocorticoid-induced kinases (SGKs) abaxonally14,20–22. Notably, laminin-activated feedback limits Nrg1-ErbB3-driven membrane production at the adaxonal surface, suggesting that the two signaling domains are normally under feedback control via unknown mechanisms20. In vivo SC polarity is initiated and spatially defined by contact with the nerve cell membrane and in vitro it is imposed by attachment to a laminin-coated culture dish. In schwannomas, the spatial cues that normally govern polarized signaling are lost, and cells exhibit strikingly variable polarized surface content.
The NF2-encoded tumor suppressor, merlin, and closely related plasma membrane:cytoskeleton linking ERM proteins (ezrin, radixin, moesin) share interdependent roles in organizing the cell cortex, and govern cell polarity in multicellular tissues and in individual cells23–30. For example, in single colonic epithelial cells, merlin-deficiency disables the intrinsic polarity conferred by spatially restricted cortical ezrin; instead ectopic cortical ezrin drives unstable polarity26. Consistent with such fundamental cortex-organizing activities, merlin and the ERMs influence many signaling programs, including the activity of small GTPases of the Rho and Ras families, the Hippo signaling network and mTOR kinases31–34. Merlin/ERM-directed cortical organization also modulates the cytoskeletal response to and trafficking of receptor tyrosine kinases, including members of the ErbB family35–40. In liver epithelial cells merlin deficiency enhances the excitability of the cortical cytoskeleton to Epidermal Growth Factor (EGF) stimulation in an ezrin-dependent manner, enabling macropinocytosis, an actin-based mechanism of nutrient scavenging that is initiated by large cell surface ruffles that engulf extracellular fluid36,41. Thus, through fundamental roles in organizing the cell cortex, merlin and the ERM proteins are poised to coordinate metabolic and polarity programs.
We have found that NF2-deficient SCs exhibit unstable polarity and can adopt distinct phenotypic states that feature autocrine ErbB ligand and polarity gene expression, and polarized cytoskeletal reorganization in response to a changing nutrient environment. Our data suggest a novel model of self-generated heterogeneity that could explain the notoriously variable clinical and therapeutic behaviors of schwannomas. Importantly, this model also suggests new biomarkers of schwannoma heterogeneity that we have validated in vivo. These findings provide mechanistic insight into the adaptive biology of SCs and biomarkers that can be developed to guide treatment strategy for human schwannoma.
Results
NF2-deficient SCs exhibit multipolarity and progressive junctional ruffling
When cultured on laminin, Nf2flox/flox (WT) SCs are bipolar with small ruffles forming at the poles, reflecting intrinsic polarity that is independent of cues imposed by axonal contact (Fig. 1A,B). In contrast, three different primary adult mouse Nf2flox/flox SC populations in which Nf2 has been acutely deleted (hereafter denoted Nf2-/-; Supplemental Fig. 1A) exhibited a loss of this intrinsic polarity, instead featuring multiple extended processes containing large, dynamic ruffles, as has been reported (Fig. 1A,B)42. Multipolarity in Nf2-/- SCs is accompanied by a more radial cell shape and distribution of actin, compared to the long parallel stress fibers exhibited by bipolar WT SCs (Fig. 1C; Supplemental Fig. 1B). This is consistent with the fundamental role for merlin in establishing intrinsic cortical polarity that has been observed in other cell types26,28.

Nf2-deficient Schwann cells exhibit enhanced multipolarity and progressive apicojunctional ruffling. A. Representative phase contrast images of polarity in three independently generated Nf2-/- and control parental Nf2flox/flox (WT) SC lines. B. Quantitation of multipolarity in three Nf2-/-and WT SC lines. Data are presented as the fraction of cells containing 2-3 poles or ≥ 4 poles. Bars represent SEM for N=3 independent experiments with n ≥ 85 cells per condition. C. Confocal images depicting F-actin (green) organization in early confluent WT and Nf2-/- SCs with and without stimulation with 10 ng/ml Nrg1 for 10 min. D. Quantitation of F-actin-containing ruffles in late confluent WT and Nf2-/- SCs with and without Nrg1 stimulation. Ruffle area was determined by measuring the ratio of cortical F-actin area over cell area (μm2) in threshold images of MIP of 3D zstacks. Data are presented as mean +/- SEM of n ≥ 50 cells per condition, N=3 independent experiments. E. Confocal images depicting ezrin (magenta) and F-actin (green) localization in WT and Nf2-/- SCs with and without Nrg1 stimulation. F. Graph depicting Ezrin intensity in Nrg1 stimulated cortical ruffles in WT and Nf2-/- SCs. Ezrin intensity was measured within regions of interest generated from threshold images of F-actin. Lines represent mean +/- SEM with n=22 cells per condition, N=3 independent experiments. G. Quantitation of polarity in Nf2-/- SCs infected with shSCR- or shEzrin-expressing lentiviruses; as determined by the aspect ratio (long to short axis). Lines represent mean +/- SEM in n=50 cells per condition. N=2 independent experiments. P values were calculated with unpaired two-tailed Student’s t-test. ***p<0.001. Scale bars=10 μm.
Nrg1 is a major regulator of SC proliferation, migration, and myelination in vivo20,43. When Nf2-/- SCs were acutely stimulated with Nrg1, we observed a dramatic reorganization of actin to form a circumferential band from which large cortical ruffles emanated. In contrast, WT SCs exhibit only weak cortical ruffles in response to Nrg1, despite activating similar levels of downstream signals (Fig. 1C,D; Supplemental Fig. 1C,D). Thus, Nf2-deficiency profoundly alters the organization and responsiveness of the cortical cytoskeleton in SCs.
We previously found that ectopic ezrin drives cortical membrane ruffling in Nf2-/- liver epithelial cells36. In normal SCs in vivo, ERM proteins localize to bipolar ruffling SC tips prior to myelination and to microvilli and the outer mesaxonal surface in apicobasally polarized myelinforming SCs44. In control and Nf2-/- SCs cultured on laminin, ezrin localized to basally positioned microvilli and adjacent basal aspects of cell junctions, but was dramatically relocalized in response to Nrg1 stimulation (Fig. 1E). While WT SCs relocalize ezrin to weak bipolar actin ruffles, Nf2-/- SCs exhibit striking enrichment of ezrin in circumferential cortical ruffles (Fig. 1E,F). Importantly, ezrin depletion eliminated multipolarity and ectopic ruffling caused by Nf2-deficiency (Fig. 1G; Supplemental Fig. 1E-G). These data are consistent with a model wherein ectopic cortical ezrin drives intrinsic multipolarity and excessive Nrg1-induced ruffling in Nf2-/- SCs.
Enhanced cell-cell adhesion and junctional signaling in Nf2-/- SCs
Cortical ruffles in Nrg1-stimulated WT and Nf2-/- SCs contain the core adherens junction proteins N-cadherin and β-catenin, suggesting that cell-cell adhesion may be altered in Nf2-/- SCs (Fig. 2A-B). In fact, while WT SCs restrict N-cadherin-based contacts to bipolar cell tips, Nf2-/- SCs display extensive contacts around their entire periphery, from which cortical ruffles emerge upon Nrg1-stimulation (Fig. 2A). Consistently, we found that ruffling membranes in Nf2-/- SCs are ‘sticky’, enabling the formation of durable intercellular adhesions, while WT SCs did not adhere to one another and, instead undergo contact inhibition of locomotion (Fig. 2C,D; Supplemental Movie 1 and 2)45. Notably, this junctional ruffling phenotype was progressive; at late confluence Nf2-/- SCs exhibited cortical ruffles that continuously emerged from cell contacts to cover the cortical surface and formed tightly packed ‘balls’ that eventually lost attachment to the laminin-coated culture dish (Fig. 2E,F, Supplemental Fig. 2A). In contrast, at late confluence WT SCs rounded up as individual cells that did not adhere to one another (Supplemental Fig. 2A). Notably, WT and Nf2-/- SCs express similar levels of N-cadherin and of Sox2, which can induce relocalization of N-cadherin to SC contacts, and little E-cadherin (Supplemental Fig. 2B,C)46; thus Nf2-deficiency does not drive increased adhesion by either of these mechanisms.
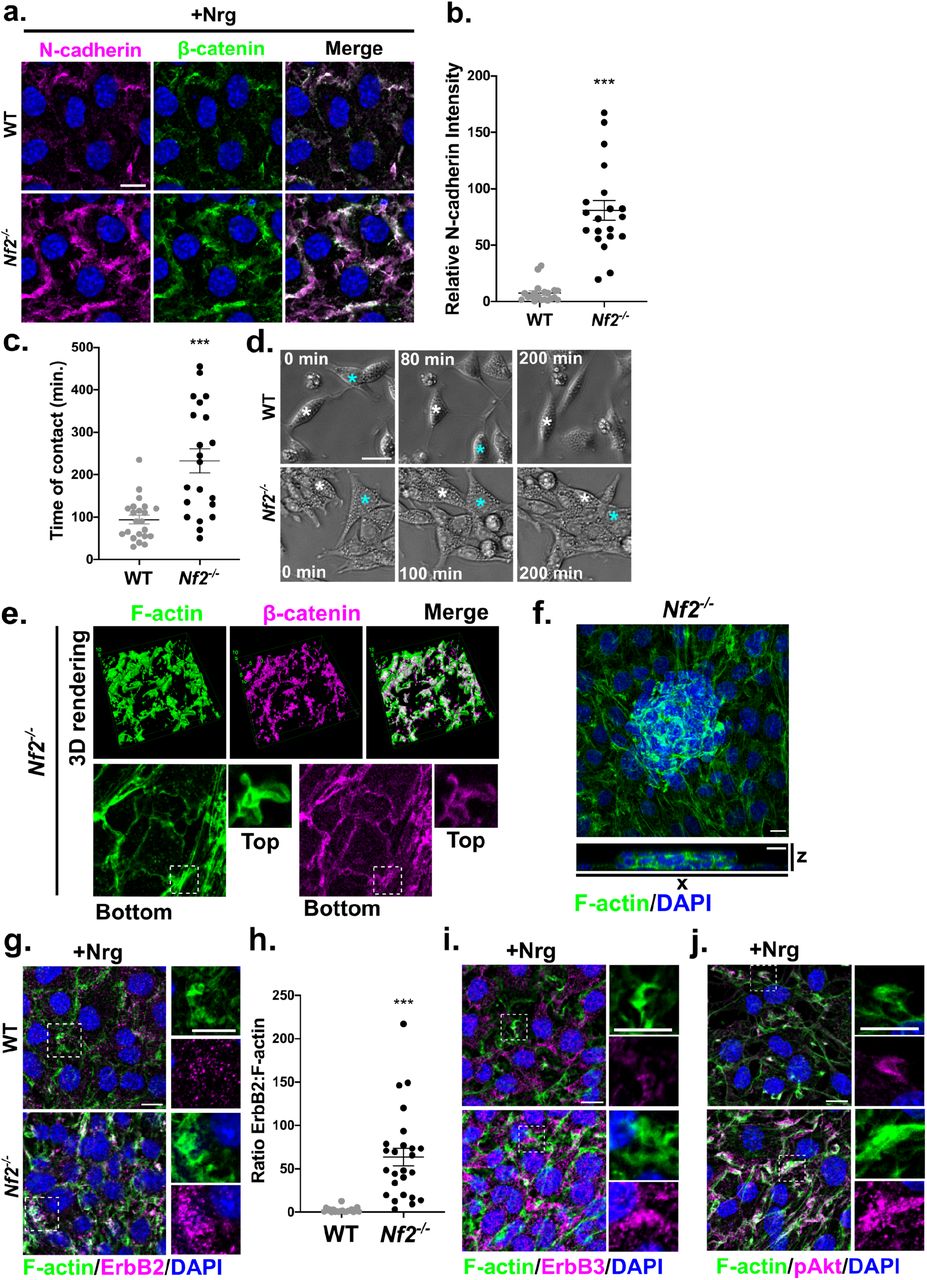
Adhesion and signaling in Nf2-/- SCs. A. Confocal images depicting N-cadherin (magenta) and β-catenin (green) localization in Nrg1 stimulated WT and Nf2-/- SCs. B. Quantitation of polarized N-cadherin intensity in Nrg1 stimulated WT and Nf2-/- SCs. Polarized N-cadherin intensity was measured by dividing the intensity of an ROI along the longest axis of a cell by the intensity of a ROI of equal size along the shortest axis of the cell. Graph represents mean +/- SEM in n=20 junctions per condition. N=3 independent experiments. C. Graph showing duration of sustained contact after WT and Nf2-/-SCs collide as calculated from time lapse phase contrast microscopy images. Lines represent mean +/- SEM in n>20 cells per condition. N=3 independent experiments. D. Individual phase contrast images from time lapse microscopy showing the result of collision between WT or Nf2-/- SCs. Asterisks mark two individual cells that come into contact. E. Top, 3D surface plot of Nrg1-stimulated Nf2-/- SCs labelled for F-actin (green) and β-catenin (magenta). Surface plots were generated from confocal 3D zstack images using the 3D viewer plugin in ImageJ. Bottom, individual zstack images of the basal and cortical (inset) surface of the cells depicting cortical ruffles emanating from junctions. F. Top, MIP of late confluent Nf2-/- SCs labelled for F-actin (green). Bottom, vertical x-z section of confocal zstack image showing tightly packed balls of cells that lose contact with the basal lamina. G. Confocal images showing recruitment of ErbB2 (magenta) to Nrg1-induced F-actin (green) enriched cortical ruffles in WT and Nf2-/- SCs. G. Quantitation of the ratio of ErbB2 relative to F-actin in Nrg1-induced ruffles in WT and Nf2-/- SCs. Graph represents mean +/- SEM in n>20 cells per condition. N=3 independent experiments. H. Nrg1-stimulated Nf2-/- SCs labelled for ErbB3 (magenta) and F-actin (green) to show recruitment of ErbB3 to cortical ruffles. I. Confocal images showing activation of Akt (pAkt S473) in Nrg1-induced cortical ruffles in Nf2-/- SCs. P values were calculated with unpaired two-tailed Student’s t-test. ***p<0.001. Scale bars=10 μm.
In vivo, N-cadherin containing apicojunctional (SC:nerve) contact sites serve as local signaling platforms for Nrg1 signaling through ErbB2:ErbB3 heterodimers46–48. We asked if the expanded ruffling junctional surface in Nf2-/- SCs exhibits increased recruitment of ErbB receptors. We observed a much stronger enrichment of ErbB2, ErbB3, and the key ErbB3 effector pAkt in Nrg1-stimulated junctional ruffles in Nf2-/- SCs compared to WT SCs, despite similar ErbB3 levels and activity (Fig. 2G-J; Supplemental Fig. 1D, 2D). Thus, Nf2-deficiency enables the progressive expansion of an adhesive ‘apicojunctional’ Nrg1-ErbB signaling compartment.
Macropinocytic proficiency
An important consequence of growth factor stimulated cortical actin ruffles, if they are large enough, is to trigger macropinocytosis, a form of extracellular nutrient engulfment that is a signature of Nf2-deficiency in other cell types36,41. Indeed, we found that Nrg1-stimulated Nf2-/- but not WT SCs exhibit uptake of the macropinocytic cargo Dextran-488 that is blocked by the macropinocytosis inhibitor 5-(N-ethyl-N-isopropyl) amiloride (EIPA) (Fig. 3A-C). Robust macropinocytosis was evident in real time, and macropinosomes could be seen internalizing from ruffling cell-cell contacts (Supplemental Movie 3). Schwannoma cells derived from genetically engineered Nf2-mutant mice also exhibited striking Nrg1-stimulated ruffling and macropinocytosis that was blocked by Nf2 re-expression and reversed by ezrin depletion (Fig. 3D,E; Supplemental Fig. 3A-I). This observation could have immediate therapeutic ramifications as it is increasingly appreciated that large macrotherapeutics gain entry into cells via macropinocytosis49. Extracellular vesicles (EVs) provide an important example, and can be engineered to deliver many cargoes, including nucleic acids for gene replacement50–52. Indeed, we found that Nf2-/- schwannoma cells readily take up labelled EVs in an EIPA-sensitive manner (Fig. 3F). Together these data suggest that exaggerated junctional cortical ruffling by Nf2-/- SCs in the presence of Nrg1 can trigger macropinocytosis and enable tumor-selective uptake of macrotherapeutics.

A. Uptake of the macropinocytosis cargo dextran-488 with or without 30 min Nrg1-stimulation in WT and Nf2-/- SCs. B. Quantitation of dextran-488 uptake in WT and Nf2-/- SCs with or without Nrg1-stimulation. Values represent mean +/- SEM for n=20 cells per condition. N=3 independent experiments. C. Graph showing dextran-488 uptake in Nf2-/- SCs treated with vehicle (DMSO) or 50 μM EIPA. Bars represent mean +/- SEM for n=21 cells per condition. N=3 independent experiments. D. Confocal images depicting F-actin (green) and ezrin (magenta) localization in Nf2-/- mouse schwannoma cells with or without stimulation with Nrg1. E. Quantitation of dextran-488 uptake in Nf2-/- schwannoma cells with or without Nrg1 stimulation. Bars represent mean +/- SEM for n=20 cells per condition. N=3 independent experiments F. Uptake of Palm-tdTomato-labelled EVs into Nf2-/- schwannoma cells after treatment with vehicle (DMSO) or 50 μM EIPA. Bars represent mean +/- SEM for n=40 cells for DMSO, n=18 cells for EIPA. N=3 independent experiments. P values were calculated with unpaired two-tailed Student’s t-test. ***p<0.001. Scale bars=10 μm.
Nf2-/- SCs develop autocrine heterogeneity
In vivo, the unrestricted expansion of cell-cell contact, junctional Nrg1-signaling and macropinocytosis exhibited by cultured Nf2-/- SCs would occur when intercellular contact is permitted and Nrg1 is available. However, normal SCs strictly limit cell-cell contact and cells within schwannomas do not retain axonal contact and must therefore adapt to the loss of axonally provided Nrg1. We reasoned that Nf2-/- SCs could adapt by producing their own Nrg1. Indeed, some pancreatic tumors deploy autocrine ErbB ligand expression to induce cortical ruffling and macropinocytic scavenging53. Therefore, we asked whether Nrg1 deprivation similarly triggers autocrine signaling in Nf2-/- SCs. We found that while Nrg1 deprivation yielded a modest increase in the expression of Nrg1 itself in both WT and Nf2-/- SCs, it caused a dramatic upregulation of the EGFR-specific ligands Egf and Tgfα specifically in Nf2-/- SCs (Fig. 4A; Fig. 5B). Surprisingly however, although EGF triggers cortical ezrin-containing ruffles and macropinocytosis in liver epithelial cells36, both Egf and Tgfα suppress these phenotypes in Nf2-/- SCs, and instead enhance the formation of basal actin stress fibers and distribution of ezrin to basal junctional regions and neighboring microvilli (Fig. 4B-D, Supplemental Fig. 4A)44. Notably, Nrg1-deprived Nf2-/- SCs also upregulated multiple components of the SC basal signaling platform, including laminin (Lama2) and the laminin receptors α6 integrin (Itga6) and α-dystroglycan (Dag1) (Fig. 4E)6,7,14,54. Both WT and Nf2-/- SCs upregulated Egfr itself, which is normally expressed at low levels in SCs but increased in some schwannomas, a subset of which respond to pharmacologic EGFR inhibition (Supplemental Fig. 4B)6. The accompanying increase in laminin and α6 integrin proteins is consistent with the enhanced basal cytoskeletal organization seen under conditions of Nrg-deprivation (Supplemental Fig. 4C) However, WT SCs neither upregulate EGF ligands nor ruffle in response to them (Fig. 4A; Supplemental Fig. 4D). Thus, Nf2-/- SCs may adapt to Nrg1-deprivation by upregulating an EGFR-associated basal polarity program.

A. mRNA expression of Tgfa and Egf in WT and Nf2-/- SCs grown under steady-state conditions or deprived of Nrg1 for 24 h. Data is presented as mean +/- SEM relative to WT mRNA levels, N=3 B. Quantitation of macropinocytic dextran-488 uptake in Nf2-/- SCs starved of Nrg1 overnight and stimulated with 10 ng/ml Nrg1, TGFα, or EGF. C. Confocal images depicting the distribution of F-actin (green) and ezrin (magenta) in Nf2-/- SCs starved of Nrg1 overnight and stimulated with Nrg1 or TGFα. D. Quantitation of basal ezrin intensity in cells in (C). Basal ezrin was measured in single plane threshold images from 3D zstacks as the ratio between ezrin area and total cell area for n≥20 cells per condition. N=3 independent experiments. Lines represent mean +/- SEM. E. mRNA expression of Lam2, Itga6, and Dag1 in WT and Nf2-/- SCs under steady state conditions or after 24 h Nrg1-deprivation. Data is presented as mean +/- SEM relative to WT mRNA levels, N=3. P values were calculated with unpaired two-tailed Student’s t-test. ***p<0.001. Scale bars=10 μm.

A. Macropinocytic dextran-488 uptake in WT and Nf2-/- SCs in response to 24 h glutamine deprivation with and without treatment with 2 μM afatanib. Bars represent mean +/- SEM for n≥20 cells per condition. N=3 independent experiments. B. mRNA expression of Nrg1 levels in WT and Nf2-/- SCs grown for 24 h in complete medium (C), Nrg1-deprived medium (-Nrg), or glutamine-deprived medium (-Q). Data is presented as mean +/- SEM relative to WT mRNA levels. N=3 independent experiments. C. Confocal images of F-actin (green) depicting cortical ruffling in Nf2-/- SCs stimulated for 10 min with conditioned medium from glutamine-deprived but not glutamine replete Nf2-/- SCs. D. Quantitation of cortical ruffling from cells in (C). Bars represent mean +/- SEM for n ≥ 20 cells per condition. N=3 independent experiments. E. Dextran-488 uptake in Nf2-/- SCs stimulated for 30 min with conditioned medium from glutamine-deprived Nf2-/- cells treated with vehicle (DMSO), 50 μM EIPA, or 2 μM afatanib. Bars represent mean +/- SEM for n ≥ 20 cells per condition. N=3 independent experiments. F. Levels of Nrg1 mRNA expression in glutamine-deprived Nf2-/- SCs treated with vehicle (DMSO) or afatanib. Data is presented as mean +/- SEM relative to +Q, DMSO mRNA levels, N=3. G. Macropinocytic uptake of dextran-488 in WT and Nf2-/- SCs stimulated with 50 ng/ml HGF or PDGF. Bars represent mean +/- SEM for n≥20 cells per condition. N=3 independent experiments. P values were calculated with unpaired two-tailed Student’s t-test. ***p<0.001. Scale bars=10 μm.
In pancreatic tumor cells, autocrine ruffling and macropinocytosis is most strongly induced upon glutamine depletion, a signature of nutrient deficiency in many rapidly growing tumors53. Indeed, we found that in Nf2-/- SCs glutamine depletion strongly exacerbates ruffling and macropinocytosis that is blocked by the pan-ErbB inhibitor afatanib (Fig. 5A; Supplemental Fig. 5 A,B). However, instead of Tgfα and Egf, the expression of soluble Nrg1 itself is dramatically enhanced under these conditions (Supplemental Fig. 5C,D; Supplemental Fig. 4C; Fig. 5B,). Moreover, conditioned medium from glutamine-deprived but not glutamine-replete Nf2-/- SCs induced membrane ruffling and EIPA- and afatanib-sensitive macropinocytosis in Nf2-/- SCs (Fig. 5C-E). In contrast, conditioned medium from Nrg1-deprived Nf2-/- SCs, like recombinant TGFα or EGF, enhanced basal structures (Supplementary Fig. 5E). Notably, Nrg1 upregulation itself was blocked by afatanib treatment, suggesting a feedforward mechanism of autocrine Nrg1 production (Fig. 5F). Finally, the upregulation of Nrg1 in response to glutamine deprivation was completely rescued by the addition of exogenous glutamate (Fig. 5G). This is important given the mounting appreciation that peripheral nerves themselves can be a key source of glutamate that fuels SCs through a glutamate-glutamine cycle as in the central nervous system55,56. Together these data suggest that in addition and in contrast to an autocrine EGF-ligand driven basal program elicited by Nrg1-deprivation, Nf2-deficient SCs can activate an apicojunctional program of Nrg1-driven signaling and macropinocytic scavenging under conditions of nutrient stress.
The activation of other receptor tyrosine kinases such as c-MET and PDGFR has been reported in schwannoma57,58. Although neither of their ligands, Hgf or Pdgfd, are strongly upregulated in glutamine-deprived Nf2-/- SCs, we found that, like Nrg1 (but unlike EGF or TGFα), both triggered an apicojunctional program of cortical ezrin-containing ruffles and macropinocytosis at the expense of basal structures in Nf2-/- but not WT SCs (Supplemental Fig. 5E,F; Fig. 5H). Recent studies of schwannomas highlight the presence and clinical influence of macrophages, which can be important paracrine sources of both HGF and PDGF12,59. Thus, Nf2-deficiency may also enable macropinocytic scavenging in response to paracrine factors from the microenvironment, which could further drive schwannoma heterogeneity by activating additional signaling pathways.
Self-generated heterogeneity within schwannomas
Collectively, our observations suggest that depending on their microenvironment, Nf2-/- SCs turn on distinct programs of coordinated autocrine ligand production and cytoskeletal polarity. In contrast, WT cells exhibit weak parallel fluctuations in the same autocrine gene expression programs and are resistant to ligand-induced changes in cytoskeletal polarity (Figs 1D, 4F, 5D). The ability of Nf2-/- SCs to adopt such different phenotypic states could explain the self-generation of heterogeneity within schwannomas. Indeed, we found that two schwannoma cell lines derived from genetically engineered mouse (GEM) models that we developed, exhibited evidence of adaptation to these distinct programs60,61. Cells from one schwannoma (schwannoma A) robustly expressed Tgfa, Egf, and basal markers when Nrg1-deprived and exhibited a strong signaling response to TGFα, while those from another (schwannoma B) upregulated Nrg1 when deprived of glutamine and exhibited strong Nrg1-induced signaling, but no longer responded to Nrg1 deprivation (Fig. 6A; Supplemental Fig. 6A).

A. mRNA expression of Tgfa, Lama2, and Nrg1 in schwannoma A and schwannoma B cells under steady state (Con), Nrg1-, or glutamine-deprived conditions (-Q). Data is presented as mean +/- SEM relative to steady state mRNA levels in schwannoma A cells, N=3. B. Confocal images depicting the dramatic induction of pS6 (green) in Nrg1/glutamine-deprived Nf2-/- SCs but not WT SCs. Scale bar=10 μm. C. Quantitation of pS6 levels in cells in (B) as measured in threshold confocal images as the ratio between pS6 area and total cell area. Bars represent mean +/- SEM in n≥10 cells per condition. N=3 independent experiments. D. Quantitation of pS6 levels in Nf2-/- SCs treated with conditioned medium from glutamine- or Nrg1-deprived Nf2-/- SCs. Bars represent mean +/- SEM in n≥10 cells per condition. N=3 independent experiments. E. Hematoxylin and eosin stained paraffin-embedded section of an early mouse schwannoma arising in the DRG of a P0-Nf2Δ2-3 mouse. Scale bar=50 mM. F. Confocal image of pS6 staining of an early mouse schwannoma. Scale bar=20 μm. G. Confocal images of macropinocytic uptake of FITC-Ficoll (tail vein injected) and dextran-488 (applied ex vivo) in an early DRG lesion in a 12 month-old P0-Nf2Δ2-3 mouse. Scale bar=10 μm. H. Quantitation of dextran-TMR uptake with and without EIPA treatment (0.5 mM) ex vivo in a DRG lesion in a P0-Nf2Δ2-3 mouse. Bars represent mean +/- SEM, N=3. I. Confocal images of tissue from early DRG lesions in P0-Nf2Δ2-3 mice stained for Nrg1 (magenta) and pS6 (green). Scale bar=20 μm. J. Graph depicting Nrg1 intensity in cells in (I) staining positively or negatively for pS6. Lines represent mean +/- SEM for n=18 cells per condition. K. Confocal images of TGFa or EGFR in tissue from early DRG lesions in P0-Nf2Δ2-3 mice. Scale bar=20 μm. P values were calculated with unpaired two-tailed Student’s t-test. ***p<0.001.
In normal SCs in vivo axonal Nrg1 drives the polarized activation of mTORC1, as measured by pS6 levels14. The mTORC1 pathway has been implicated in schwannoma, but mTORC1 inhibitors have yielded variable and cytostatic results thus far in patients, which could reflect the heterogeneous dependency on the pathway in tumors33,34,62. Our studies predict that pS6 is a specific biomarker of autocrine Nrg1 signaling in schwannoma and will exhibit a heterogeneous distribution in schwannoma. Indeed, we found that pS6 levels were elevated specifically in nutrient-starved Nrg1-expressing Nf2-/- but not WT SCs, and treatment of Nf2-/- SCs with conditioned medium from glutamine-deprived Nf2-/- SCs yielded dramatic stimulation of pS6 while medium from Nrg1-deprived, EGF ligand-expressing Nf2-/- SCs actually lowered pS6 levels (Fig. 6C,D). Next, we examined schwannomas that arise in Postn-Cre;Nf2flox/flox mice, a well-established model of schwannoma63. Like human schwannomas, early lesions in this model feature regions of spindle shaped cells that form whorls amongst areas of more radially polarized cells with little immune infiltration or vascularization (Fig. 6E). As seen in Fig. 6F, the distribution of pS6 in these early lesions is markedly heterogeneous, with 31.8% of the cells staining positively and 68.2% staining negatively. We also found that macropinocytosis, measured using complementary in vivo and ex vivo approaches, occurred prominently but heterogeneously across schwannomas (Fig. 6G). Importantly, a pulse of the macropinocytosis inhibitor EIPA inhibited ex vivo uptake of dextran-TMR (Fig. 6H; Supplementary Fig. 6B). Finally, consistent with our model of self-generated heterogeneity, we observed that Nrg1, TGFα and EGFR are also heterogeneously expressed across mouse schwannomas, and importantly, that virtually all pS6+ cells expressed high levels of Nrg1 (96%) (Fig. 6I,K; Supplemental Fig. 6C). Interestingly, a subset of cells that are pS6-negative displayed low to moderate levels of Nrg1, suggesting that a threshold of Nrg1 must be reached to trigger mTOR signaling and/or that some cells invoke inhibitory signals (Fig. 6I,J). Together these data identify biomarkers of heterogeneity in early schwannoma lesions and link them to a novel model of self-generated heterogeneity.
Discussion
Clinical and therapeutic heterogeneity is a major issue in schwannoma despite the unique genetic homogeneity of these common tumors. Central to our mechanistic model of heterogeneity is the ability of Nf2-/- SCs to enact distinct programs of ErbB ligand production and autocrine phenotypes depending on the microenvironment. Different ErbB ligands may further exacerbate heterogeneity through paracrine influence on neighboring cells and/or recruitment of other cell types such as macrophages, monocytes and microvessels that are known to be heterogeneously present in schwannomas59. The feedforward nature of these signaling programs may enable stable adaptive intra- and intertumoral heterogeneity to develop. This self-generating design principle likely also applies to more genetically complex tumors, and our studies provide broader insight into the contribution of intrinsic mechanisms to tumor heterogeneity.
Our studies predict that cells within schwannomas harbor at least two phenotypic states reflecting coordinated ErbB ligand production, polarity and metabolic programs: one typified by high basal EGF/TGFα-EGFR-laminin signaling and low mTORC1 activity, and the other by high Nrg1-ErbB3-mTORC1 signaling, apicojunctional contact and macropinocytic scavenging. These features are consistent with the variable ultrastructural features of schwannomas and could reflect well-known Antoni A and B histological signatures. The association of differential signaling with each state could also explain the clinically heterogeneous and cytostatic response of human schwannomas to mTORC1- and EGFR-inhibiting drugs6,8. Also in support of this prediction, we detect strikingly heterogeneous expression of biomarkers of these states within early mouse schwannoma lesions. These new biomarkers can now be multiplexed and mapped to clinical features of tumor behavior and therapeutic response, with the ultimate goal of predicting tumor behavior and guiding treatment strategy. Our work also suggests that tumors and/or tumor regions with significant macropinocytic activity will be particularly amenable to macrotherapeutic modes of delivery.
Switches in polarized ErbB signaling exhibited by Nf2-/- SCs are sensitive to nutrient availability and accompanied by coordinated changes in metabolic programming, which could explain the heterogeneous physiological influence of schwannomas on the nerves they envelop. It is well known that glial cells and nerves provide reciprocal metabolic support to each other20,64. Glial cells release metabolites that are transported into and sustain the metabolic requirements of axons in both the CNS and PNS, and metabolic dysfunction in glial cells is known to cause neurodegeneration20,64. The autocrine Nrg1-driven macropinocytic state induced upon glutamine deprivation could occur, as in other tumors, when growing schwannomas outpace their nutrient supply53. Alternatively, glial cells can engage in a unique glutamate-glutamine cycle with the nerves they contact; therefore glutamine deprivation may mimic the loss of axonally produced glutamate and occur as an early event in schwannomagenesis, a possibility consistent with our observation that exogenous glutamate reverses Nrg1 upregulation upon glutamine deprivation. Thus, Nrg1-expressing cells within schwannomas likely exhibit perturbed glutamate homeostasis and could specifically impair nerve function.
The fundamental differences in polarized cytoskeletal remodeling that Nrg1 and EGF/TGFα elicit in Nf2-/- SCs may reflect spatial differences in ErbB receptor signaling and ‘cytoskeletally excited’ versions of normal SC response to these ligands. Exaggerated cytoskeletal responses to ErbB ligands occur in other types of Nf2-/- cells; for example, in Nf2-/- liver epithelial cells EGF and TGFα induce cortical ruffling and macropinocytosis that is completely blunted by Nf2 re-expression or elimination of ezrin36. Surprisingly, EGF ligands do not trigger ruffling and macropinocytosis in SCs regardless of their genotype and instead enhance the formation of basal actin-containing structures. On the other hand, Nrg1, which is not known to be an important trigger of macropinocytosis in other cell types, does so weakly in WT and robustly in Nf2-/- SCs. These data suggest that ErbB receptors signal to the actin cytoskeleton distinctly in SCs, via cell type-specific ErbB oligomerization and/or expression of actin regulators that are targets of ErbB signaling. Interestingly, it has been reported that Nrg1 also triggers ruffling and macropinocytosis in oligodendrocyte progenitors suggesting that glial cells may generally deploy ErbB3 activation for this purpose65. These data also raise the possibility that other cancers that activate Nrg1, such as those driven by activating Nrg fusions, may also be proficient nutrient scavengers66.
Mechanistically, our studies suggest that the heterogeneous autocrine programs exhibited by Nf2-/- schwannoma cells are driven by unstable intrinsic cortical polarity. Intrinsic SC polarity is normally stabilized by spatially controlled extrinsic signals such as axonal and basal lamina contact. We propose that cortical instability driven by the failure to limit cortical ezrin facilitates loss of axonal contact and enables Nf2-/- SCs to adopt different phenotypic states that reflect unrestrained feedback mechanisms normally used by SCs to meter their functional interaction with axons. Stochastic differences in the amount of cell-cell and cell-basal lamina contact experienced by individual schwannoma cells as they divide and move away from the axon will likely significantly influence patterns of such ‘self-generated’ heterogeneity. Such a model would be consistent with the variable activation of multiple signaling pathways in Nf2-/- SCs, including mTORC1, mTORC2 and YAP/TAZ21,33. For example, the SC YAP/TAZ targets Itga6 and Dag1 are elevated in Nf2-/- SCs only upon Nrg1-deprivation and in a basal-signaling schwannoma cell line, which would be consistent with the well-known activation of YAP/TAZ in response to the cytoskeletal changes triggered by cell-ECM attachment (Fig. 4E, 6A)67,68. Given the growing appreciation of the remarkable plasticity of SCs, it will be important to determine whether heterogeneous adaptation in schwannomas is stable, or whether, like chameleons, cells can ‘re-adapt’ in response to small molecule inhibitors. A mechanistic understanding of how heterogeneity develops in schwannoma provides a pathway to combatting it.
Materials and Methods
Mice
The mouse schwannoma A and B cell lines were derived from tumors dissected from P0-CreB;Nf2flox/flox and P0-SCH-Δ(39–121)-27 mice, respectively60,61. The genetically engineered mouse model Postn-Cre;Nf2flox/flox of NF2 schwannomas was generated by breeding Postn-Cre and Nf2flox mice61,69. All mouse strains were maintained on FVB/N genetic background. Mice were monitored twice a week for 24 months or until a tumor or evidence of a tumor (paralysis, swelling, lethargy) was observed. All animal care and experimentation were performed with the approval of the UCLA Institutional Animal Care and Use Committees under protocol number 2019-042.
Cell culture and reagents
Primary murine SCs were isolated from sciatic nerves of Nf2lox/lox adult mice and purified by magnetic sorting as previously described61,70. SCs were routinely cultured in N2 medium (DMEM/F12-HAM, 1x N2 supplement (Thermo Fisher), 50 μg/ml gentamicin (Thermo Fisher), 2 μM forskolin (Calbiochem) and 10 ng/ml Nrg1 (HRG-beta-1 EGF domain) (R&D Systems) on poly-L-lysine (50 μg/ml, Millipore Sigma) and mouse laminin (10 μg/ml, Thermo Fisher) coated plates and incubated at 37° C and 7.5% CO2. Nf2 was deleted from Nf2flox/flox SCs via adenovirus infection with Cre-recombinase (Ad5-CMV-Cre). Tumoral SCs from mouse schwannomas were isolated by dispase/collagenase dissociation as described70 and cultured in DMEM supplemented with 10% fetal bovine serum (FBS), 1x N2 supplement, 50 μg/ml gentamicin, 2 μM forskolin, and 10 ng/ml Nrg1 on poly-L-lysine and laminin coated plates at 37° C and 7.5% CO2. Adenovirus infection was used for Nf2 re-expression (Ad5-CMV-Nf2WT). 293A cells for adenovirus production (Agilent), and 293T cells for lentivirus production (ATCC) were cultured in 10% FBS-DMEM with 1% penicillin/streptomycin (Thermo Fisher) and incubated at 37° C and 5% CO2.
Growth factors and reagents
Nrg was used at 10 ng/ml; All other growth factors were obtained from Peprotech. EGF was used at 10 ng/ml; TGFα was used at 10 ng/ml; HGF was used at 50 ng/ml; PDGF was used at 50 ng/ml. Drug pretreatment was as follows: EIPA (Millipore Sigma), 50 μM, 60 min; afatanib (Selleck), 2 μM, 24 hours. These doses were maintained throughout the experiment.
Plasmids and shRNA constructs
The Nf2WT expression construct was generated by PCR amplification of the mouse Nf2 coding region and cloned into a pAdCMV vector as described35. The shRNA constructs targeting mouse ezrin (5′-ATTTCCTTGTTATAATCTCCG-3′) in a pLKO-puro.1 vector from GE Healthcare and described in26. The control (shScr; (5′-CAGTCGCGTTTGCGACTGG-3′) in a pLKO-puro.1 vector was provided by Marianne James (MGH, Boston)71.
Virus production and infection
Nf2WT-expressing and Cre-recombinase adenoviruses were generated using the AdEasy system (Agilent) as described in35. Cells were infected 24 h before the start of the experiment to induce Nf2 gene expression. An empty adenoviral vector was used as a control (EV). shRNA-expressing lentiviruses were generated by co-transfecting 293T cells with pLKO-puro.1 vectors and the packaging vectors ΔVPR and VSVG (FuGENE, Promega). Viruses were harvested 24-48 h post transfection. shScr or shEzrin expressing lentiviruses were stably expressed in LDCs and selected in 4 μg/ml puromycin.
Antibodies
The following primary antibodies were used: anti-ezrin mouse monoclonal antibody (mAb) (1:500; MA5-13862, Invitrogen); anti-N-cadherin mouse mAb (1:500; clone 32, BD Biosciences); anti-β-catenin mouse mAb (1:500; clone 14, BD Biosciences); anti-pAkt (S473) rabbit mAb (1:100; D9E, Cell Signaling Technology); anti-EGFR rabbit mAb (1:100; D38B1, Cell Signaling Technology), anti-ErbB2 rabbit pAb (1:100; A0485, Agilent), anti-ErbB3 mouse mAb (1:100; RTJ2, Invitrogen); anti-pS6 (S235/236) rabbit pAb (1:100; 2211, Cell Signaling Technology); anti-Nrg1 rabbit pAb (1:100; ab191139, Abcam); anti-TGFα rabbit pAb (1:100; ab9585, Abcam). Alexa Fluor 647-phalloidin or Rhodamine-phalloidin (1:500; Thermo-Fisher) was used to label F-actin. Species-specific secondary antibodies conjugated to Alexa Fluor 488, 555, or 647 (Invitrogen) were used for IF. DAPI (Invitrogen) was used to label nuclei.
Time lapse imaging
60,000 cells per condition were plated and allowed to adhere for 15 min before washing away unbound cells. Images of regions of interest were captured at 20x magnification at time intervals of 5 min between cycles for 24 hours. Cells were imaged on a fully automated Nikon TiE microscope (Micro Device Instruments) equipped with a biochamber heated at 37° C and 5% CO2 as described in [REF 72].72
Immunofluorescence microscopy
Cells for immunofluorescence were plated on glass coverslips coated with poly-L-lysine and laminin 24-48 hours before staining. Cells were fixed in 4% paraformaldehyde in PBS for 15 min at room temperature, then permeabilized in 0.2% Triton X-100 for 10 min. Primary and secondary antibodies were diluted in PBS with 1% BSA and incubated for 1 hour at room temperature. Alexa Fluor-Phalloidin was added with secondary antibodies. Coverslips were mounted with Prolong Gold Antifade Mountant (Thermo Fisher). Cells were imaged with an inverted laser scanning confocal microscope (LSM710; Carl Zeiss) equipped with a 63x oil immersion objective (Plan Apochromat NA 1.4; Carl Zeiss). DAPI was excited with a 405-nm laser line of a diode laser. Alexa Fluor 488, Alexa Fluor 555, and Rhodamine probes were excited with the 488-nm or 514-nm laser line of an argon laser. Texas-Red fluorescent probes were excited with the 561-nm laser line of a helium-neon laser. Alexa Fluor 647 probes were excited with the 633-nm laser line of a helium-neo laser. Images were acquired as single images or zstacks in sequential mode using ZEN Black software (2012; Carl Zeiss).
Western blotting
Cells were lysed in RIPA buffer (50 mM Tris, pH 7.4, 1% Triton X-100, 1% SDS, 0.5% sodium deoxycholate, 150 mM NaCl, 1 mM EDTA, 1 mM EGTA, and protease inhibitors). Cell debris was cleared by centrifugation (18,000g for 10 min at 4°C) and equal amounts of protein were separated by SDS-PAGE, transferred to PVDF membranes, and immunoblotted with primary antibody overnight at 4°C in 5% milk or 5% BSA (phospho-specific antibody).
Macropinocytosis Assay
For in vitro assay, cells were plated on poly-L-lysine and laminin coated glass coverslips and incubated for 24-48 hours until close to confluent. Cells were starved of serum and/or Nrg overnight in either complete growth medium or glutamine free medium. Dextran-488, (Oregon Green 488; 70,000 da, anionic, lysine fixable) or was added to cells along with growth factor when appropriate (0.5 mg/ml) and incubated for 30 minutes at 37° C. Cells were rinsed 3 times with cold PBS and fixed with 4% paraformaldehyde. For the in vivo/ex vivo assay, Postn-Cre;Nf2flox/flox mice were injected with 250mg/kg FITC-Ficoll (70,000 Da, Millipore Sigma 51731-1G) and dorsal root ganglia (DRG) were dissected 24 h later. Dissected tumors were incubated overnight in N2 growth medium without Nrg and then with 1 mg/mL Dextran-TMR (10,000 Da, Molecular Probes D1817) for 1 hour in complete N2 growth medium with Nrg. For the EIPA ex vivo assay, DRGs were dissected from Postn-Cre;Nf2flox/flox mice, incubated 24 hours in N2 growth medium without Nrg with DMSO or EIPA (500μM) pretreatment. DRGs were then incubated for 30 min in N2 growth medium with Nrg and 1 mg/mL Dextran-TMR. After treatments, DRGs were directly frozen in OCT blocks and sectioned at 8 μm.
EV production and uptake
EVs were harvested as previously described (Reategui et al. 2018) from the conditioned medium of ~1.0 x 10⁸ EO771-LMB cells expressing tandem dimer Tomato (tdTomato) fused to the NH2-terminus to a palmitoylation signal (Palm-tdTomato)(kindly provided by Drs. Xandra Breakfield and Shannon Stott). Medium was collected and centrifuged at 300g for 10 min and at 2000g for 10 min. Supernatants were filtered (0.8 μm; EMD Millipore) and ultracentrifuged at 100,000g for 90 min at 4°C (Optima L-90K Ultracentrifuge, Beckman Coulter). Pelleted EVs were resuspended in 200 μl PBS. EVs were added to cells grown on poly-L-lysine and laminin coated glass coverslips at ~106 per 0.7 cm2 and incubated for 4 h at 37° C. Cells were then fixed and stained with DAPI.
Nutrient deprivation and conditioned medium experiments
Cells were plated in complete culture medium and allowed to grow for 24-48 hours until they reached near confluence. Complete culture medium was replaced with glutamine-free or Nrg1-free medium, as indicated and incubated for 24 hours. For experiments in schwannoma cells serum was also removed from the medium. For glutamate rescue experiments, 10 mM L-glutamic acid (Millipore Sigma) was added to glutamine-free medium and incubated with cells for 24 hours. For conditioned medium experiments, medium was harvested from Nf2-/- SCs grown on 60 mm plates in complete growth medium, glutamine-free medium, or Nrg1-free medium for 72 hours. Medium was centrifuged at 400g for 5 min and filtered through a 0.45 μm filter. 100 μl of conditioned medium was added to each coverslip containing Nf2-/- SCs for the indicated time.
Quantitative RT-PCR
Total cellular RNA was extracted using TRIzol (Thermo Fisher) and reverse transcribed with MMLV-RT (Promega) using oligo-dT primers. Fast Start Universal SYBR Green mix (Millipore Sigma) was used to amplify 0.5 μl of the RT reaction in a 25 μl total reaction volume. Triplicate samples were run on a Light Cycler 480 system (Roche Applied Science) with cycling conditions of denaturation for 15 seconds at 95° C, annealing for 1 minute at 60° C, and extension at 60° C, 45 cycles. Expression of GAPDH was used as an internal reference gene.
Primer sequences are as follows: Gapdh forward (5′-AGGTCGGTGTGAACGGATTTG-3′), reverse (5′-TGTAGACCATGTAGTTGAGGTCA-3′); Nrg1 forward (5′-TCATCTTCTAGCGAGATGTCTG-3′), reverse (5′-CAGACATCTCGCTAGAAGATGA-3′); Nrg1, TypeI forward (5′-GGGAAGGGCAAGAAGAAGG-3′), reverse (5′-TTTCACACCGAAGCACGAGC-3′); Nrg1, TypeIII forward (5′-ACTCAGCCACAAACAACAGAAAC 3′), reverse (5′-GAAGCACTCGCCTCCATT-3′); Tgfα forward (5′-CACTCTGGGTACGTGGGTG-3′), reverse (5′-CACAGGTGATAATGAGGACAGC-3′); Egf forward (5′-AGCATCTCTCGGATTGACCCA-3′), reverse (5′-CCTGTCCCGTTAAGGAAAACTCT-3′); Lama2 forward (5′-TCCCAAGCGCATCAACAGAG-3′), reverse (5′-CAGTACATCTCGGGTCCTTTTTC-3′); Itga6 forward (5′-TGCAGAGGGCGAACAGAAC-3′), reverse (5′-CGTGCTGCCGTTTCTCATATC-3′); Dag1 forward (5-′CAGACGGTACGGCTGTTGTC-3′, reverse (5′-AGTGTAGCCAAGACGGTAAGG-3′); and Egfr forward (5′-GCCATCTGGGCCAAAGATACC-3′), reverse (5′-GTCTTCGCATGAATAGGCCAAT-3′).
Immunohistochemistry and tissue staining
Hematoxylin and eosin staining was performed on 3.5-μm sections prepared from paraffin blocks of formalin-fixed DRGs dissected from Postn-Cre;Nf2flox/flox mice. Immunofluorescence staining was performed using a standard protocol: after air drying the frozen sections, they were fixed in formaldehyde 3.7% for 15 min, washed in PBS 3 times, incubated in a blocking/permeabilization buffer (PBS+5%NGS+0.3%Triton) for 1 hour. Sections were then incubated with primary antibodies overnight at 4°C, washed with PBS 3 times and incubated with secondary antibodies for 1 hour at room temperature. Nuclear staining was performed with Hoechst 33258 (0.2μg/μL) and sections were mounted with Fluorescence Mounting Medium (Dako S3023). For staining of macropinocytosis assays, slides were washed quickly in PBS before fixation to reduce nonspecific background and then incubated with Hoechst before coverslip mounting73. Images were acquired as single-plan in sequential mode using a SP8 Light-Sheet confocal microscope and the LAS X software (Leica).
Image analysis and statistics
ImageJ software (version 2.0, National Institutes of Health) was used for all image processing and analysis. The displayed images were produced from single confocal slices or maximum projections of zstack images. Background was removed with rolling ball background subtraction. Lookup tables were applied to produce final images. Ruffle area was determined by measuring the ratio of cortical F-actin area over cell area (μm2) in threshold images of maximum intensity projections (MIP) of 3D zstacks. Fluorescence intensity was measured by applying a threshold mask to a region of interest (ROI) and calculating the area of positive signal to the total surface area of the cell, field of view, or region of interest. For cell polarity measurements, cell poles were either counted by hand in time lapse images or the aspect ratio was calculated using the shape descriptor measurement tool in ImageJ. Dextran or EV uptake was measured using the analyze particles function to determine the ratio of total particle area to total cell area in threshold images. For quantification of the ex vivo macropinocytosis inhibition by EIPA, analysis was performed with 5 single-plane confocal images per conditions, processed as described73. Data from all analyses was imported into Prism 8 for plotting graphs and statistical analysis. The unpaired two tailed Student’s t test was used to compare groups.
Author Contributions
The study was conceived and designed by C.C.M., J.V. M.G., and A.I.M. In vitro experiments were carried out by C.C.M. and C.H.L., In vivo experiments were carried out by J.V. Data were analyzed and interpreted by C.C.M, C.H.L., J.V., M.G., and A.I.M. The project was supervised by A.I.M and M.G. Drafting of the manuscript and preparation of figures was completed by C.C.M and A.I.M. All authors read and commented on the manuscript.
Acknowledgments
We thank past and present members of the McClatchey lab for valuable discussions; Shannon Stott and Berent Aldikacti for EO771-LMB cells and expertise in EV isolation; Daniel Irimia and Xiao Wang for assistance with time lapse imaging; MGH Cancer Center/Molecular Pathology Confocal Core for access to confocal microscopy equipment. This work was supported by a Department of Defense grant W81XWH1910156 (A.I.M, M.G.), a Drug Discovery Initiative Award from the Children’s Tumor Foundation (A.I.M.), and an MGH American Cancer Society Institutional Research Grant (C.C.M.).


