

Abstract
A subset of individuals with type 1 diabetes mellitus (T1DM) are predisposed to developing diabetic kidney disease (DKD), which is the most common cause globally of end-stage kidney disease (ESKD). Emerging evidence suggests epigenetic changes in DNA methylation may have a causal role in both T1DM and DKD. The aim of this investigation was to assess differences in blood-derived DNA methylation patterns between individuals with T1DM-ESKD and individuals with long-duration T1DM but no evidence of kidney disease upon repeated testing. Blood-derived DNA from individuals (107 cases, 253 controls and 14 experimental controls) were bisulphite treated before DNA methylation patterns from both groups were generated and analysed using Illumina’s Infinium MethylationEPIC BeadChip arrays (n=862,927 sites). Differentially methylated CpG sites (dmCpGs) were identified (false discovery rate adjusted p≤×10−8 and fold change ±2) by comparing methylation levels between ESKD cases and T1DM controls at single site resolution. Gene annotation and functionality was investigated to enrich and rank methylated regions associated with ESKD in T1DM.
Top-ranked genes within which several dmCpGs were located and supported by in silico functional data, and replication where possible, include; AFF3, ARID5B, CUX1, ELMO1, FKBP5, HDAC4, ITGAL, LY9, PIM1, RUNX3, SEPTIN9, and UPF3A. Top-ranked enrichment pathways included pathways in cancer, TGF-β signalling and Th17 cell differentiation.
Epigenetic alterations provide a dynamic link between an individual’s genetic background and their environmental exposures. This robust evaluation of DNA methylation in carefully phenotyped individuals, has identified biomarkers associated with ESKD, revealing several genes and implicated key pathways associated with ESKD in individuals with T1DM.
Main Text Introduction
Type 1 diabetes mellitus (T1DM) is a polygenic disease characterised by autoimmune destruction of the insulin producing beta cells in the pancreas which subsequently leads to hyperglycaemia (1). Up to 40% of individuals with T1DM are predisposed to diabetic kidney disease (DKD), a microvascular diabetic complication (2,3). Diabetes remains the primary disease causing end-stage kidney disease (ESKD) (4,5). Individuals with DKD are also at increased risk of developing cardiovascular disease and premature mortality (6).
Emerging evidence indicates that autoimmune diseases such as T1DM are influenced by the interaction of genetic and epigenetic factors (7). Genome-wide association studies (GWAS) have identified >50 loci associated with T1DM risk (8,9), including rs3802604 in GATA3, rs1770 in MHC (10), rs2292239 in ERBB3 (11) and rs2476601 in PTPN22 (12).
GWAS have been completed in populations with T1DM assessing the genetic predisposition to DKD and ESKD. One recent GWAS encompassing almost 20,000 individuals with T1DM (13) identified 16 risk loci including the missense mutation rs55703767 in COL4A3. Additional GWAS have identified nucleotide variants in rs7583877 in AFF3 (14), rs1888747 and rs10868025 in FRMD3, (15) and rs4972593 in CDCA7-SP3 (16).
Epigenetic changes in DNA methylation have been associated with T1DM (17) and DKD (18) using peripheral whole blood samples. Bell et al. (19) used Illumina’s Infinium 27K array in 2010 to assess epigenetic profiles associated with DKD in T1DM within 192 individuals. Nineteen differently methylated CpG sites (dmCpGs) were reported and correlated with time to the development of DKD. Six genes of interest with at least two dmCpGs including CUX1, ELMO1, FKBP5, PRKAG2 and PTPRN2 were identified from an epigenome-wide association study (EWAS) published in 2014 (20). This investigation included individuals with DKD, caused by either T1DM or type 2 diabetes mellitus (T2DM).
In 2014, Gu et al. (21) employed bisulphite pyrosequencing of 778 individuals with T1DM, with and without DKD, and reported a decrease in the DNA methylation levels within IGFBP1. In 2015, Swan et al. (22) assessed DNA methylation variation in genes which encode mitochondrial proteins using Illumina’s 450K and 27K methylation arrays in 442 individuals with T1DM and DKD. In all, 46 dmCpGs were identified in both individuals with DKD and ESKD. The largest change in methylation was evident for cg03169527 within TAMM41. Previous EWAS have identified differential methylation features with associations to chronic kidney disease (CKD) (23–26). Improvements in sequencing and profiling technologies have prompted a rise in the number of studies assessing diseases using these techniques for biomarker discovery (23,27).
The aim of the present study was to assess differences in blood-derived DNA methylation patterns (using a high-density array) between individuals with T1DM-ESKD (including individuals requiring dialysis, or those having received a kidney transplant) and individuals with at least 15 years of T1DM and no evidence of kidney disease. Careful and precise phenotyping has provided the ability to minimise differences caused by dialysis treatment; we also evaluated differences in methylation between individuals with T1DM-ESKD who had received a kidney transplant, and thus were receiving immunosuppressive medication, versus those with long duration of T1DM and no evidence of kidney disease.
Materials and Methods
Samples
Each participant was recruited as part of the All Ireland-Warren 3-Genetics of Kidneys in Diabetes (GoKinD) United Kingdom Collection. All participants were previously recruited, had White ancestry and provided written informed consent for research. DNA was frozen in multiple aliquots following extraction from whole blood using the salting out method (28) and normalised using PicoGreen quantitation (29) using the CytoFluor® Series 4000 (Applied Biosystems, Thermo Fisher Scientific, CA, USA).
Individuals with both T1DM and ESKD were defined as cases (n=107). These individuals had ≥10 years duration of T1DM alongside a diagnosis of DKD defined as persistent macroalbuminuria (≥500 mg/24hr), estimated glomerular filtration rate (eGFR) <60 mL/min/m2 calculated using the Chronic Kidney Disease Epidemiology Collaboration (CKD-EPI) creatinine equation, hypertension (systolic/diastolic blood pressure ≥135/85 mmHg) and ESKD. They were not taking any anti-hypertensive medication. The control individuals had ≥15 years duration of T1DM and no evidence of kidney disease on repeat testing i.e. they all had normal urinary albumin excretion and eGFR >60 mL/min/m2 (n=253).
MethylationEPIC Array
Blood-derived DNA from each participant was accurately quantitated using PicoGreen® prior to normalisation. In total, 800 ng of DNA from each participant was bisulphite treated using the EZ Zymo Methylation Kit (D5002, Zymo Research, CA, USA) following the alternative over-night incubation conditions for use prior to the Illumina® Infinium MethylationEPIC Kit provided in the published protocol. All samples were prepared and analysed using the Infinium MethylationEPIC Kit and BeadChips (Illumina, CA, USA) with no protocol deviations. All samples were processed in a consistent laboratory workstream by the same members of trained staff and methylation arrays were scanned using a dedicated iScan machine with regular monitoring of laser intensity levels. Case and control samples were randomly distributed across the BeadChip arrays. This array is a high-throughput platform which provides quantitative evaluation of methylation levels (β values) with single nucleotide resolution. In total 862,927 sites were examined by the Infinium MethylationEPIC array. The Infinium HD Methylation SNP List was also searched for any SNPs that may have impacted upon the methylation array results (30).
Quality control
Each resulting .idat file generated from the iScan was assessed using BeadArray Controls Reporter (BACR) Software (Illumina) for quality control (QC). This software assessed the data in connection with a pre-set standard set of controls and evaluated the hybridisation, extension, dye specificity and bisulphite conversion process. An additional QC measure to determine the concordance of average beta values generated for seven duplicate samples was completed using GenomeStudio (Illumina) v1.8, methylation module including a sex check of all included individuals.
Proportional white cell counts (WCCs) were estimated following the Houseman method (31) using the raw .idat files output from the iScan machine. The minfi Bioconductor (v3.10) package was utilised to estimate six WCCs, CD8+ T, CD4+ T and CD19+ B lymphocytes, CD56+ natural killer cells, CD14+ monocytes and CD15+ granulocytes using the estimateCellCounts function for both the case and control groups, and a Northern Irish general population control group (32).
Differentially methylated loci analysis
Case and control groups were investigated for dmCpGs using Partek Genomics Suite (PGS) v7.19.1125 (Partek, MO, USA) following functional normalisation. All software was used following the developer’s instructions. Beta values were generated before M values were calculated. DmCpGs were determined using the M values for individuals with T1DM and ESKD compared to controls with long duration of T1DM and no evidence of kidney disease on repeat testing. Parameters were set at false discovery rate (FDR) adjusted p value threshold of ≤×10−8 alongside a fold change (FC) ≥±2. Related genes were annotated based on Homo sapiens hg19 genome build using PGS. Four analyses were performed (Table 1), each assessing differential methylation patterns in individuals with T1DM-ESKD to those with T1DM and no evidence of renal disease (Figure 1). Briefly,
107 matched pairs, where both the case and control individuals were matched for age at sample collection (differing by <5 years), sex and duration of diabetes (differing by ≤10 years). Case individuals had a functioning kidney transplant or were receiving dialysis. Controls individuals had T1DM and no evidence of kidney disease.
The same 107 individual cases from Analysis 1 were compared to a larger sample size of (unmatched) control individuals with T1DM and no evidence of kidney disease (n=253).
73 matched pairs for age at sample collection (differing by <5 years), sex and duration of diabetes (differing by ≤10 years). The case subjects were restricted to individuals with a functioning kidney transplant to minimise potential confounding due to differences in medication and renal replacement therapy modalities. These individuals were compared to matched controls with T1DM and no evidence of kidney disease.
The same 73 individuals from Analysis 3 were compared to a larger sample size of (unmatched) control individuals with T1DM and no evidence of kidney disease (n=253).
Participant group characteristics, per comparison.

Illustration of groups samples were assigned to in order to complete the analysis.
Resulting dmCpGs which overlapped each of the four analyses were also extracted and displayed in a heatmap which highlighted their degree of hyper- and hypo-methylation.
Functional gene ontology and network analyses
Gene functionality was examined by gene ontology (GO) and Kyoto Encyclopedia of Genes and Genomes (KEGG) pathway enrichment analysis using PGS. An additional functional analysis was undertaken using STRING v11: protein-protein association networks (33). For each of the four analyses, genes with top-ranked dmCpGs were categorised according to increased or decreased FC.
Kidney gene expression data
Participants for this study were American Indians with type-2 diabetes (34). Protocol kidney biopsy samples were obtained from this cohort (n = 97). The study was approved by the Institutional Review Board of the National Institute of Diabetes and Digestive and Kidney Diseases and each participant signed an informed consent document. Expression profiling of the kidney biopsies was previously carried out using Affymetrix GeneChips (HumanGenome U133 Array and U133Plus2 Array and Affymetrix Human Gene ST GeneChip 2.1) as reported (35,36), and RNA-seq (Illumina)(13). Expression quantitative trait (eQTL) mapping was performed using an EPACTS (https://genome.sph.umich.edu/wiki/EPACTS) software tool using linear mixed model accounting for hidden familial relatedness, after inverse Gaussian transformation of expression levels, adjusting for age and sex. Significance threshold was set at p≤10−5 for eQTL and p<=0.05 for association studies
For morphometry measures, kidney biopsy tissue was prepared for light and electron microscopy studies according to standard procedures (37–39). The following glomerular structural parameters were measured by unbiased morphometry on electron microscopy images as described elsewhere (37,38,40): glomerular basement membrane (GBM) width (41,42), mesangial fractional volume (VVMES) (41,42), glomerular filtration surface area per glomerular volume (SV) (41,42), percentage of endothelial fenestrations (P_FEN) (43) and the fractional podocyte volume per glomerulus (VVPC) (44). Cortical interstitial fractional volume (VVINT) (39) were estimated using light microscopy with all specimens embedded in paraffin.
Replication cohorts for the methylation data
Replication cohort was comprised of 327 peripheral blood samples obtained from Pima Indians (24). Blood samples for DNA isolation and cytosine methylation analysis were collected at the baseline examination from subjects. EGFR measures were available from clinical records before and after the nephrectomy. Among these subjects, 318 had longitudinal eGFR measurements with mean follow-up time of 9.8 years with a standard deviation (SD) of 3.9 years. The best linear unbiased predictor (BLUP) model was used to calculate eGFR slope for each subject.
Human kidney samples (n=91) were obtained from surgical full/partial nephrectomies. Kidney samples were ~0.5 cm in diameter and were surrounded by at least 2 cm of normal tissue margins. Clinical data was obtained at the time of the sample collection and for a subset of samples eGFR measures were available from clinical records before and after the nephrectomy (n = 69). Only subjects with longitudinal eGFR measurements for at least three months post nephrectomy were included for the analysis. The mean timespan of follow-up was 2.4 years (SD = 1.5 years).
DNA methylation was detected using Illumina 450K arrays and values were extracted using the minfi package. Several quality control measures were carried out and after the removal of CpG probes that (1) were in the proximity of regions with genetic variations, (2) were located on the sex chromosomes, (3) were known to cross-hybridize to other locations, (4) had poor detection p values (p > 0.01) or (5) were control probes, 321,473 CpG probes remained in the blood replication cohort. The same pre-processing was performed for the kidney replication cohort which resulted in 355,141 CpG probes remaining.
In blood replication cohort, linear regression models were used to determine the association between DNA methylation, eGFR and eGFR slope, with covariates including sex, age, duration, mean arterial blood pressure, HbA1c, batch, converse and estimated cell fraction. Association between cytosine methylation level, eGFR and interstitial fibrosis was determined by linear regression models adjusted by age, sex, race, diabetes, hypertension, batch effect, bisulphite conversion efficiency and degree of lymphocytic infiltrate on histology. A p value of <0.05 was used to determine significance in this replication cohort.
Results
The Illumina Infinium MethylationEPIC BeadChip array examines 862,927 CpG sites. Each resulting .idat file generated from the iScan was assessed using Illumina’s BACR software. This software assessed the data in connection with a pre-set standard set of thresholds (45) which are indicated alongside the BACR data for each analysis. QC was completed with no significant difference in intensity levels detected. On average, fewer than 30 probes failed per sample. Houseman estimates (31) were calculated for the proportional WCCs of each sample and the results were included as a Supplementary Table (ST) for each of the four analyses; ST2, ST8, ST15 and ST21. Proportional WCCs for each group were compared with a general population control group, NICOLA (Northern Ireland Cohort for the Longitudinal Study of Ageing).
Blood-derived DNA from 360 individuals was included in this analysis. Of these participants, 253 were control individuals with a long duration of T1DM and no evidence of kidney disease upon repeated testing. The mean age of these participants was 41 years and with an average duration of diabetes of 26 years and without anti-hypertensive medication usage. The remaining 107 individuals were diagnosed with T1DM-ESKD, 73 of whom had received a kidney transplant. The average age of these participants was 41 years. The participant characteristics are provided in Table 1.
This study was conducted using four complementary analyses; matching of the participants was required for Analyses 1 and 3. Individuals were matched for age at sample collection (differing by <5 years), sex and duration of diabetes (differing by ≤10 years). Concordance plots were drawn for seven duplicate samples; average r2= 0.99; Supplementary Figure (SF) 1.
Analysis 1: Individuals with T1DM and ESKD compared to matched control individuals with T1DM and no evidence of kidney disease
This first analysis included 107 matched pairs, where both the case and control individuals were matched on sex and age at diagnosis (Table 1). The BACR QC report is included within ST1. Proportional WCCs were estimated for all included participant blood samples. ST2 shows the average WCCs for Analysis 1 and the results of a t-test comparing these between the two sample groups. Two cells, granulocytes and monocytes showed significant differences at the 0.05 level, the most significant of which was 0.04; but after correction for multiple testing of the WCC analyses, these results are not significant (p>0.002).
Comparison of the methylation patterns between cases and controls identified 4,391 top-ranked dmCpGs (FDR p≤×10−8, ST3). Two genes, ARID5B and SEPTIN9, contained ≥10 top-ranked dmCpGs. When the stringency was increased to include a larger change in methylation between cases and controls (FDR p≤×10−8 and FC ±2), 490 CpG sites remained significant (ST4) of which 332 were gene centric. Of these, 22 genes contained at least two dmCpGs including HDAC4, ITGAL, LY9, PBX1, RPTOR, RUNX3 and SEPTIN9 (ST4).
To further assess the functional significance of these changes in DNA methylation between case and control groups, a GO enrichment analysis was undertaken. This analysis assessed the biological processes, cellular components and molecular functions of the genes within which the 490 top-ranked CpG sites were located (FDR p≤×10−8 and FC ≥±2). A total of 325 GO functions had an enrichment score ≥4 (p<0.01, ST5 and SF2). The processes with the top enrichment scores include cell surface receptor signalling pathway, immune system process and positive regulation of immune system processes, lymphocyte activation and T cell activation. The KEGG pathway database was searched to identify key pathways linked to the genes where the top-ranked dmCpGs were located. Eleven pathways were identified with an enrichment score of ≥2 and p≤0.01 (ST6). This analysis of differentially methylated genes returned pathways including Th17 cell differentiation, human T-cell leukaemia virus 1 infection, and natural killer cell mediated cytotoxicity.
Analysis 2: Individuals with T1DM and ESKD compared to a larger cohort of unmatched control individuals with T1DM and no evidence of kidney disease
This second analysis included the same 107 individual cases from Analysis 1 with a larger sample size of (unmatched) control individuals with T1DM and no evidence of kidney disease (Table 1). The BACR QC report and proportional WCCs for this analysis are included within ST7 and ST8 respectively.
Following the same analysis path as previously described, comparison of methylation between case individuals and control individuals identified 13,983 top-ranked dmCpGs (FDR p≤×10−8; ST9). Two genes ETS1 and UBAC2 contained over 20 dmCpGs. When the stringency levels were increased (FDR p≤×10−8 and FC ±2), 1,112 CpG sites remained, of which 768 were gene centric (ST10). SEPTIN9 contained the largest number of dmCpGs (n=5) with the criteria set to include FC±2. Comparison of results from Analyses 1 and 2 (FDR p≤×10−8 and FC ±2) identified 325 dmCpGs (223 within genes) which overlapped. Each dmCpG demonstrated the same direction of effect (ST11).
GO enrichment analysis was similarly undertaken to assess the functional significance of the 1,112 significant DNA methylation alterations between the case and control groups. A total of 505 GO functions had an enrichment score ≥4, alongside p<0.01 (ST12 and SF3). The processes with the top enrichment scores include several linked to immune responses including regulation of immune system processes and lymphocyte activation. The KEGG pathway analysis revealed 16 pathways (enrichment score of ≥2, and p≤0.01; ST13), including cancer, acute myeloid leukaemia and natural killer cell mediated cytotoxicity.
Analysis 3: Individuals with T1DM and ESKD who have received a kidney transplant compared to matched control individuals with T1DM and no evidence of kidney disease
The inclusion criterion for the case subjects was restricted to individuals with a functioning kidney transplant for the third analysis. Only blood-derived DNA samples from individuals who had received a kidney transplant were included to minimise potential confounding due to differences in medication and renal replacement therapy modalities (n=73). The methylation status of the CpG sites for these individuals was compared to matched controls with T1DM and no evidence of kidney disease (n=73). The BACR QC report and proportional WCCs for this analysis are included within ST14 and ST15 respectively.
In total, 1,518 top-ranked dmCpGs were different between cases and controls (FDR p≤×10−8; ST16). Of those, 132 of the top-ranked dmCpGs remained when the stringency levels were increased (FDR p≤×10−8 and FC ±2), 81 of which were gene centric including two within MTURN and UPF3A (ST17). Additional GO enrichment and pathway analyses were undertaken for the 132 top-ranked genes in which the dmCpGs were located (FDR p≤×10−8 and FC±2) to assess their functional significance. In total, 75 GO functions were enriched with a score ≥4, alongside p<0.01 (ST18, SF4). The KEGG pathway analysis showed one result - the TGF-β signalling pathway with an enrichment score of ≥2 and p≤0.01, ST19).
Analysis 4: Individuals with T1DM who had received a kidney transplant compared to unmatched control individuals with T1DM and no evidence of kidney disease
The methylation status of the CpG sites for individuals who had received a kidney transplant was compared to unmatched controls with T1DM and no evidence of kidney disease (n=253). The BACR and proportional WCCs QC report are included within ST20 and ST21 respectively. In total, 13,739 top-ranked dmCpGs were identified between both groups (FDR p≤×10−8, ST22). Of these, 723 dmCpGs were gene centric. When the stringency levels were increased (FDR p≤×10−8 and FC ±2), 1,082 CpG sites remained of which 723 were located within genes (ST23). Seven genes including ACAD8, LIME1, RPTOR and SEPTIN9 each contained three dmCpGs. In total, 78 dmCpGs (48 were within genes) overlapped between Analyses 3 and 4 (FDR p≤×10−8 and FC ±2, ST24).
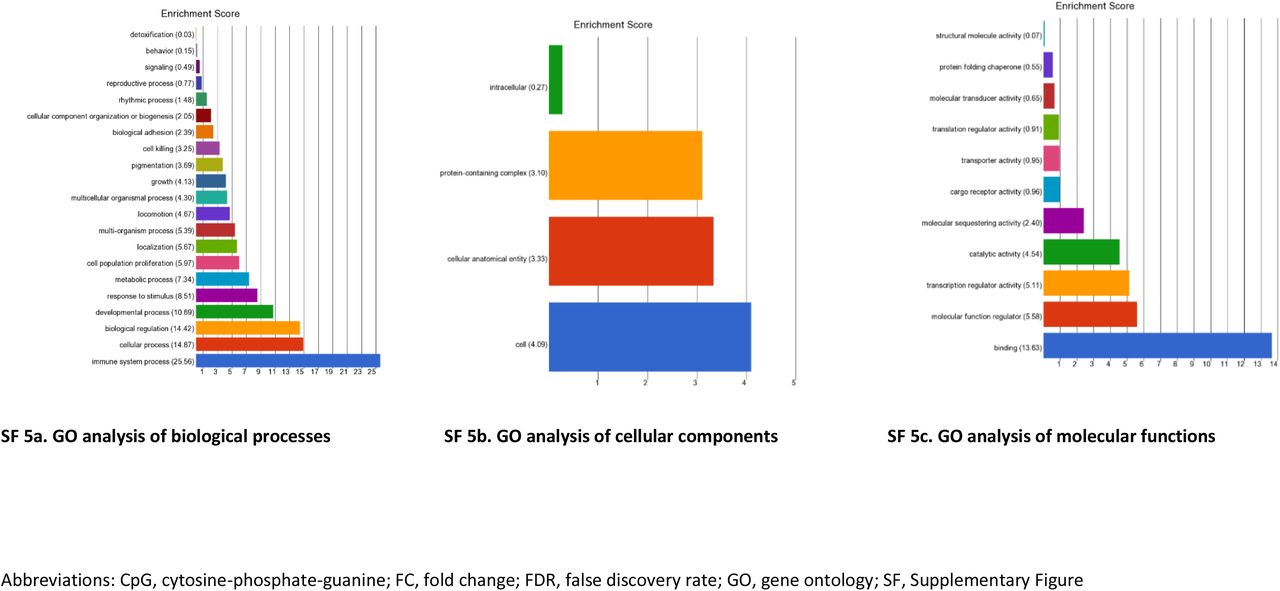
GO enrichment and pathway analyses were completed for the genes in which the 1,082 top-ranked dmCpGs were located (FDR p≤×10−8 and FC ±2). A total of 679 GO functions had an enrichment score ≥4 and p<0.01 (ST25 and SF5). The processes with the top enrichment scores include regulation of cell activation, enzyme binding and immune system processes. Fourteen KEGG pathways were identified (enrichment score of ≥2, and p≤0.01; ST26) including cancer and platelet activation.
Significantly associated dmCpGs from Analyses 1-4
Thirty-six dmCpGs were identified as significantly different between cases and controls in each of the four analyses (FDR p≤×10−8 and FC ±2; ST27 and SF6). The direction of fold change was consistent for each Analysis.
Search for overlapping SNPs
Previous studies have reported that SNPs could potentially impact on methylation status (46). To assess this, we searched the Infinium HD Methylation SNP List (30) for any SNPs that could potentially impact the methylation array results if present in the test population. Of the top-ranked dmCpGs from this analysis (FDR p≤×10−8, FC ±2), five single CpG sites have the potential to be affected by SNPs (ST28). All but two of these SNPs, rs4788986 (SEPTIN9) and rs742232 (RUNX3) are very rare in European populations and would therefore be unlikely to impact in this study. Of note, multiple dmCpGs were identified in both SEPTIN9 and RUNX3 genes with functional support provided for both these genes, making it improbable that these genes are falsely identified.
STRING Functional analyses
Functional network analyses were undertaken using STRING v11 (33) for the list of genes in which the top-ranked dmCpGs were located. Those which showed an increase in FC in the individuals with T1DM-ESKD compared to individuals with T1DM were analysed separately to those genes which showed a decrease in FC. All pathway interactions are shown in SFs7–14.
Functional data results
The genes in which top-ranked dmCpGs were located, which also had the most biological plausibility for ESKD, were assessed for eQTLs in an American Indian population with T2DM(47). EQTLs demonstrated support for eight of the top-ranked dmCpG genes; CUX1, ELMO1, HDAC4, PIM1, PRKAG2, PTPRN2, RUNX3, SEPTIN9 (p≤10−5, ST29). Functional support was also sought from existing glomerular and tubular expression data alongside eGFR and fibrosis in both blood and kidney biopsy tissue using data ascertained from the 450K array (all p<0.05)(24,48). Seven differentially methylated genes were replicated in the glomerular database and six in the tubular (ST29; Table 2).
Summary results, highlighting top-ranked dmCpGs, GO enrichment functions and pathways per analysis.
Replication analysis
We have examined the association between the methylation of top ranked CpGs and kidney function from this study and previous studies which had been performed on subjects with T2DM, including cohorts with blood sample methylome analysis and others where methylation was studied in micro-dissected human kidney tubule samples. We confirmed nominally significant association with kidney function at the CUX1, PTPRN2 and SEPTIN9 locus and with kidney function decline at AFF3, HDAC4 and SEPTIN9 regions. Furthermore, the methylation level at the AFF3, CUX1 and PIM1 regions correlated with the degree of fibrosis in micro-dissected human kidney tissue samples.
Summary
A summary of results is included within Table 2, SF15 and SF16, including specific details regarding the strongest biologically plausible candidates linked to T1DM-ESKD, the GO functions and pathways. Table 2 highlights the top-ranked genes and pathways of interest and states the number of significant results from each section of the analysis.
Discussion
Epigenetic alterations provide a dynamic link between genetic background and environmental exposures. These alterations have been proposed to play an important role in kidney disease (20,23) and T1DM (49). Previous research assessing T1DM-DKD (19–22,50) has identified dmCpGs using bisulphite pyrosequencing and either the Illumina Infinium 450K or 27K methylation arrays. This manuscript describes differences in DNA methylation patterns between individuals with T1DM and those with T1DM-ESKD, utilising the MethylationEPIC array technology.
Several top-ranked dmCpGs identified through this study showed an increase in FC related to the more severe phenotype of T1DM-ESKD compared to the T1DM control population.
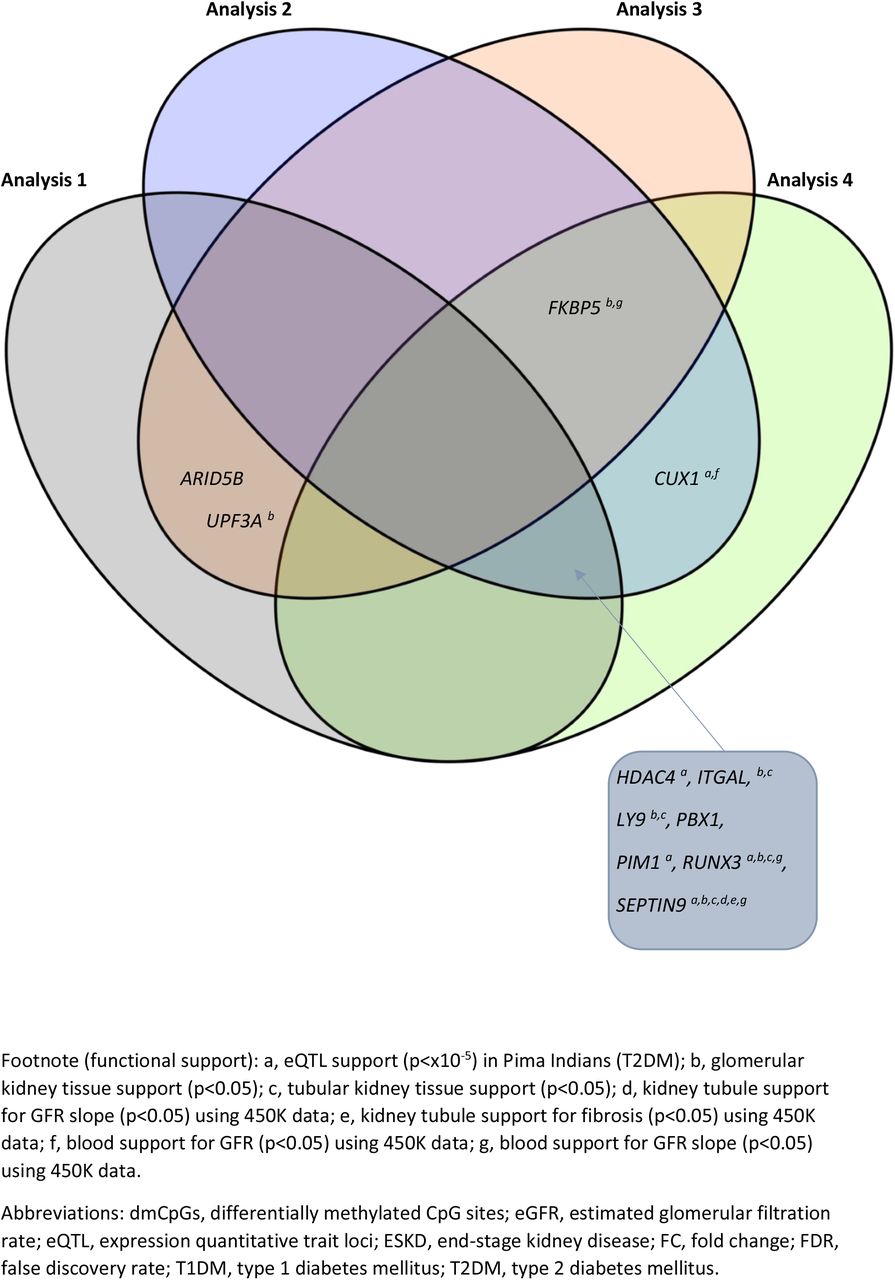
The genes from each analysis with the most biological plausibility having assessed the literature, are included in Table 2 and SFs 14 and 15. Of the 16 genes in which dmCpGs were located with a significance level of FDR p≤×10−8, (SF14), 11 retained this status when the stringency level was increased (FDR p≤×10−8 and FC±2; SF15). DmCpGs were located within FKBP5 and RUNX3 in each of the analyses where FDR p≤×10−8. When the stringency was increased (FDR p≤×10−8 and FC±2), they remained top-ranked genes in all but Analyses 1 and 3 respectively.
FKBP5, also known as FK506 binding protein 51, acts as a co-chaperone of hsp90 to aid the modulation of glucocorticoid receptor sensitivity in response to stress (51,52). Polymorphisms in this gene lead to an extended stress hormone response following exposure (51). Recently, genome-wide analyses of human blood found associations between FKBP5 mRNA and a pro-inflammatory profile (53). Moreover, aberrant FKBP5 methylation has previously been implicated in the pathology of numerous diseases, particularly in diseases common in older populations. This hypermethylation is exemplified in myocardial infarction (53) and conditions such as T2DM (54) and CKD (20). All top-ranked dmCpGs within this gene were located in either the gene body or 5’ UTR and showed increased methylation for individuals with T1DM-ESKD. As a hallmark feature of CKD is persistent, low to moderate levels of circulating inflammatory markers (55), with distinguishing features such as nephron loss with subsequent acceleration of organ fibrosis, further study is required to determine if FKBP5 plays a mechanistic role in CKD development.
The runt related transcription factor 3 (RUNX3) plays a downstream role in the TGF-β signalling pathway (56). Its suppression has been implicated in tumour growth, migration and invasion (57). In 2019, Cen et al., reported that higher methylation levels in RUNX3 were associated with a shorter renal cell carcinoma survival time (58). Additionally, they suggested independent predictors of heightened methylation levels of this gene included the presence of intra-tumour vascularity. We identified increased FC in dmCpGs within the RUNX3 gene body and the UTRs in association with T1DKD-ESKD.
As indicated in SF15, a further six genes, HDAC4, ITGAL, LY9, PBX1, PIM1 and SEPTIN9 had top-ranked dmCpGs from three of the four analyses. These genes did not reach statistical significance in Analysis 3, which had the smallest population which compared DNA methylation patterns in 73 individuals with T1DM-ESKD (transplant only) to 73 individuals, matched, with T1DM.
Histone deacetylases (HDACs) are a group of enzymes that are characterised into three defined classes, known as I, II and III (59,60). They each have roles in removal of acetyl groups from histone and non-histone proteins, chromatin condensation and transcriptional repression (59,60). They have the ability to impact cellular function via both epigenetic and non-epigenetic mechanisms (60). HDAC4 (a member of class II) was reported to reduce kidney injury during in vivo animal studies (59–61). Additionally, HDAC4 was found to be over-expressed in kidney epithelial cells of a murine kidney fibrosis model (62). Subsequent treatment with HDAC inhibitors demonstrated that the development and progression of kidney fibrosis can be inhibited by suppressing the activation and expression of numerous pro-fibrotic molecules, such as fibronectin and collagen 1 (62). In the present study, HDAC4 showed an increased FC for all dmCpGs except cg25569341 in individuals with ESKD undergoing dialysis or who had undergone a transplant.
Integrins are integral membrane proteins which are heterodimeric in nature. They are comprised of alpha and beta chains which together form the integrin lymphocyte function-associated antigen-1, expressed in leukocytes. ITGAL encodes the alpha L chain and its expression has been previously linked to renal cell carcinoma (63). A second report has demonstrated that DNA methylation of the ITGAL gene is heavily methylated in fibroblasts and demethylated in T lymphocytes (64). The top ranked dmCpGs present within the gene body or north shelf of ITGAL showed an increase in FC in individuals with T1DM-ESKD who were immunosuppressed following transplantation, compared to those with T1DM with no evidence of kidney disease.
Lymphocyte antigen 9 (LY9) is a member of the signalling lymphocyte activation molecule family receptor and is involved in immune responses. In 2019, Parikova et al. (65) reported expression of LY9 to be significantly increased in individuals receiving long-term dialysis compared to those who had received dialysis over a shorter time period. Our findings support these observations showing an increased FC in LY9 dmCpGs located within either the gene body or 5’ UTR in individuals with T1DM-ESKD compared to those with no kidney disease.
PBX1 encodes a nuclear protein within the PBX homeobox family of transcription factors. Through this it can affect the expression of several genes including those which regulate insulin action and glucose metabolism (66). In the current study, dmCpGs within the PBX1 gene body showed a consistent decrease in FC at the highest stringency level (FDR p≤×10-8, FC ±2) in individuals with T1DM-ESKD across each of the four analyses. Previous analyses of this gene have linked differential methylation patterns to higher birth weight-for-gestational age (67) and a translocational rearrangement of this gene and TCF3/E2A has been associated with B-cell acute lymphoblastic leukaemia (68). Additionally, PBX1 haploinsufficiency has been linked to congenital anomalies of the kidney and urinary tract (69), reported to be involved in the proliferation of cells in renal cell carcinoma (70) and has been recognised as a candidate gene for T2DM (66,71).
PIM1 belongs to the serine/threonine kinase family (72) and its overexpression has previously been implicated in diseases such as ovarian cancer (73) and breast cancer (74). Overexpression of PIM1 appears to influence cancer development in three ways; preventing apoptosis, enhancing cellular proliferation and through promoting genomic instability (75). More specific to kidney research, PIM1 is aberrantly overexpressed in renal cell carcinoma (76) and lupus nephritis (77). In this analysis we identified top-ranked dmCpGs present within the 3’ UTR and north shore of PIM1 which resulted in an increase in the FC in individuals with T1D-ESKD.
Septins are a group of GTPase proteins that play a role in cytoskeleton organisation through their links with microtubules and actin filaments (78). Although some septins are associated with the advancement of kidney fibrosis (78), SEPTIN9 specifically has been implicated in a host of disease pathologies, such as prostate cancer (79), colorectal cancer (80), liver fibrosis (81) and T2DM (82). Moreover, SEPTIN9 overexpression has been shown to promote kidney epithelial cell migration (83). Additionally Dayeh et al. reported SEPTIN9, alongside PTPRN2, as one of the top-ranked differentially methylated genes when comparing pancreatic islets from individuals with and without T2DM (84). In this analysis, 20 dmCpGs were located in SEPTIN9, 17 of which displayed an increase in FC in individuals with T1DM-ESKD.
An additional three top-ranked genes which contained dmCpGs were common in two analyses; ARID5B and UPF3A, which were identified from Analyses 1 and 3, and CUX1 which resulted from Analyses 2 and 4 (FDR p≤×10−8 and FC±2; SF15).
Each of the dmCpGs within ARID5B were located within the gene body and all were consistently increased in cases with ESKD (both chronic dialysis and transplant recipients) compared with controls with long duration of T1DM and no evidence of kidney disease. It has been previously demonstrated that ARID5B has a regulatory role in the phenotypic change of smooth muscle cells and SNPs within ARID5B have been linked to T2DM and coronary artery disease (85). Differential methylation of a six-probe region spanning 99 base pairs within ARID5B gene has also been reported in Alzheimer’s disease (86). ARID5B is also known to contribute to cell growth, the differentiation of B-lymphocyte progenitors and has additionally been linked to acute lymphoblastic leukaemia (87–89).
UPF3A encodes a protein involved in mRNA nuclear export and mRNA surveillance, it has a crucial role in downregulating aberrant mRNAs (90). Gotoh et al. in 2014 reported that this gene alongside 14 others had significantly reduced mRNA expression levels in renal cell carcinoma compared to non-cancerous kidney cortex tissue (91). Top-ranked dmCpGs present within UPF3A consistently displayed an increase in FC within individuals with T1DM and ESKD.
CUX1 is a protein coding member of the homeodomain family of DNA binding proteins and is involved in cell cycle regulation and kidney development through the inhibition of p27 which promotes cell proliferation in the nephrogenic zone (20,92,93). Previously, significant DNA methylation alterations have been reported in CKD where more than one dmCpG site was located within CUX1 compared to individuals with no evidence of kidney disease (20). Additionally, genetic abnormalities within CUX1 have been linked to polycystic kidney disease (94) and myelodysplastic syndrome (95) in mouse models. Significant dmCpGs from Analyses 2 and 4 were located within the body of this gene which additionally showed an increase in FC in individuals with T1DM-ESKD, but this gene has not previously been explored in individuals post kidney transplant.
Lastly, an additional five genes with biological plausibility for ESKD had statistical significance for this phenotype but did not show a large change in methylation (FC±2); AFF3, ELMO1, PRKAG2, PTPRN2 and TAMM41 (SF14, FDR p≤×10−8). These genes contained dmCpGs from either one (PRKAG2, PTPRN2 and TAMM41), two (ELMO1) or three analyses (AFF3).
In 2012, the GENIE consortium conducted a meta-analysis of GWAS in T1D-DKD, which revealed an intronic SNP (rs7583877) located in the AF4/FMR2 family member 3 (AFF3) gene as significantly associated with ESKD (14,96). Functional studies have indicated that AFF3 influences kidney tubule fibrosis through the TGF-β1 pathway (14). The findings from our study show increased methylation levels in the dmCpGs within the body of AFF3 in the individuals with T1D-ESKD, which could result in decreased gene expression. A link between DNA methylation of this gene and T1DM has previously been considered as a mediator of the genetic risk (97). Each of the top-ranked dmCpGs identified from this analysis were present within the body of AFF3 with increased methylation in individuals with T1DM-ESKD.
ELMO1 encodes a member of the engulfment and cell motility protein family and has been previously linked to T2DM (98–100), hepatocellular carcinoma (101) and inflammatory arthritis (102). Previous methylation analyses of this gene have shown associations with gastric cancer (103) and CKD (20). The eight top-ranked dmCpGs within ELMO1 were present within various regions of the gene and each dmCpG site reported an increase in the FC in individuals with T1DM-ESKD. One hypermethylated dmCpG site, cg01119452, had been previously reported in 2014, where it also showed hypermethylation in its association with CKD (20).
PRKAG2 is an important regulator of cellular energy status and has previously been associated with eGFR (104). SNP rs7805747 located in PRKAG2 has been reported in association with both CKD and serum creatinine at genome-wide significance level (105). Differential methylation within this gene has also previously been reported in association with CKD (20). The top-ranked dmCpGs were present within the 5’ UTR or body of PRKAG2 and each showed an increase in FC in individuals with T1DM-ESKD compared to those with no evidence of kidney disease.
Identified as an auto-antigen in diabetes, PTPRN2 has previously been linked to CKD (20,106), fasting plasma glucose and obesity (107). PTPRN2 encodes islet antigen (IA)-2β and together with IA-2, these are integral membrane proteins of dense core vesicles which are expressed throughout the body in neuroendocrine cells (108). PTPRN2 was reported by Dayeh at el. as second of the top-ranked differentially methylated genes in a comparison of pancreatic islets from individuals with and without T2DM (84). Each of the dmCpGs present within PTPRN2 showed a consistent increase in FC in association with T1DM-ESKD.
The function of TAMM41 in higher vertebrates still remains largely undetermined, yet it is known to play a critical role in yeast cell mitochondrial membrane maintenance (109). Using zebrafish models of human CVD, it was determined that the developing heart overexpressed tamm41 (109,110). Furthermore, CRISPR/Cas9 mediated knockout of the tamm41 gene resulted in immature heart valve formation (109). Differential methylation in TAMM41 has previously been reported in both DKD and ESKD (22).
Several of the top-ranked pathways and genes defined by dmCpGs have been previously linked to leukaemia. This is not unexpected as an elevated risk of leukaemia during dialysis and after transplant failure has previously been reported in an Australian and New Zealand population (111,112). Although rare, Alfano et al. suggested that leukaemia can occur during the post-transplant period (113).
In the absence of a complementary replication cohort with available data, further support for top-ranked genes was sought from eQTL analysis from an American Indian cohort where the individuals had T2DM and known renal status (47). eQTL analysis supports associations for eight of the top-ranked genes; CUX1, ELMO1, HDAC4, PIM1, PRKAG2, PTPRN2, RUNX3, SEPTIN9 (p≤10−5, ST29). Functional support was also generated for these top-ranked markers in kidney tissue (glomerular tissue and tubule tissue from two cohorts (47,48)) alongside replication in additional blood derived DNA from individuals with kidney function assessed using the 450K array (unpublished data)(48). Unfortunately, the 450K array for DNA methylation includes <25% of the top-ranked dmCpGs identified by our study which used the more comprehensive EPIC array. It is not unexpected that the dmCpGs did not correlate across all top-ranked results due to the differences in material and technologies employed.
Through this analysis we have demonstrated that similar association results are reported for individuals who have received a kidney transplant or persons who are receiving dialysis. This clearly shows that transplant recipients can be analysed alongside individuals receiving dialysis to increase the power of future EWAS for ESKD. The results; genes, p-values and FC directions are consistent across each of the four analyses. RPTOR is the only top-ranked gene linked to immunosuppressant medication for transplants (114).
We have reported associations with several biologically plausible genes. Employing a considered approach, including four analyses (two of which were matched and two were unmatched), we show broad overlap in results from the analyses. This indicates that for future large-scale studies, it is not essential to stratify this analysis by age and sex matching the participants, which will facilitate a larger, more powerful case-control design.
Strengths and Limitations
Overall, this study has several strengths. We have carefully defined phenotypes for each analysis, ensuring individuals were well matched for paired Analyses 1 and 3, with a larger cohort of individuals employed for unmatched Analyses 2 and 4. Analyses 3 and 4 represented an extension of the initial analyses to evaluate the differences between individuals with T1DM and DKD compared to those with a more extreme phenotype who had progressed to T1DM-ESKD and had received a kidney transplant.
We have extended previous investigations through assessing T1DM-ESKD using the most cost-effective high-density methylation array available, the Infinium MethylationEPIC (115). Methylation signatures were assessed using peripheral blood samples, while considering estimates of proportional WCCs and cell heterogeneity. Furthermore, only top-ranked dmCpGs that met a significance level of FDR p≤×10−8 were reported, a threshold previously reported to reduce the rate of false-positives in studies which use the Infinium MethylationEPIC array (116). This array solely focuses on the presence of methylation at CpG sites and does not take non-CpG site methylation into consideration.
This study is limited in not having a complementary replication cohort, however we took the approach that a larger discovery cohort using the most comprehensive array commercially available was the optimal study design given similar kidney transplant cohorts do not have EPIC array data available for replication. While we have provided details of all dmCpGs with FDR p≤×10−8 and FC±2 in supplementary material, this manuscript focuses mainly on genes that have previously been linked to similar phenotypes in the literature. A larger-scale multi-omic analysis incorporating genetic variation, epigenetic alterations and gene expression would be required to further determine the markers of interest for this phenotype and improve understanding of the biological mechanisms involved. Additional investigations could be undertaken to assess this phenotype in different ethnicities, sex-specific effects, and analyses could be conducted to compare these results with those derived from kidney biopsy samples.
Conclusion
Epigenetic alterations, unlike genetic changes, are potentially reversible, offering opportunistic therapeutic interventions. We have reported associations between dmCpGs and genes with T1DM-ESKD, several of which suggest complementary genetic and epigenetic influences to alter gene expression. Eight top-ranked genes also showed eQTL support in a T2DM American Indian cohort and 13 were supported by gene expression and / or methylation data from kidney tubule or glomerular tissues. Additional prospective studies may help identify whether the underlying methylation influences are causal or consequential.
The identification of unique epigenetic profiles associated with developing ESKD could highlight additional biological mechanisms to study kidney disease. Epigenetic profiles may also help to identify patients at greater risk for progression to ESKD. Targeting healthcare resources to individuals at highest risk for ESKD remains an important clinical goal.
Funding Details
LJS is the recipient of a Northern Ireland Kidney Research Fund Fellowship (NIKRF).
The GEnetics of Nephropathy an International Effort (GENIE) through the Medical Research Council (MC_PC_15025), Public Health Agency R&D Division (STL/4760/13), Science Foundation Ireland (SFI15/US/B3130), NIH R01_DK081923 and R01_DK105154. LJS, KA, APM and AJM, are also supported by Science Foundation Ireland and the Department for the Economy, Northern Ireland US partnership award 15/IA/3152. The data referenced for the NICOLA cohort were funded by Economic and Social Research Council - Award Reference ES/L008459/1. CG, EB and DA are supported by SFI Award15/IA/3152, the US Ireland R&D partnership and a strategic grant from the JDRF. This study was supported, in part, by the George M. O’Brien Michigan Kidney Translational Core Center, funded by NIH/NIDDK grant 2P30-DK-081943 and by the Intramural Research Program of NIDDK. None of the funding bodies had a role in the study design or analysis.
Declaration of interest statement/Disclosure statement
The authors declare that they have no completing interests.
Ethics
Research ethics approval was obtained from the South and West Multicentre Research Ethics Committee (MREC/98/6/71). All participants provided written informed consent for research. No individual level data is being reported in this manuscript.
Figures with the corresponding legend below each one
All Supplementary Figures are provided in the separate MS Word document
Supplementary Figures
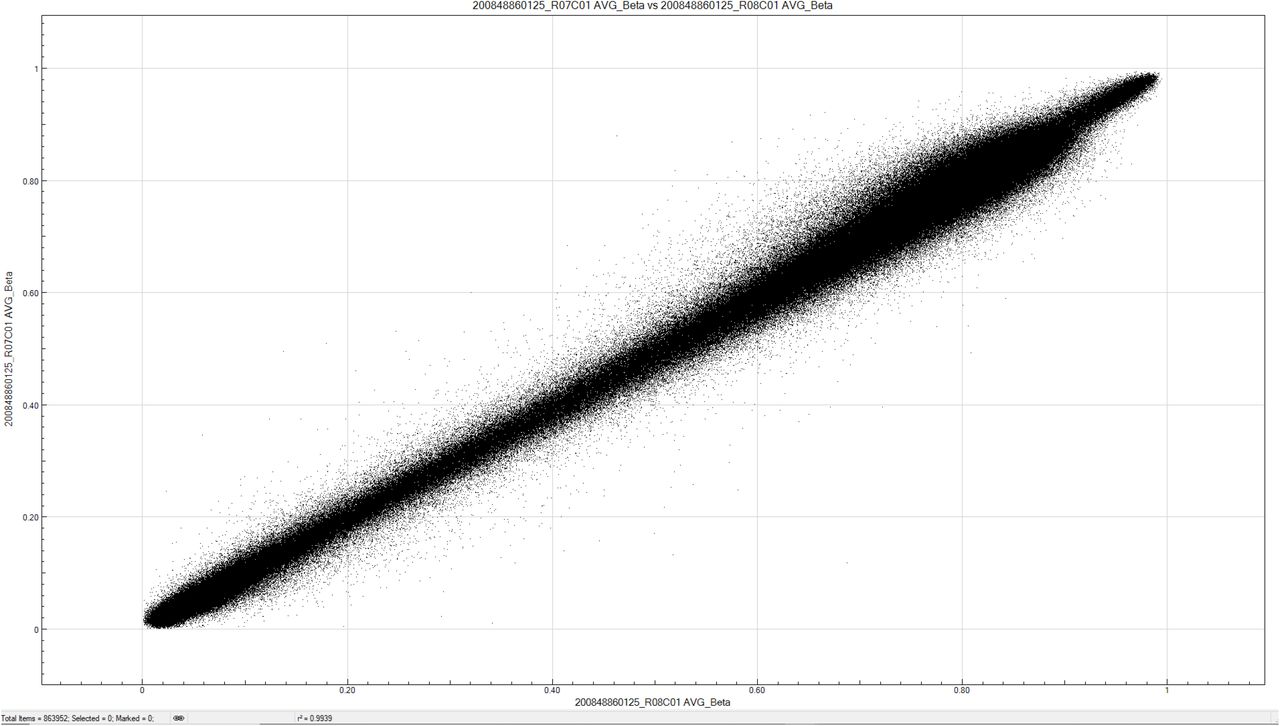
Representative concordance plots for a duplicate sample pair - average r2 for seven duplicates = 0.99.

GO enrichment results for Analysis 1. Enrichment of top-ranked CpG sites for matched individuals with T1DM-ESKD (n=107) vs. T1DM (n=107): (FDR p-value ≤×10−8 and FC ≥±2). These gene classes are over-represented in the disease phenotype compared to a control gene set.

GO enrichment results for Analysis 2. Enrichment of top-ranked CpG sites for matched individuals with T1DM-ESKD (n=107) vs. T1DM (n=253): (FDR p-value ≤×10−8 and FC ≥±2). These gene classes are over-represented in the disease phenotype compared to a control gene set.

GO enrichment results for Analysis 3. Enrichment of top-ranked CpG sites for matched individuals with T1DM-ESKD (n=73) vs. T1DM (n=73): (FDR p-value ≤×10−8 and FC ≥±2). These gene classes are over-represented in the disease phenotype compared to a control gene set.

GO enrichment results for Analysis 4. Enrichment of top-ranked CpG sites for matched individuals with T1DM-ESKD (n=73) vs. T1DM (n=253): (FDR p-value ≤×10−8 and FC ≥±2). These gene classes are over-represented in the disease phenotype compared to a control gene set.

Heatmap of discovery dmCpGs in blood samples derived from T1DM ESKD versus T1DM individuals. Depicted dmCpGs are significant (p<0.05) in Analyses 1-4.
Red = Hypermethylated; Blue = Hypomethylated.

STRING analysis of genes which showed an increase in FC in individuals with T1D-ESKD from Analysis 1: matched individuals with T1DM-ESKD (n=107) vs. T1DM (n=107): FDR p≤×10−8 and FC±2 (ST4)

STRING analysis of genes which showed a decrease in FC in individuals with T1D-ESKD from Analysis 1: matched individuals with T1DM-ESKD (n=107) vs. T1DM (n=107): FDR p≤×10−8 and FC±2 (ST4)

STRING analysis of genes which showed an increase in FC in individuals with T1D-ESKD from Analysis 2: individuals with T1DM-ESKD (n=107) vs. T1DM (n=253): FDR p≤×10−8 and FC±2 (ST10)

STRING analysis of genes which showed a decrease in FC in individuals with T1D-ESKD from Analysis 2: individuals with T1DM-ESKD (n=107) vs. T1DM (n=253): FDR p≤×10−8 and FC±2 (ST10)

STRING analysis of genes which showed an increase in FC in individuals with T1D-ESKD from Analysis 3: matched individuals with T1DM-ESKD (n=73) vs. T1DM (n=73): FDR p≤×10− 8 and FC±2 (ST17)

STRING analysis of genes which showed a decrease in FC in individuals with T1D-ESKD from Analysis 3: matched individuals with T1DM-ESKD (n=73) vs. T1DM (n=73): FDR p≤×10− 8 and FC±2 (ST17)
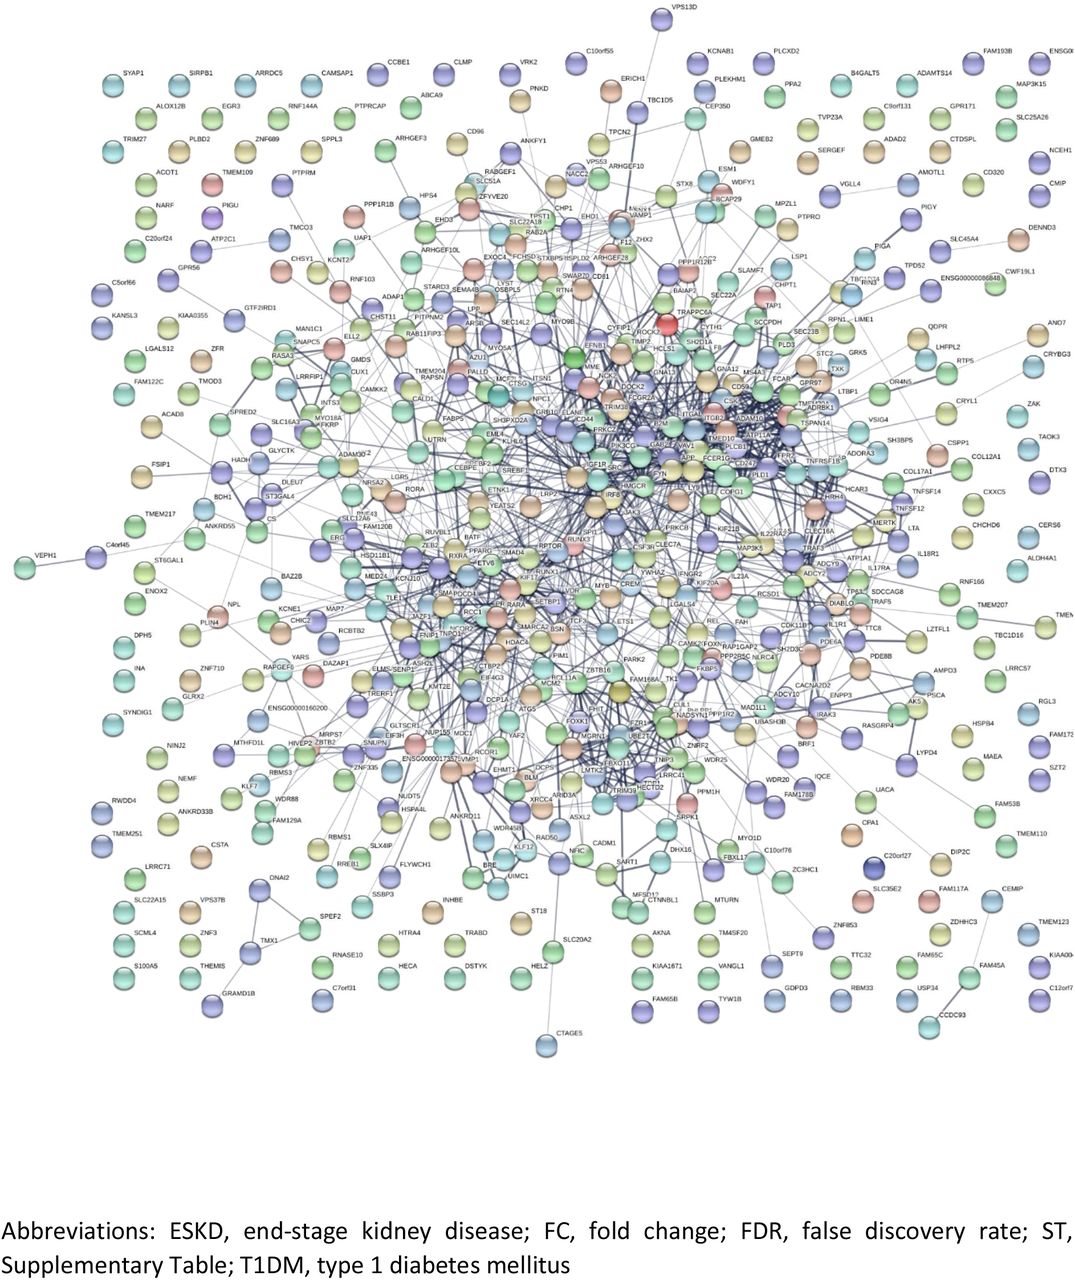
STRING analysis of genes which showed an increase in FC in individuals with T1D-ESKD from Analysis 4: individuals with T1DM-ESKD (n=73) vs. T1DM (n=253): FDR p≤×10−8 and FC±2 (ST23)

STRING analysis of genes which showed a decrease in FC in individuals with T1D-ESKD from Analysis 4: individuals with T1DM-ESKD (n=73) vs. T1DM (n=253): FDR p≤×10−8 and FC±2 (ST23)
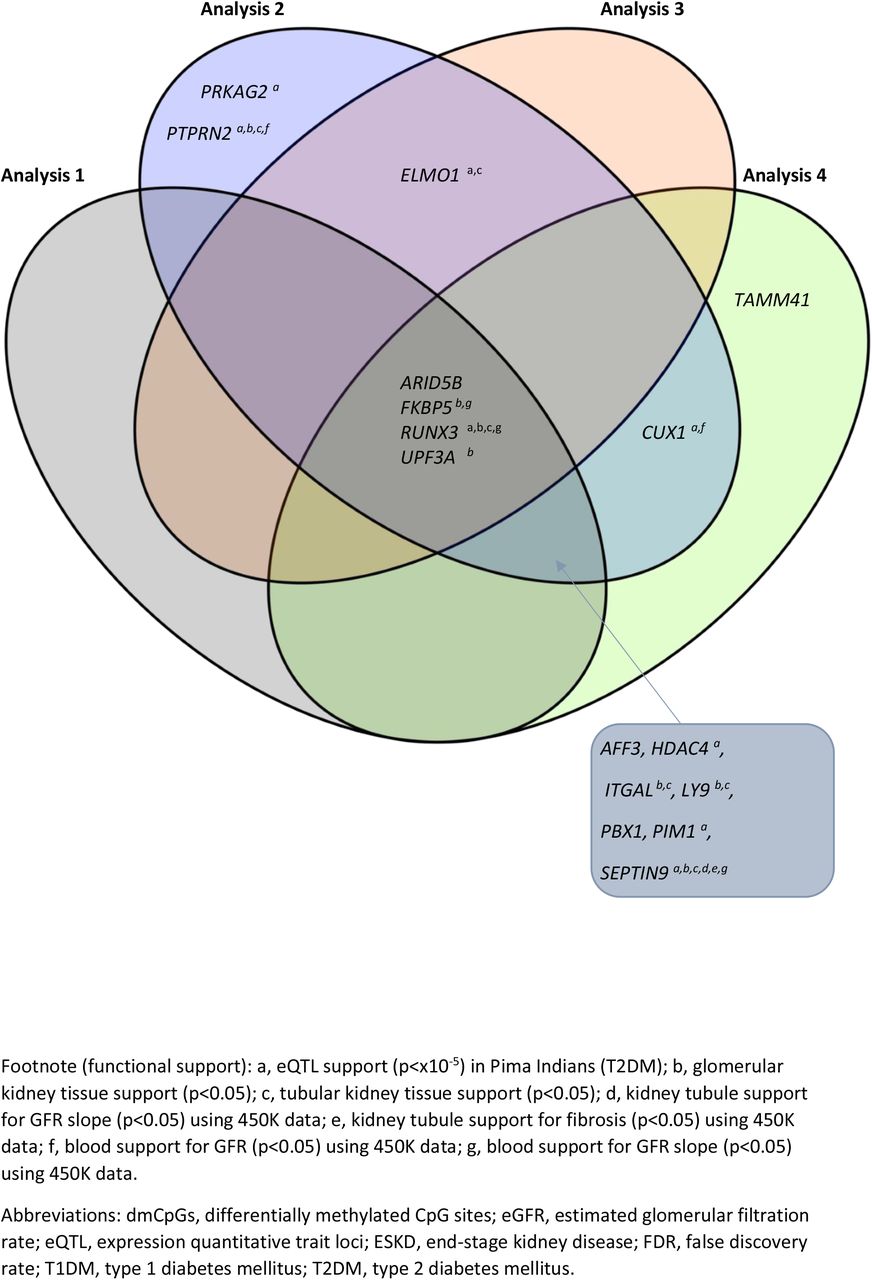
Venn diagram highlighting the genes in which top-ranked dmCpGs were located in individuals with T1DM-ESKD vs. T1DM (FDR p≤×10−8)

Venn diagram highlighting the genes in which top-ranked dmCpGs were located in individuals with T1DM-ESKD vs. T1DM (FDR p≤×10−8 and FC ±2)
Acknowledgements
We thank all individuals who participated in this study and acknowledge all physicians and nurses who were involved in their recruitment.
The GENIE_UK data includes samples recruited as part of the Warren3/U.K. GoKinD Study Group, jointly funded by Diabetes UK and the Juvenile Diabetes Research Foundation and includes the following individuals: Professor A.P. Maxwell, Dr. A.J. McKnight, Dr. D.A. Savage (Belfast); Dr. J. Walker (Edinburgh); Dr. S. Thomas, Professor G.C. Viberti (London); Professor A.J.M. Boulton (Manchester); Professor S. Marshall (Newcastle); Professor A.G. Demaine and Dr. B.A. Millward (Plymouth); and Professor S.C. Bain (Swansea).
List of abbreviations
- BACR
- Bead Array Controls Reporter
- CKD
- chronic kidney disease
- DKD
- diabetic kidney disease
- dmCpGs
- differentially methylated
- eGFR
- estimated glomerular filtration rate
- eQTL
- expression quantitative trait loci
- ESKD
- end-stage kidney disease
- EWAS
- epigenome-wide association study
- FC
- fold change
- FDR
- false discovery rate
- GBM
- glomerular basement membrane width
- GENIE
- GEnetics of Nephropathy an International Effort
- GO
- gene ontology
- GoKinD
- Genetics of Kidneys in Diabetes
- GWAS
- genome wide association studies
- HbA1c
- haemoglobin A1c
- HDACs
- histone deacetylases
- KEGG
- Kyoto Encyclopedia of Genes and Genomes
- NICOLA
- Northern Ireland Cohort for the Longitudinal Study of Ageing
- P_FEN
- percent of endothelial fenestration falling on the peripheral glomerular basement membrane
- PGS
- Partek Genomics Suite
- QC
- quality control
- SF
- supplementary figure
- ST
- supplementary table
- SV
- surface volume of peripheral glomerular basement membrane per glomerulus
- T1DM
- type 1 diabetes mellitus
- T2DM
- type 2 diabetes mellitus
- VVINT
- cortical interstitial fractional volume
- VVMES
- mesangial fractional volume
- VVPC
- volume fraction of podocyte cell per glomerulus
- WCCs
- white cell counts
References
- 1.↵
- 2.↵
- 3.↵
- 4.↵
- 5.↵
- 6.↵
- 7.↵
- 8.↵
- 9.↵
- 10.↵
- 11.↵
- 12.↵
- 13.↵
- 14.↵
- 15.↵
- 16.↵
- 17.↵
- 18.↵
- 19.↵
- 20.↵
- 21.↵
- 22.↵
- 23.↵
- 24.↵
- 25.
- 26.↵
- 27.↵
- 28.↵
- 29.↵
- 30.↵
- 31.↵
- 32.↵
- 33.↵
- 34.↵
- 35.↵
- 36.↵
- 37.↵
- 38.↵
- 39.↵
- 40.↵
- 41.↵
- 42.↵
- 43.↵
- 44.↵
- 45.↵
- 46.↵
- 47.↵
- 48.↵
- 49.↵
- 50.↵
- 51.↵
- 52.↵
- 53.↵
- 54.↵
- 55.↵
- 56.↵
- 57.↵
- 58.↵
- 59.↵
- 60.↵
- 61.↵
- 62.↵
- 63.↵
- 64.↵
- 65.↵
- 66.↵
- 67.↵
- 68.↵
- 69.↵
- 70.↵
- 71.↵
- 72.↵
- 73.↵
- 74.↵
- 75.↵
- 76.↵
- 77.↵
- 78.↵
- 79.↵
- 80.↵
- 81.↵
- 82.↵
- 83.↵
- 84.↵
- 85.↵
- 86.↵
- 87.↵
- 88.
- 89.↵
- 90.↵
- 91.↵
- 92.↵
- 93.↵
- 94.↵
- 95.↵
- 96.↵
- 97.↵
- 98.↵
- 99.
- 100.↵
- 101.↵
- 102.↵
- 103.↵
- 104.↵
- 105.↵
- 106.↵
- 107.↵
- 108.↵
- 109.↵
- 110.↵
- 111.↵
- 112.↵
- 113.↵
- 114.↵
- 115.↵
- 116.↵


