

ABSTRACT
Antibiotic resistance has become a major public health concern as bacteria evolve to evade drugs, leading to recurring infections and a decrease in antibiotic efficacy. Systematic efforts have revealed mechanisms involved in resistance; yet, in many cases, how these specific mechanisms accelerate or slow the evolution of resistance remains unclear. Here, we conducted a systematic study of the impact of the AcrAB-TolC efflux pump and its expression on the evolution of antibiotic resistance. We mapped how population growth rate and resistance change over time as a function of both the antibiotic concentration and the parent strain’s genetic background. We compared strains lacking functional AcrAB-TolC efflux pumps, the wild type strain, and those overexpressing the pumps. In all cases, resistance emerged when cultures were treated with chloramphenicol concentrations near the MIC of the parent strain. Strains grown in concentrations just above the MIC were the most prone to evolving high levels of drug resistance, in some cases reaching values that far exceed the concentrations they were treated with. The genetic background of the parent strain also influenced resistance acquisition. The strain overexpressing pumps evolved resistance more slowly and at lower levels than the wild type strain or the strain lacking functional pumps. In contrast, the wild type strain rapidly achieved resistance through mutations in pump genes and their associated regulators. Overall, our results suggest that treatment conditions just above the MIC pose the largest risk for the evolution of resistance, and precise control of pump expression levels accelerates this process.
IMPORTANCE Combatting the rise of antibiotic resistance is a significant challenge. Efflux pumps are an important contributor to drug resistance, and they exist across many cell types and can export numerous classes of antibiotics. Cells with efflux pumps can regulate pump expression to maintain low intracellular drug concentrations. Here, we explored a three-dimensional evolutionary landscape, in which we mapped how resistance emerged depending on the antibiotic concentration, the presence of efflux pumps and their regulators, and time. We found that treatments just above the antibiotic concentration that inhibits growth of the parent strain were most likely to promote resistance, but that efflux pump levels influence the severity of these outcomes. These results indicate that there are specific treatment regimens and strain backgrounds that are especially problematic for the evolution of resistance.
INTRODUCTION
Despite the new wave of antibiotic discovery (1–5), bacteria continue to acquire resistance shortly after the introduction of new drugs for medicinal and industrial applications (6, 7). This is due in large part to the overuse of antibiotics, which results in pressures that drive resistance (8). With limited novel antibiotics and numerous futile antibiotics, doctors and scientists alike are presented with the challenge of how to best treat infections while keeping the evolution of resistance in check.
Adaptive evolution studies have begun exploring how certain antibiotic pressures influence the evolution of resistance. For instance, studies using a ‘morbidostat’—a continuous culture device that dynamically adjusts antibiotic concentrations to inhibitory levels—have found numerous targets that can be readily mutated to promote resistance (9–11), as well as identifying how drug switching can limit the evolution of resistance (12). While these studies have provided pivotal insights for this field, the morbidostat design causes antibiotic concentrations to rise to levels that exceed clinically relevant concentrations due to toxicity for patients (13). In recognition of the drug concertation-dependent nature of evolution, researchers have begun to explore bacterial evolution under treatment conditions with lower antibiotic concentrations as well. Wistrand-Yuen et al. found that bacteria grown in sub-inhibitory drug concentractions were still able to achieve high levels of resistance (14–16). Notably, the study identified that the same antibiotic produced unique evolutionary pathways when cells were treated with sub-inhibitory concentrations as opposed to inhibitory concentrations (14).
One limitation of current studies within the field is that they can be difficult to compare due to variations in experimental parameters, such as species, antibiotics, or other experimental conditions (17). Given the unique evolutionary pathways at different antibiotic concentrations, systematic mapping of these evolutionary landscapes could provide an improved understanding of which conditions pose the highest risk by allowing direct comparisons between different antibiotic concentrations. For instance, evolution experiments that were conducted using a range of concentrations for beta-lactams (18) and erythromycin (19) have highlighted the concentration-dependent adaptability of Escherichia coli.
There are many mechanisms by which antibiotic resistance can be achieved, including enzymatic inactivation, alteration of antibiotic binding sites, and increased efflux or reduced influx of antibiotics (20, 21). Efflux pumps are omnipresent in prokaryotic and eukaryotic cells alike, and are an important contributor to multi-drug resistance (22). AcrAB-TolC in E. coli is a canonical example of a multi-drug efflux pump, providing broad-spectrum resistance and raising the MIC of at least nine different classes of antibiotics (23). The pump is composed of three types of proteins: the outer membrane channel protein, TolC; the periplasmic linker protein, AcrA; and the inner membrane protein responsible for substrate recognition and export, AcrB (22). Using the proton motive force, AcrB actively exports antibiotics from the cell (22, 24). The presence of AcrAB-TolC efflux pumps can increase a strain’s MIC from ~2-fold to ~10-fold, depending on the antibiotic (25–27). Furthermore, genes associated with these multi-drug resistant efflux pumps, including their local and global regulators, are common targets for mutation as strains evolve high levels of drug resistance (15, 28–31).
Recent studies have indicated that in addition to providing modest increases in the MIC due to drug export, pumps can also impact mutation rate and evolvability of strains, which may ultimately be more important for the acquisition of high levels of drug resistance. For example, heterogeneity in efflux pump expression can predispose subsets of bacterial populations to mutation even prior to antibiotic treatment (32). In addition, deleting genes associated with efflux pumps can also reduce evolvability under antibiotic exposure (33). These studies provoke the question of how efflux pumps, and their expression levels, can serve to promote or attenuate the evolution of drug resistance. To address this, we mapped the progression of resistance over time for strains with and without efflux pumps and their native regulator.
Our overall goal in this study was to identify how antibiotic resistance emerges based on the antibiotic concentration, the parent strain’s genetic background, and the time since treatment. To achieve this, we used a turbidostat as an evolutionary platform (34) and treated cultures with a range of chloramphenicol concentrations. Chloramphenicol is often used as a last resort antibiotic in multi-drug resistant infections, as most clinical isolates are still susceptible to this drug (35, 36). We measured the effect of various genetic backgrounds with different pump expression levels. We conducted these tests in a strain lacking functional AcrAB-TolC efflux pumps (ΔacrB); in the wild type strain with the native regulatory network controlling AcrAB-TolC expression (WT); and in a strain with upregulated expression of the pumps (37), which lacks the local regulator AcrR (AcrAB+). We allowed the cultures to grow and evolve for 72 h in continuous culture while continuously recording growth rates. We periodically sampled the cultures and assessed the population’s resistance. We then charted the evolutionary landscapes under different antibiotic concentrations, genetic backgrounds, and through time and identified which circumstances gave rise to resistance.
RESULTS
In order to systematically evaluate the evolutionary landscape of efflux pump-mediated antibiotic resistance, we used the eVOLVER, a modular turbidostat capable of growing independent cultures in parallel (34). This platform allowed us to track a culture’s fitness by measuring growth rate continuously over multi-day experiments. In addition to this, we collected samples at selected intervals and, with these samples, performed antibiotic disc diffusion assays to assess the population’s resistance and spot assays to quantify the presences of high-resistance isolates within the population (Figure 1).
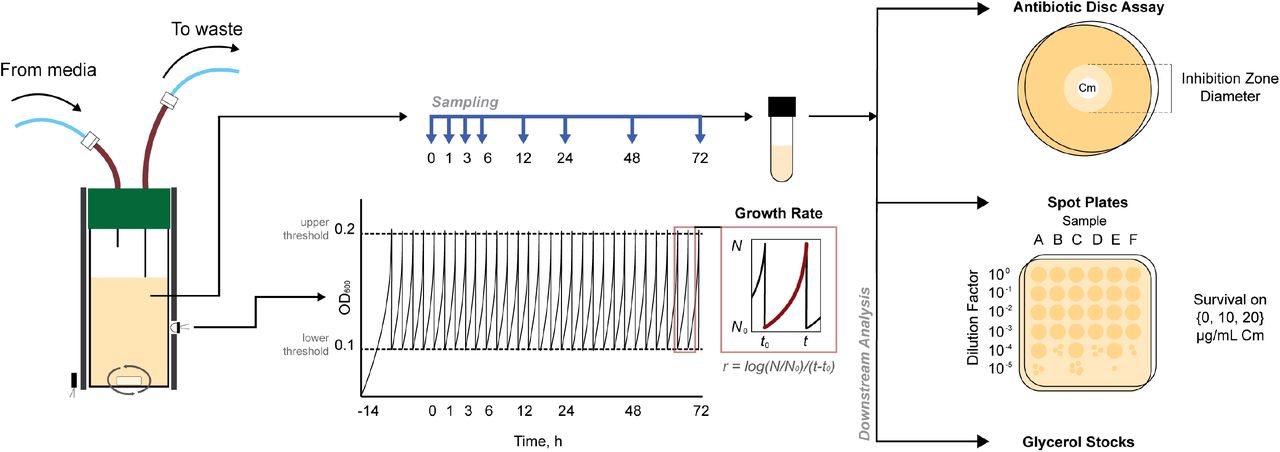
We used the eVOLVER, a modular turbidostat, as an evolutionary platform to measure and record absorbance data at 600 nm (OD600). We calculated growth rate after each dilution event and collected samples at defined timepoints (t = 0, 1, 3, 6, 12, 24, 48, 72 h). We performed antibiotic disc assays and spot assays for all samples.
We mapped growth rates over time for cultures subjected to a range of chloramphenicol treatment concentrations (Figure 2A & Figure S1). Treatment with high concentrations of chloramphenicol repressed bacterial growth for multiple days. We observed this growth inhibition for chloramphenicol concentrations >5x MIC0, where we define MIC0 as the MIC of the parent strain. Cultures grown in lower chloramphenicol concentrations were able to recover growth. For example, when we treated the bacterial populations with concentrations that were at or above MIC0 but below 5x MIC0, we observed a significant decrease in the growth rate between 0 and 12 h. However, after 12 to 24 h, growth in these populations was partially restored. Below MIC0, cultures were able to grow, though usually at a deficit compared to conditions without chloramphenicol. Growth recovery results for the three strains (ΔacrB, WT, and AcrAB+) were qualitatively similar when normalized by the MIC0 value. As such, complete growth inhibition occurred at a lower chloramphenicol concentration in the ΔacrB strain than in WT or AcrAB+, although overall recovery patterns were similar.

(A) Average growth rate. Growth rates are normalized to growth of strains at t = 0 h; for raw data see Figure S1. Lighter areas represent growth rates closer to pre-treatment values; darker areas represent reduced growth rates. MIC0 concentration is denoted with a bold dashed line for each strain (Figure S7). (B) Average resistance. Diameter of inhibition zones were plotted for each time and treatment. Smaller inhibition zones are shown in red and correspond to resistant cells (≤12 mm) and larger inhibition zones are shown in blue and represent susceptible cells (≥19 mm); intermediate inhibition is shown with color scale from orange to green. MIC0 is denoted with a bold dashed line. (C) Final resistance at 72 h based on treatment concentration normalized to MIC0. The calculated MICf is based on data from Figure S6. Data points show the mean of three biological replicates. Shaded error bars show standard deviation.
The growth rate results suggested the evolution of drug resistance within the population. To quantify this, we used an antibiotic disc assay to map the corresponding resistance levels (Figure 2B & Figure S2). We found distinct increases in resistance levels that corresponded to populations which recovered growth. While there were qualitative similarities for the three strains, the timing and level of resistance achieved was dependent on the strain background. The WT strain was able to rapidly achieve high levels of resistance for a broad range of chloramphenicol treatment concentrations. Resistance generally emerged within 12-24 h for concentrations that ranged from below MIC0 up to 5x MIC0. In contrast, the ΔacrB cells achieved resistance more slowly, but were ultimately able to reach levels of resistance comparable to the WT strain. Resistance acquisition for ΔacrB occurred within a comparatively small range of chloramphenicol concentrations, centered just above MIC0. The AcrAB+ strain, where efflux pumps are overexpressed, was able to evolve resistance, though this occurred more slowly and under a narrower range of treatment concentrations than in the WT strain.
To compare the ultimate resistance levels for the three strains, we calculated the final MIC of the populations at 72 h (MICf). We found that treatments concentrations ~2x MIC0 produced the most resistant populations (Figure 2C). The selective pressures of sub-inhibitory antibiotic concentrations have often been considered high-risk for the evolution of resistance (14, 38). Yet, our results indicated that concentrations near or just above MIC0 lead to the highest resistance levels in these conditions. While the range of raw chloramphenicol values that support the evolution of resistance varied between the strains, when we normalized by MIC0, AcrAB+ had the narrowest region of chloramphenicol concentrations that resulted in resistance. These results suggest that AcrAB+ has a reduced capacity to evolve resistance relative to the other strains.
We next asked how resistance and growth changed through time. We found that in the absence of antibiotics, the trajectories trended largely towards faster growth, with minimal changes to resistance levels (Figure 3). With sub-MIC0 chloramphenicol treatment, we observed that the populations first experienced a slight growth decrease, followed by increased resistance, and then restored growth within 48 h. While these populations did gain resistance, they did not tend to reach very high MICf values. In contrast, at 1x and 2x MIC0 chloramphenicol treatment, there was a more dramatic reduction in growth within the first 12 h. Though growth was impacted, the populations tended to walk towards high resistance during this period. As depicted in the schematics, the zig-zag patterns trending towards high resistance may be indicative of the cultures acquiring resistant mutations and compensating for the associated fitness costs of these mutations. Finally, bacteria treated with 10x MIC0 first became more susceptible and then stopped growing entirely within 12 h; growth was never restored for these populations. We found that strains from all three genetic backgrounds followed similar evolutionary trajectories while balancing the trade-off between growth and resistance. These findings highlight the importance of using antibiotic concentrations that are sufficiently inhibitory.

(A) Average diameter of inhibition zone and average growth rate plotted against each other. Lighter purple markers represent trajectories occurring earlier; darker purple are later timepoints. The longer the distance between markers, the greater the change between time points. (B) Schematics summarize patterns for each treatment concentration (xMIC0). Schematic plots show growth rate in terms of initial growth rate (GR0) and maximum physiological growth rate (GRmax). Resistance is shown in terms of relative diameter of inhibition, where D0 is the diameter of inhibition at t = 0 h and Dmin is the diameter of the antibiotic disc.
While these results tell us about the growth rate and resistance of the overall population, it is difficult to determine if sub-populations of cells within the culture have acquired high levels of resistance from disc assays alone. First, because the disc assays do not quantify resistance associated with individual cells in the culture, they cannot reveal the presence of subpopulations of resistant and susceptible cells. Second, beyond a certain resistance level, cells will grow up to the boundary of the disc; thus, it is not possible to quantify resistance increases beyond this. Determining which conditions can give rise to high levels of resistance is important for revealing particularly dangerous treatment regimes. In addition, sub-populations with increased resistance to one antibiotic can promote cross-resistance to other drugs (38).
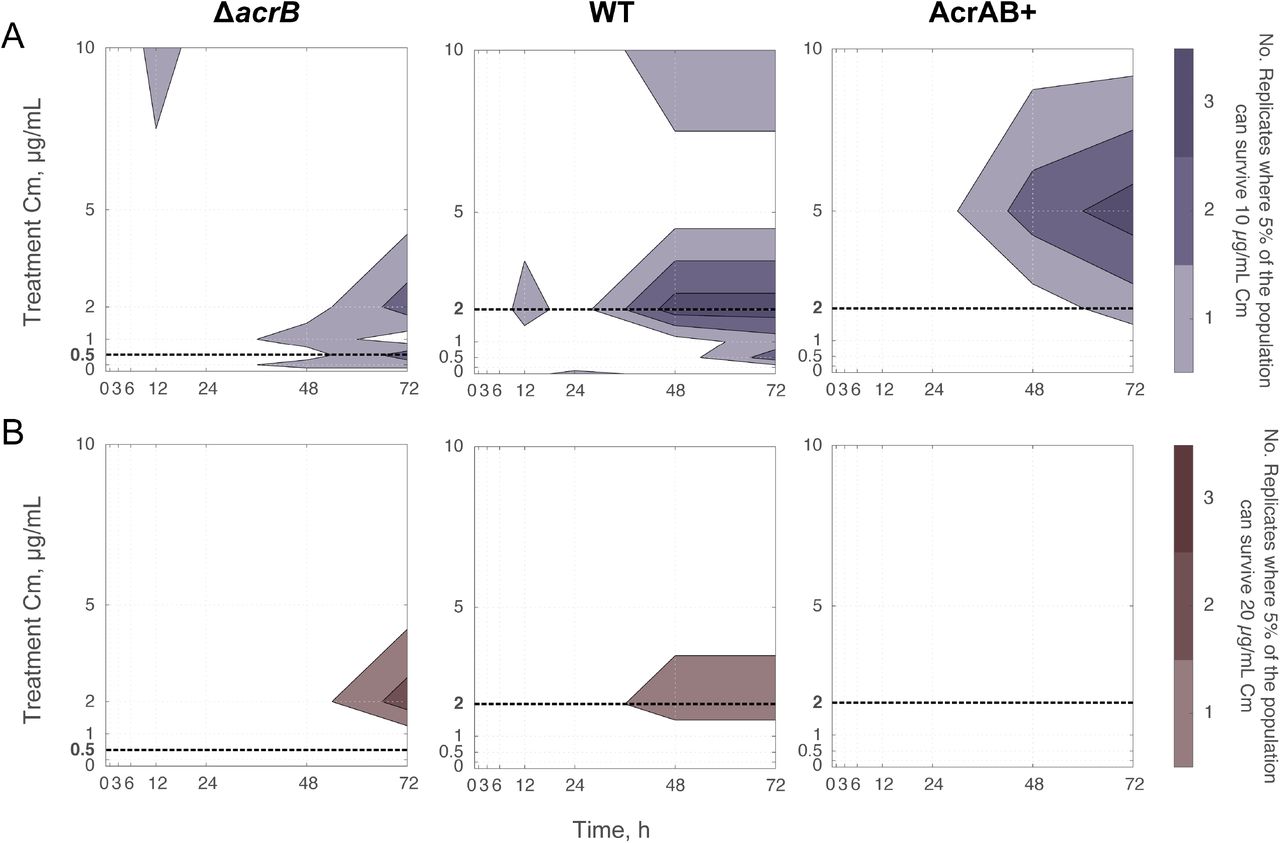
To quantify the fraction of resistant cells that emerged during our evolution experiment, we conducted a spot assay, in which we measured the fraction of the population capable of surviving on specific chloramphenicol concentrations. For all three strains, we observed sub-populations that were capable of growing on 10 μg/mL chloramphenicol (Figure 4A & Figure S3). Interestingly, these cells primarily emerged from treatment conditions with lower levels of chloramphenicol, and not from conditions where cells were subjected to 10 μg/mL chloramphenicol. For example, over 5% of the population from each of the three WT replicates that were treated at 2 μg/mL chloramphenicol could survive on 10 μg/mL at the end of the experiment. We did find cases where WT cells treated with 10 μg/mL evolved resistance to 10 μg/mL, however this was less common than in treatments near MIC0. Thus, cultures were able to evolve resistance to higher levels of chloramphenicol than they were subjected to, a feature that was most pronounced when treatments were just above or at MIC0. These results closely match trends in the population’s overall resistance (Figure 2B). We also found isolates capable of growing on 20 μg/mL chloramphenicol, with a reduced frequency relative to 10 μg/mL (Figure 4B & Figure S3-S4).
Number of biological replicates that had a subpopulation greater than 5% of their total population, which could grow on LB plates containing (A) 10 μg/mL or (B) 20 μg/mL chloramphenicol. Raw data is shown in Figure S3 and data for each replicate at 72 h is shown in Figure S4. Initial populations contained ~107 CFUs. MIC0 compared to treatment concentration is denoted with a bold dashed line (Figure S7).
Interestingly, the ΔacrB strain consistently produced sub-populations that were able to grow at 20 μg/mL (or 40x MIC0) chloramphenicol by 72 h. This sub-population appeared for chloramphenicol concentrations around 2 μg/mL. WT results followed a similar trend, with resistance to both 10 and 20 μg/mL chloramphenicol evolving by 72 h. In contrast, the AcrAB+ strain was capable of evolving resistance to 10 μg/mL when treated with chloramphenicol concentrations slightly above MIC0; yet, AcrAB+ never produced a sub-population that was able to grow on 20 μg/mL as the other strains did. These results were consistent with our findings that AcrAB+ is less prone to evolve high levels of resistance than the ΔacrB or the WT strains are.
A key question remained: which mutations were responsible for the increases in resistance we observed? To address this, we used whole genome sequencing to analyze three biological replicates from the 72 h timepoint for the WT strain (Figure S5). All of the sequenced isolates had a point mutation in the DNA binding region of marR, which can upregulate AcrAB-TolC efflux pumps and expression of other stress response genes (39). Additionally, two isolates had an IS1 or IS5 insertional sequence interrupting acrR, which would upregulate acrAB (40). The other isolate had a single point mutation in a periplasmic encoding region of acrB, in close proximity to a site found to aid in chloramphenicol resistance (41, 42). These sequencing results indicate that strains containing AcrAB-TolC efflux pumps use mutations related to the pumps and their regulation to optimize survival and increase resistance in the presence of antibiotics.
DISCUSSION
In this work, we identified that treating strains with antibiotic concentrations close to MIC0 is problematic for the evolution of resistance; however, the evolvability and ultimate resistance level achieved depend heavily on the genetic background. For ΔacrB, WT, and AcrAB+ strains, we observed some common features between the evolutionary landscapes, where reductions in growth rate were followed by increases in resistance. Yet, despite qualitative similarities, the degree to which these strains became resistant depended on the presence of AcrAB-TolC efflux pumps. WT bacterial populations with access to precise control of resistance machinery (i.e. efflux pumps and control of stress response regulators), evolved mutations that conferred high levels of resistance within 48 h after antibiotic exposure. The three biological replicates developed similar mutations in marR, acrR, and acrB to upregulate AcrAB-TolC efflux pumps in the WT strain, resulting in a population capable of surviving 10x MIC0 chloramphenicol treatment. These results are consistent with findings from drug resistance studies that have identified point mutations and insertional sequences in regulators that serve to upregulate efflux pumps (11, 24, 43–45). Notably, AcrAB+, which overexpresses efflux pumps, was less evolvable and never achieved as high levels of resistance as the WT strain, suggesting that both having pumps and the ability to precisely control their expression together are important in the evolution of resistance. This reduced evolvability of AcrAB+ may be a result of the fitness burden of constitutive pump overexpression (25, 46). In contrast, we found that under certain conditions the ΔacrB strain evolved to survive on 40x MIC0. This phenomenon agrees with results by Cudkowicz & Schuldiner, who found that evolving ΔacrB produced a more resistant population than evolving WT. They showed that the ΔacrB strain gained high resistance by optimizing redundant efflux pumps in E. coli, such as AcrEF and MdtEF (11). Taken together, these findings suggest that carefully modulating the exact levels of pump expression may be critical for evolving resistance.
Our results identify antibiotic treatment regimes that are especially prone to mutation. While doctors measure resistance of bacterial infections, they sometimes prescribe antibiotic treatment prior to obtaining the results of this assay (47) or use a treatment concentration too low to effectively penetrate an infection site (48). This blind treatment could lead to increased levels of resistance (49, 50). Yet, potentially more dangerous are the differences between the simulated plasma-concentration and measured plasma-concentrations of patients. In a study at the Kenya Medical Research Institute, patients were administered a concentration of chloramphenicol well above the MIC for the Streptococcus pneumoniae being treated (51). Researchers simulated the administered dosing regime and later measured the plasma-concentration; their findings demonstrated that the true concentration of chloramphenicol in the patients was often 2-5x MIC, as opposed to the 5-10x MIC anticipated. These findings are relevant in that we found that in vitro chloramphenicol treatments under 10x MIC, especially 1-2x MIC treatments, most readily promote the emergence of highly resistant bacterial populations. Reding et al. similarly observed this hotspot for adaptability of E. coli in the presence of another antibiotic, erythromycin, just below its MIC (19). Although it is essential for healthcare workers to be mindful of toxicity and accessibility, our results highlight the presence of regimes that are especially problematic and which should be avoided to limit evolution of antibiotic resistance.
By charting evolutionary landscapes across different antibiotic concentrations, different parent strains, and time, we have gained insight into treatments that impact the emergence of antibiotic resistance and the role of efflux pumps in this process.
METHODS
Strains and Plasmids
We used E. coli strains BW25113 (WT), BW25113 ΔacrB (ΔacrB), and BW25113 ΔacrR (AcrAB+). The wild type strain BW25113 is the parent strain for the Keio collection (52). BW25113 ΔacrB was derived from Keio collection strain JW0451 (BW25113 ΔacrB::kanR) (25). For BW25113 ΔacrR, we designed primers with homology regions on acrR and amplified the kanamycin resistance marker and FRT sites of pKD13 (52). Primers are listed in Table S1. The linear DNA was then treated using a DpnI digest and PCR purification. We electroporated the purified linear DNA into competent BW25113 cells containing the plasmid pSIM6 (53). We removed kanamycin resistance markers following the pCP20 protocol from Reference (54).
Determination of MIC
For all experiments, overnight cultures were inoculated from a single colony in 10 mL LB and grown in a 50 mL Erlenmeyer flask at 37°C with 200 rpm orbital shaking. After overnight growth, the optical density at 600 nm (OD600) was measured, and the initial volume was diluted back to OD600 = 0.1. To determine the MIC of the parent strains (Fig. S7), we added a final concentration of 0, 0.2, 0.5, 1, 2, 4, 8, or 12 μg/mL to each culture; to determine the MIC of the evolved strains (Fig. S6), we added 0, 0.5, 1, 2, 5, 10, 20, or 50 μg/mL to each culture. The samples were sealed with evaporation-limiting membranes (Thermo Scientific AB-0580) and grown in 24-well plates at 37°C with 200 rpm orbital shaking. OD600 readings were taken using a BioTek Synergy H1m plate reader before incubation (t = 0 h) and after antibiotic exposure (t = 24 h). All experiments were performed in triplicate using biological replicates.
Experimental Conditions in the eVOLVER
In the eVOLVER, cultures were inoculated from a single colony in LB at 37°C. A stir bar mixed the cultures on a medium setting, or approximately 1000 rpm (34). The LB was supplemented with detergent Tween20 (Sigma Aldrich Cat. # P1379) at 0.2% (v/v) to reduce spurious OD600 measurements caused by biofilm growth on the flask.
Cells were inoculated in the eVOLVER overnight (t ≈ −16 – −14 h) prior to the beginning of the experiment (t = 0 h) to establish steady-state exponential growth. We set the eVOLVER using an upper OD600 bound of 0.2 and a lower bound of 0.1; thus, cultures were grown to a turbidity of 0.2 and then diluted back to 0.1 to maintain the turbidostat at approximately constant cell density. Samples were collected during the experiment at set time points (t = 0, 1, 3, 6, 12, 24, 48, and 72 h) and used for downstream analysis. All experiments were performed in triplicate using biological replicates.
At t = 0 h, we introduced chloramphenicol at a predetermined final treatment concentration ([Cm] = 0, 0.2, 0.5, 1, 2, 5, 10, or 20 μg/mL). This introduction was implemented by switching the media source from one containing 0 μg/mL chloramphenicol to another containing the final treatment concentration; in addition, we spiked the samples directly with the treatment concentration of chloramphenicol at the same time to avoid a delay due to the time required for media cycling in the turbidostat.
Downstream Assays and Data Collection from eVOLVER Samples
Growth Rate Measurements
Growth rate measurements were calculated after each dilution event using:

The growth rate between each dilution was then averaged across sampling time points to compare against disc diffusion assays and spot assays. For example, the growth rate given at t = 0 h is the growth rate from t = −6 h to t = 0 h.
Antibiotic Disc Diffusion Assay
We aliquoted samples from the eVOLVER, where the OD600 from each sample was between 0.1 and 0.2. We used cotton swabs to cover LB agar plates with a layer of the sample (55). An antibiotic disc containing chloramphenicol (30 g) (Thermo Fisher Scientific Cat. # CT0013B) was then placed on the plate. The plate was incubated for 24 h at 37°C. The diameter of the zone of inhibition around each disc was then measured. Diameter of inhibition zones were classified as susceptible, intermediate, or resistant based on Reference (56). Additionally, we calculated the MIC using a linear mapping between MIC and diameter of inhibition zones for our samples (Figure S6) (57).
Spot Assay
The samples from the eVOLVER experiment were diluted in PBS to the following dilution series: 1, 10−1, 10−2, 10−3, 10−4, and 10−5. We then plated 2.5 μL of each dilution on LB agar plates containing 0, 0.5, 1, 2, 5, 10, and 20 μg/mL chloramphenicol. The plates were then incubated for 24 h at 37°C. To count colonies, we identified the dilution factor with the most countable colonies, and recorded the number of colony forming units (CFU) and dilution factor (d). The CFU/mL for each sample was then calculated by:
 where V is the volume plated. We also calculated the proportion of the population able to grow on different concentrations of chloramphenicol by calculating the CFU/mL from LB agar plates containing 0, 0.5, 1, 2, 5, 10, and 20 μg/mL chloramphenicol.
Whole Genome Sequencing
DNA was extracted from single isolates and parent strains using the QIAGEN DNeasy PowerBiofilm kit. Samples were sequenced at the Microbial Genome Sequencing Center (MiGS) in Pittsburg, PA, USA, who conducted library preparation based on the Illumina Nextera kit series and then sequenced using a NextSeq 550 platform with 150 bp paired-ends and an average coverage of 50 reads. We analyzed reads using breseq (58) version 0.35.1. Sequenced WT isolates were from experiments treated with 2 μg/mL chloramphenicol in the eVOLVER for 72 h and then isolated on 20 μg/mL chloramphenicol.
Data Availability
The datasets generated during this study are available from the corresponding author upon reasonable request.
ACKNOWLEDGEMENTS
This research was supported by the National Science Foundation (grant No. 1347635) and the National Institutes of Health (grant No. R01AI102922).
We thank Dr. Mo Khalil, Dr. Brandon Wong, Dr. Chris Mancuso, and Zack Heins for their assistance and support with the eVOLVER.
REFERENCES


