

Abstract
In Parkinson’s disease, the depletion of iron-rich dopaminergic neurons in substantia nigra’s nigrosome 1 precedes first motor symptoms by two decades. Monitoring this neuronal depletion at an early disease stage is needed for diagnosis and treatment monitoring. Magnetic resonance imaging (MRI) is particularly suitable for this task due to its sensitivity to tissue iron. However, the mechanisms of MRI contrast in substantia nigra are not well understood, hindering the development of specific biomarkers. We showed that the dominant contribution to the effective transverse MRI relaxation rate  in nigrosome 1 originates from iron accumulated in the neuromelanin of dopaminergic neurons. We linked
  quantitatively to the product of cell density and local iron concentration in dopaminergic neurons, combining quantitative 3D iron histology, biophysical modeling, and quantitative MRI on post mortem brain tissue. This knowledge opens an avenue for monitoring neuronal iron and density in vivo and may be applied to detect early neurodegeneration in Parkinson’s disease.
Introduction
Pathologic iron accumulation is a biomarker and potential cause of several neurodegenerative diseases, among them Parkinson’s disease (PD) (Ward et al., 2014). In PD, iron overload in dopaminergic neurons (DN) in substantia nigra (SN) is followed by their depletion (Zucca et al., 2017), starting in neuron-rich nigrosome 1 (N1) (Damier et al., 1999a,b). This neuronal depletion precedes first motor symptoms of PD by nearly two decades and remains mostly undiscovered until the majority of DN are irreversibly lost (Agid, 1991). Therefore, in vivo methods capable of monitoring iron content in DN and DN loss are highly desired for early diagnosis and monitoring of potential treatments.
Magnetic Resonance Imaging (MRI) promises to provide such information, as it allows a unique, noninvasive glimpse into the cellular iron distribution (Sulzer et al., 2018; Edwards et al., 2018; Fukunaga et al., 2010; Schenck and Zimmerman, 2004). Several MRI parameters change in the SN of PD patients. Among them are the effective transverse relaxation time  and therefore the intensity in
  -weighted images (
 -WI) (Kwon et al., 2012), local magnetic susceptibility (Langkammer et al., 2016), and the image intensity in an MRI sequence sensitive to neuromelanin, the main iron chelator in DN (Sasaki et al., 2006; Isaias et al., 2016; Cheng et al., 2019). Most strikingly, the so-called swallow tail, an elongated structure with prolonged
  often interpreted as N1 (Blazejewska et al., 2013; Lehéricy et al., 2014; Péran et al., 2010; Schwarz et al., 2014; Cheng et al., 2019), disappears in the SN of PD patients. In a population of patients with motor symptoms, the absence of this feature can be used to diagnose PD with a sensitivity of 100 % and a specificity of 95 % or higher (Cosottini et al., 2014; Schwarz et al., 2014). This high diagnostic power at a late disease stage suggests that MRI-based PD biomarkers may also be useful for early stage diagnostics.
Despite the wide-spread use of MRI for imaging SN, the mechanisms underlying MRI contrasts in SN and especially in the nigrosomes are not well understood. While multiple tissue components of SN induce transverse MRI relaxation, iron is thought to be causing most of it in the myelinpoor nigrosomes (Lee et al., 2018). Several studies performed careful qualitative comparisons between MRI and histology on post mortem tissue from PD patients and controls unaffected by neurodegenerative disease (Blazejewska et al., 2013; Sasaki et al., 2006; Lee et al., 2018, 2020; Rutledge et al., 1987). They demonstrated that nigrosomes show contrast to the surrounding tissue in SN. Iron, accumulated in neuromelanin in DN and in the iron storage protein ferritin in glial cells, was hypothesised to impact relaxation decisively (Zecca et al., 2004a; Lee et al., 2018, 2020). However, a quantitative link between MRI parameters in SN, SN’s cellular composition, and the cellular iron distribution is still missing. Quantitative information about the iron distribution in different cellular populations in SN is largely lacking (Morawski et al., 2005; Reinert et al., 2007, 2006). It is not clear if iron in neurons or glial cells, in ferritin or in neuromelanin dominates the iron-induced MRI contrast in SN, particularly in the nigrosomes.
A strong quantitative link between MRI parameters and the cellular iron distribution would greatly enhance the specificity and interpretability of MRI biomarkers. The theory describing MRI relaxation induced by magnetic perturbers, such as iron, on the microscopic scale (Kiselev and Novikov, 2018; Yablonskiy and Haacke, 1994; Gagnon et al., 2015) demonstrated great potential: It describes the effective transverse relaxation time of blood (Kiselev and Novikov, 2002, 2018), explains how the signal depends on the blood oxygenation level (Gagnon et al., 2015; Uludağ et al., 2009; Ulrich and Yablonskiy, 2016), and using this theory blood vessel sizes can be measured (Troprès et al., 2001). Until now, it has not been applied to describe the relaxation resulting from iron-rich cells in the nigrosomes.
Herein, we close this gap by building and validating a fully quantitative biophysical model of iron-induced relaxation in the nigrosomes of SN. We quantified the cellular iron distribution between DN and other tissue components in the nigrosomes, combining 3D quantitative iron histology based on proton-induced x-ray emission microscopy (PIXE) and histochemistry on post mortem human tissue. We quantified the predominant contribution of iron to the transverse and the effective transverse relaxation rates R2 = 1/T2 and  in the nigrosomes, using ultra-high resolution quantitative MRI and chemical tissue iron extraction. Combining the obtained knowledge with biophysical modeling of the MRI signal, we demonstrated that iron accumulated in DN causes the major part of iron-induced relaxation in N1 and pinned down an appropriate model for this contribution. Extrapolating the biophysical model, we showed that assessing the iron content in DN in vivo is within reach of state-of-the-art MRI. The established quantitative link between MRI parameters and the cellular iron distribution constitutes a crucial step towards the in vivo characterisation of DN.
Theoretical Considerations
Tissue iron contributes to the transverse and effective transverse relaxation rates through processes that can be categorized into molecular interactions on the nanoscale and dephasing due to a heterogeneous cellular iron distribution on the microscale (Eqs. (1), (2)) (Kiselev and Novikov, 2018). In order to interpret relaxation rates in SN and to link them to the cellular iron distribution, we estimated the impact of different relaxation processes from first principles and determined the most relevant ones. A detailed theoretical treatise of iron-induced relaxation rates and an analytical description of spin echo (SE) and gradient echo (GE) decays induced by nano- and microscale processes are presented in the Materials and Methods section. The most important results for interpreting iron-induced MRI parameters and guiding the experiments are summarized here.
Remarkably, the relaxation processes on the nanometer and micrometer scale manifest themselves differently in  and R2.
Molecular interactions with iron on the nanoscale induce very fast fluctuations of the water proton Larmor frequency, resulting in transverse relaxation. Such processes impact  and R2 equally, due to effective diffusion averaging over the nanoscale distances between the iron-storage complexes. The nanoscale contributions to relaxation rates are determined by the average tissue content of iron stored in ferritin and neuromelanin (
 and
and  , respectively; Eq. (3)) and are not dependent on the cellular iron distribution.
In contrast, the heterogeneous cellular distribution of iron on the microscale results in a perturbation of the Larmor frequency around iron-rich tissue components (such as iron-rich cells or fibers), which are not fully averaged out by water diffusion. Therefore,  is impacted stronger than R2, up to an exclusive contribution to
  in the static dephasing limit for large or well separated iron-rich structures (Eq. (6)). The microscale contribution is therefore very sensitive to the cellular distribution of iron. Depending on the theoretical regime, the microscale relaxation rates can be determined from the Larmor frequency perturbation induced by iron (Eq. (6)) or the spatial two-point correlator of the latter (Eqs. (8), (9)). In the specific case of sparse iron-rich cells,
  is a highly informative biomarker: It is proportional to the susceptibility difference between the cells and their surrounding (Eq. (7)) (Yablonskiy and Haacke, 1994).
Importantly, iron stored in ferritin and neuromelanin contributes differently to relaxation rates both for nanoscale and microscale relaxation mechanisms, since these two iron binding forms differ with respect to their magnetic properties and accessibility to water (Gossuin et al., 2000; Trujillo et al., 2017; Brooks et al., 1998; Cho et al., 2004; Schäfer-Nolte, 2014; Zecca et al., 2004a).
To summarize, iron-induced  and R2 are driven by several mechanisms, dependent on different aspects of the cellular iron distribution. Estimating the dominating relaxation mechanism in the nigrosomes and quantifying the contribution of DN to
  and R2 requires comprehensive knowledge of the quantitative 3D microscopic iron distribution in both chemical forms.
Results
Enhanced  in the nigrosomes is induced by iron

In this section, we show that iron is the main contributor to effective transverse relaxation in the nigrosomes by (i) a qualitative comparison between MRI contrast in post mortem SN tissue and histology and (ii) a quantitative analysis of the iron-induced contribution to  and R2 in a tissue iron extraction experiment.
To examine the origin of effective transverse relaxation in the nigrosomes qualitatively, we compared quantitative MRI acquired at 7 T to histology and quantitative iron mapping on three tissue blocks containing SN (sample 1: Figs. 1, 2; samples 2 and 3: Fig. S1). High resolution  and R2 maps, ultra-high resolution
  -WI, and histology were precisely registered using vascular landmarks (marked with asterisks for sample 1 in Fig. 1B, C). In sample 1, the nigrosomes N1 and N3 were identified on histological sections as areas with high density of neuromelanin-rich dopaminergic neurons (Fig. 1C), low calbindin staining intensity (Fig. S1G1), and with morphology according to the anatomical subdivision of SN (Damier et al., 1999b): an elongated, curved N1 located ventro-medially and a circular N3 located dorso-laterally (Fig. 1C, D). Nigrosomes appeared hyperintense on quantitative
  maps of all tissue samples, showing high contrast to surrounding SN tissue (Figs. 1A, 2B, S1B1-3). On ultra-high resolution
  -WI of all three samples, granular hypointensities were visible at the location of the nigrosomes, pointing towards the presence of magnetic field perturbers with size smaller than and distance larger than 50 µm, which was the approximate length of the voxel edge in the
  -WI acquisition (e.g., Fig. 1B). Quantitative iron maps obtained with PIXE on all three samples revealed microscopic spots of increased iron concentration in the nigral areas of enhanced
  (Figs. 1E; S2A, C). These hot spots were identified as neuromelanin-rich domains within DN in all samples (Figs. 1F; S2B, D). Combining this finding with MRI results, we hypothesize that DN containing iron-rich neuromelanin are the microscopic magnetic perturbers causing increased
  in the nigrosomes.

Quantitative histology and MRI (sample 1 shown, results for samples 2 and 3 are presented in Fig. S1). A: On a quantitative  map of SN, nigrosomes N1 and N3 are visible as hyperintense areas. B: On ultra-high resolution
  -WI of SN, granular hypointensities are visible in N1 and N3. C: An unstained tissue section including SN shows N1 and N3 as areas with increased density of neuromelanin-positive (brown) DN (DN marked with a brown dot for better visibility). The vascular landmarks used for co-registration of MRI and histology are marked with asterisks in B and in C. D: Subdivision of SN along medial (M), lateral (L), ventral (V), and dorsal (D) directions, showing an elongated N1 and a circular N3 (adapted from (Damier et al., 1999b)). E: Quantitative iron map from a region in N1 obtained with PIXE. An increased iron concentration was observed in cytoplasm of neuromelanin-positive DN. F: Enlargement of the region of interest (ROI) within N1 marked in C, on which the PIXE measurement (E) was done. Brown neuromelanin domains in DN were identified. Examples of identified DN are marked with arrows in E and in F.

Transverse and effective transverse relaxation before (top row) and after chemical iron extraction (bottom, sample 1). A: Granular hypointensities in N1 and N3 disappeared after iron removal on 50 µm resolution  -WI. B: On quantitative
  maps, the contrast between N1, N3, and the surrounding tissue (ROI S) was lost after iron extraction. C: On quantitative R2 maps, no contrast between N1, N3, and S was observed before and after iron extraction. D:
  and R2 averaged over ROIs N1, N3, and S before iron extraction (red plus blue bar) and after (blue bar) are shown. The difference in relaxation rates before and after iron extraction (red bar) is hence the iron-induced relaxation rate. Iron induced five times more
  than R2 in N1 and N3, in S two times more
  than R2. After iron extraction,
  and R2 were almost equal in N1, N3, and S. The error bars indicate the standard deviation in the ROI. Anatomical directions are indicated as in Fig. 1.
To test the above hypothesis and quantify the iron-induced  and R2 in the nigrosomes, we analyzed quantitative MRI data acquired before and after chemical tissue iron extraction on sample 1 (Fig. 2, Table 1). Before iron extraction, strong
  contrast was observed between the nigrosomes and the surrounding tissue (S), with significantly higher
  values in the nigrosomes (Fig. 2B, D). No contrast between the nigrosomes and the surrounding tissue was observed in R2 maps (Fig. 2C, D). R2 values were much smaller than
  values.
Relaxation rates R2 and  before and after tissue iron extraction averaged over ROIs in nigrosomes N1 and N3 and surrounding tissue S (see Fig. 2A for region definitions). The error is given as the standard deviation in the ROI.
Iron extraction strongly reduced the  values in the nigrosomes (Table 1). The contrast between the nigrosomes and the surrounding tissue disappeared (Fig. 2B, D) and no granular
  -WI hypointensities in nigrosomes were visible anymore (Fig. 2A). R2 relaxation rates were slightly reduced after iron extraction in N1, N3, and S (Table 1; Fig. 2C, D). No difference between averaged
  and R2 was found in the nigrosomes after tissue iron extraction (Fig. 2D). In N1 and N3, the iron-induced contribution to
  , estimated as a difference in relaxation rates before and after iron extraction, was almost 5 times higher than the iron-induced R2 contribution. This observation points towards static dephasing as the dominating iron-induced relaxation mechanism.
DN somata have the highest iron concentration, but most of the nigral iron is located in ferritin outside of the DN’s somata
In this section, we quantify the 3D microscopic iron distribution in nigrosome N1 using a combination of classical histology and PIXE. The 3D microscopic iron maps were used to (i) determine the distribution of iron between dopaminergic neurons and other tissue components in N1 and (ii) to inform our biophysical model of iron-induced MRI contrast.
Quantitative cellular iron concentration maps in the nigrosomes were obtained using PIXE (sample 1: Fig. 3; samples 2 and 3: Figs. S2, S3). The local concentration of iron bound in two chemical forms was determined from these maps, assuming that iron within DN is mainly bound in neuromelanin and outside of DN mainly in ferritin (Table 2). Histograms of local iron concentrations in neuromelanin in N1 were generated by using masks of the neuromelanin in the DN’s somata (sample 1: Fig. 3A, other samples: Fig. S3; Fig. 3B).
Local iron concentration associated with neuromelanin (NM) and ferritin (FT) averaged over PIXE measurement areas in different samples. The concentration error is given as the standard error of mean (SEM) in the masked region in the PIXE iron maps. The error of the NM volume fraction is given as SEM over PIXE measurement areas for the first sample, on which PIXE was done on several ROIs.

Quantitative iron histology of N1 in sample 1. A: Histogram of local iron concentrations found in neuromelanin (NM) domains in N1. B: Quantitative iron concentration maps obtained with PIXE on an unstained section (top) were masked using neuromelanin maps (bottom) to obtain the local concentration of iron bound to ferritin and neuromelanin (other PIXE measurement ares indicated in Fig. S1D1). C: N1 is visible as a stripe of high DN density on a section stained with Perls’ solution for iron. D: A 3D quantitative iron map of N1 was generated by calibrating and co-registering 10 adjacent sections stained with Perls’ solution for iron. This volume was used for biophysical modeling.
In sample 1, a strongly increased local iron concentration ((387 ± 5) ppm) was found in the neuromelanin within the DN’s somata, while a significantly lower local concentration ((56 ± 3) ppm) of ferritin-bound iron was observed in the surrounding tissue. Neuromelanin occupied (1.97 ± 0.06) % of the volume, containing (12.2 ± 0.6) % of all iron. While the local iron concentration in neuromelanin within DN is seven times higher than in the surrounding tissue, the average tissue iron content associated to neuromelanin is five times lower than that attributed to ferritin. In samples 2 and 3, the results were qualitatively similar: an increased iron concentration in DN, but the majority of iron bound to ferritin outside of DN (Fig. S2, Table 2). A strong variation of local iron concentration in DN was found between neurons in each sample as well as between samples (Fig. S3): For sample 1, a mean and standard deviation across DN of (365 ± 161) ppm was found, for sample 2 (811 ± 366) ppm, for sample 3 (1495 ± 99) ppm.1
For sample 1, a quantitative 3D microscopic iron concentration map of N1 was generated (Fig. 3D). The 3D map, spanning over several MRI voxels within N1, was obtained from co-registration of ten adjacent sections stained with Perls’ solution for iron. This 3D map of N1 was made quantitative by calibrating the underlying Perls’ stains with local iron concentration in neuromelanin and ferritin from PIXE data on sample 1 (Table 2, Fig. 3B, C, D).
The average tissue iron content in both neuromelanin and ferritin, necessary for predicting nanoscale relaxation rates, was estimated from the 3D iron concentration map. The average tissue iron content in neuromelanin was  .2 Outside of the DN somata masks, the average tissue iron content in ferritin was
  .3
.3
Microscopic iron distribution causes most of iron-induced , which is accurately described by the static dephasing approximation

At this point, we have determined all necessary parameters for the biophysical model and proceed with estimating iron-induced relaxation rates originating from nanoscale and microscale processes. We identify the dominating contribution and appropriate theoretical description by comparing theoretical predictions with experimental data obtained before and after tissue iron extraction.
Molecular interactions on the nanoscale
The nanoscale contributions of neuromelanin- and ferritin-bound iron were estimated to be R2,nano,NM = (7.54 ± 0.11) s −1 and R2,nano,FT = (1.14 ± 0.07) s −1, respectively. We estimated them using Eq. (3) and the average tissue iron content in neuromelanin and ferritin obtained above. Interestingly, despite the fact that most to the iron is bound in ferritin, neuromelanin-bound iron in DN contributes dominantly to nanoscale relaxation due to its higher relaxivity. The total predicted nanoscale contribution  is much lower than the iron-induced
  , but comparable with iron-induced R2 ((11.3 ± 1.8) s −1) in this volume.4 Hence, the nanoscale relaxation is not the dominant relaxation mechanism for
  , but may explain the observed iron-induced R2.
Heterogeneous cellular iron distribution on the microscale
Contributions of the microscopic heterogeneous cellular iron distribution to  and R2 were estimated using Monte Carlo simulations and two analytic approximations to the MRI signal: static dephasing and motional narrowing (Fig. 4). In all three approaches, the iron-induced Larmor frequency shift (Fig. S4) obtained from the 3D quantitative iron map (Fig. 3D) was used.

Modeling iron-induced microscale relaxation in N1 for sample 1. A: Larmor frequency shift histograms for all iron (solid), iron in neuromelanin (NM, dashed) and iron in ferritin (FT, dotted) show that iron in neuromelanin contributes most of the spectral width, which causes static dephasing (SD) decay. B: In effective medium theory (EMT), Larmor frequency two-point correlators are low-pass filtered to account for diffusion. Example diffusion kernels are shown in solid/dashed/dotted black for echo times TE = 10/20/ 40 ms. C: GE signal decay predicted using SD is in good agreement with Monte Carlo simulations (MC) and experimental data, while EMT underestimates the signal for echo times longer than 20 ms. D: SE signal decay predicted with EMT shows faster relaxation than the decay from the MC simulation. Both MC and EMT somewhat overestimate the experimental SE decay. The predicted nanoscale relaxation rates were added to the shown iron-induced signal decays in C and D. The experimental data shown in C and D are experimentally derived iron-induced decays, calculated by subtracting the non-iron-induced relaxation rates in N1 obtained from the iron extraction experiment. The error bars indicate the SEM of experimental relaxation rates.
A Monte Carlo simulation of water diffusion within this 3D Larmor frequency shift map predicted iron-induced GE and SE signal decays according to Eqs. (4) and (5).
For the static dephasing approximation, the iron-induced  was calculated from the histogram of the intravoxel iron-induced Larmor frequency perturbation (Fig. 4A). This histogram was numerically Fourier transformed to obtain the iron-induced GE signal decay (Fig. 4C, Eq. (6)).
For the motional narrowing approximation, an effective medium theory was used (Eqs. (8), (9)). Herein, the two-point correlator of the iron-induced Larmor frequency perturbation was convolved with a diffusion kernel (Fig. 4B).
The predictions of Monte Carlo simulations were in agreement with the experimental data for  and slightly overestimated R2.5 For the comparison, the predicted nanoscale relaxation rates were added to the microscale decay, while the non-iron-induced relaxation rate from the iron extraction experiments was subtracted from the experimental relaxation rate. The excellent agreement for
  indicates that our model captures iron-induced effective transverse relaxation accurately.
The static dephasing approximation agrees very well with Monte Carlo simulations of the GE decay and the experimental  . The prediction of the effective medium theory only agrees with the Monte Carlo simulation and the experiment for echo times TE less than 20 ms, but overestimates GE and SE decay rates for larger echo times.6 From the good match of the static dephasing model and poor match of the effective medium theory model we can conclude that static dephasing is the relaxation regime of the largest part of effective transverse relaxation in N1.
DN are the main cellular source of iron-induced in N1

In this section, we use the developed biophysical model to estimate the contribution of dopaminergic neurons to effective transverse relaxation rates in the nigrosomes in order to asses the sensitivity and specificity of  to this cell type.
The total  and R2 relaxation rates in N1 were estimated by adding the iron-induced relaxation rates from nano- and microscale mechanisms to the non-iron induced relaxation rates averaged over N1 from the iron extraction experiment (Fig. 5). Predicted relaxation rates agreed well with experimental values: For
  , the sum of the predicted iron-induced
  and measured non-iron-induced
  in N1, (68.4 ± 1.8) s −1, was within the standard error of mean of the experimental
  of (61 ± 11) s −1. For R2, the sum of the predicted iron-induced R2 and measured non-iron-induced R2 was (37.1 ± 1.6) s −1, somewhat overestimating the experimentally determined R2 of (29.6 ± 0.9) s −1.

Comparison of predictions (patterned) to experimental transverse relaxation rates (solid color). The iron-induced relaxation rates (red) were obtained by subtracting the non-iron-induced relaxation rates in N1 from the iron extraction experiment (blue) from the relaxation rates measured in the volume corresponding to the 3D iron map. Top: The sum of the predicted nano- and microscale R2 in N1 somewhat overestimates the iron-induced R2. Neuromelanin- (NM) and ferritin-bound (FT) iron contributes equally to the microscale R2 relaxation rate, while neuromelanin dominates the nanoscale relaxation rates. Bottom: In N1, the sum of the predictions is in agreement with the experimental iron-induced  within the SEM indicated by the error bar. The contribution of neuromelanin-bound iron to microscale
  (micro. NM, horizontal stripes) dominates. The contribution of ferritin-bound iron to microscale
  was estimated by subtracting the
  from neuromelanin-bound iron from the
  predicted for all iron.
According to our simulations,  is the parameter most sensitive to iron in DN somata. The microscale contribution from only the neuromelanin-bound iron in DN of
  was predicted using a Monte Carlo simulation. This value agrees well with the analytic prediction of effective transverse relaxation resulting from spherical iron-rich cells in static dephasing (Eq. (7)) of
  . Hence, the
  induced by iron in DN somata is proportional to susceptibility difference between DN and the surrounding tissue (Eq. (7)). In case of iron-rich DN in N1, the susceptibility difference is predominantly contributed by neuromelanin-bound iron: Neuromelanin’s susceptibility per iron load is almost three times higher than ferritin’s and the local iron concentration in neuromelanin is more than six times higher. Thus, the
  contribution from DN is a linear function of their average tissue iron content, i.e. the product of the average iron load of DN and the neuronal density. Adding the nanoscale contribution of neuromelanin-bound iron, iron in DN caused (43.6 ± 0.6) % of the total
  and (60.2 ± 1.2) % of the iron-induced
  . R2 was less sensitive to iron in DN, which caused (31.4 ± 1.8) % of the total R2 and (61.70 ± 1.53) % of the iron-induced R2.
Interestingly, iron-induced  and R2 are two times more affected by neuromelanin-bound iron than the iron-induced bulk susceptibility: Iron in DN’s neuromelanin contributes merely (29.3 ± 0.4) % to the iron-induced bulk susceptibility, as calculated by dividing the product of the DN’s volume fraction of 2.6 % and their average susceptibility of (1111 ± 15) ppb by the average susceptibility in the volume of the 3D quantitative iron map of (99 ± 5) ppb.
Nigrosome integrity can be assessed with MRI in vivo
In this section, we examine theoretically how high the contribution of DN to  in N1 would be in in vivo MRI and whether nigral iron quantification could be achieved in reasonable scan time. To this end, we extrapolated our finding from post mortem tissue to the in vivo MRI case by accounting for differences in temperature and tissue diffusion properties.
The body temperature in vivo as compared to room temperature in our post mortem experiments leads to a decreased iron-induced relaxation rate due to the temperature-induced decrease of iron’s magnetic susceptibility. Since the static dephasing contribution described by Eq. (6) scales linearly with magnetic susceptibility, and the susceptibility of iron is inversely proportional to the temperature, we expect a 5 % decrease of the iron-induced microscale  in vivo.7
Additionally, the higher diffusivity in vivo shifts the microscale relaxation regime in the direction of motional narrowing. While this effect may decrease the relaxation contribution of iron, making  less sensitive to this contribution, our model predicts that the microscale relaxation regime in vivo is still close to static dephasing (Fig. S5): a Monte Carlo simulation predicted
  , while the prediction for static dephasing was
  . The combined effect of decreased susceptibility and faster diffusion was 7.8 % less
  in vivo, which was estimated using Monte Carlo simulation (Fig. S5). Importantly, thus our model predicts that also in vivo
  is a parameter sensitive to the average tissue iron content in DN.
The nanoscale R2 induced by ferritin-bound iron was reported to decrease by 15% due to a temperature increase from room to body temperature (Gossuin et al., 2000). For neuromelanin-bound iron, no such data was published, but a similar decrease in nanoscale R2 is expected.
Based on these results, we propose two potential MRI-based biomarkers for iron in the somata of dopaminergic neurons. The first is the reversible part of the effective transverse relaxation rate in N1  . According to our results, this parameter is completely driven by iron and on the order of 50s −1 (Table 1), of which about 60 % are contributed by iron in DN. We expect an even higher specificity for the second biomarker, the difference in
  between N1 and the directly surrounding tissue (e.g. area S in Fig. 2). This parameter is analytically linked to the average tissue iron content in DN as shown above, if the contribution of ferritin-bound iron is comparable in both regions.
While the increased temperature and diffusion constant in vivo decrease iron’s contribution to  slightly, assessing the average tissue iron content of dopaminergic neurons is in reach of in vivo MRI relaxometry. Strong contrast in
  was observed between the millimeter-thin N1 and the surrounding tissue with more than 40 % increase in
  in the DN-rich area. Hence, in vivo nigrosome characterisation with 7T MRI requires quantitative maps of
  and R2 with sub-millimeter resolution and signal-to-noise ratio (SNR) of at least 4 to achieve a contrast-to-noise ratio of 2. A multi-echo GE acquisition with a resolution of 500 µm resulting in
  maps with averaged SNR of about 20 was demonstrated at 7 T in vivo (Tardif et al., 2016), opening the path for in vivo assessment of substantia nigra’s substructure.
Discussion
This work establishes a comprehensive biophysical model of iron-induced transverse and effective transverse relaxation rates in the nigrosomes in human substantia nigra. We demonstrated that iron in neuromelanin-rich dopaminergic neurons in the nigrosomes is the predominant contrast driver (Figs. 1, 2). Using quantitative cellular iron maps and biophysical modeling, we predicted iron-induced relaxation rates from first principles and quantified the impact of different relaxation mechanisms induced by iron stored in two chemical forms. We characterized the distribution of iron in these two forms, ferritin and neuromelanin (Figs. 3, S3), and separately estimated their impact on quantitative MRI parameters. In nigrosome N1, we found most of the iron bound in ferritin and only about 11.8 % to 32.0 % stored in neuromelanin in DN (Table 2). Despite its lower concentration, neuromelanin-bound iron was the major contributor to nigral  relaxation, explaining 60 % of iron-induced relaxation rates in a representative volume of several MRI voxels within N1 (Fig. 5). Both quantitative biophysical modeling and qualitative assessment indicated that the heterogeneous cellular iron distribution on the microscale is the main effective transverse relaxation mechanism in N1. This contribution is well described by the static dephasing approximation (Fig. 4).
Biophysical modeling informs the design of MRI-based biomarkers of nigrosome integrity
Our results provide important guidance for the interpretation and development of MRI-based biomarkers of nigrosome integrity in vivo. We proposed two potential biomarkers of iron in DN: The reversible part of the iron-induced effective transverse relaxation rate  in N1 and the difference in
  between N1 and the directly surrounding DN-poor tissue. Both parameters are driven by the average tissue iron content of neuromelanin clusters, i.e. the product of local iron concentration in DN and their density (Yablonskiy and Haacke, 1994). We expect this relation to hold in vivo, as the predicted iron-induced relaxation rates were reduced by merely 7 % due to temperature and tissue fixation effects (Fig. S5). These potential biomarkers of the averaged tissue iron content in DN are likely informative because the density of DN and their iron load strongly varies across the SN and also between individuals (Figs. S1, S3). Thus, they are expected to be sensitive to age-related iron accumulation in DN (Zecca et al., 2004a) and to DN depletion (Damier et al., 1999b) and therefore potentially to cognitive and motor impairment in PD (Tambasco et al., 2019).
We estimated that a biomarker of iron in DN is in reach of state-of-the-art MRI methods (Tardif et al., 2016). Recently developed methods for prospective motion correction and physiological noise correction (Vannesjo et al., 2015; Versluis et al., 2010; Stucht et al., 2015) promise to improve data quality even further (Trampel et al., 2019; Lüsebrink et al., 2017; Metere et al., 2017).
Our generative biophysical model has fundamental implications for the understanding of relaxation mechanisms in the human brain: It demonstrates that knowledge about the cellular iron distribution and iron’s chemical form are indispensable for interpreting GE and SE signal decays. Current models of iron-induced MRI parameters (Haacke et al., 2005; Stüber et al., 2014; Langkammer et al., 2012; Yao et al., 2009) often oversimplify the impact of tissue iron by using a single empirical proportionality coefficient between the average tissue iron concentration and the MRI parameter across brain areas. For areas with similar average tissue iron concentrations, as the motor cortex with 50 ppm (Hallgren and Sourander, 1958) and N1 in sample 1 with 60 ppm (Fig. 3), one such model for  (Stüber et al., 2014) predicts
  in the motor cortex and
  in N1. The model predicts relaxation rates accurately in the motor cortex, where we estimate an approximate iron-induced
  .8 In N1, however, the model explains less than half of the iron-induced
  .9 Our model is able to explain this difference by taking iron’s heterogeneous cellular distribution and its chemical form into account, predicting a total iron-induced
  . This stresses the importance of precise and specific models as presented here.
Our model predicts that the MRI parameters  , R2, and the bulk susceptibility measured with QSM are all affected differently by neuromelanin- and ferritin-bound iron pools. For instance, iron in DN contributes 60 % of iron-induced
  , but merely 29 % of iron-induced bulk susceptibility. Therefore, combining the information from all three parameters may enable the separate quantification of both iron pools using the quantitative links established by our model.
Our approach can be extended to studies of other iron-containing structures in the human brain. While there was extensive work on explaining myelin’s contribution to transverse relaxation from first principles (Wharton and Bowtell, 2012), so far only few studies addressed the microscopic mechanisms of iron’s contribution to  in brain structure (Troprès et al., 2001; Wen et al., 2018). Particularly, the contributions to
  of iron-rich glial cells in healthy grey and white matter, such as oligodendrocytes, micro-, and astroglia, as well as iron in myelin sheaths, have not yet been systematically explored. Iron is known to be accumulated in amyloid plaques and neurofibrillary tangles in Alzheimer’s disease (Meadowcroft et al., 2015) and in multiple sclerosis lesions (Craelius et al., 1982). Understanding mechanisms of iron-induced relaxation in these pathologies is expected to facilitate more specific disease biomarkers with diagnostic value.
Our results in context of previous work
The iron concentrations obtained in our study agree well with previous reports. To our knowledge, only two studies reported local iron concentrations in dopaminergic neurons. In a single DN in SN, the local iron concentration was 230 ppm (Morawski et al., 2005), while in a more recent study we reported a range of local iron concentrations in DN in nigrosome N1 from 85 ppm to 1371 ppm10 (Weigelt, 2019). Both agree with the range of local iron concentrations in DN from our study (Figs. 3A, S3). The sum of averaged tissue iron contents in neuromelanin and ferritin in N1 (in sample 1, 2, and 3 (63.0 ± 2.5) ppm, (201.1 ± 1.2) ppm, and (573 ± 4) ppm, respectively) is on the order of the reported iron concentrations averaged across the entire SN, 48 ppm to 20 ppm (Dexter et al., 1989, 1991; Galazka-Friedman et al., 1996; Hallgren and Sourander, 1958; Loeffler et al., 2002; Riederer et al., 1989; Morawski et al., 2005; Zecca et al., 2004a; Weigelt, 2019).
Increased  relaxation rates in the nigrosomes are in line with recent studies (Lee et al., 2016, 2018). A
  of (82 ± 25)s −1 was observed in the nigrosomes in the first sample of our study (Fig. 2D), which corresponded well to a reported
  of (103 ± 3)s −1 in neuromelanin-rich regions within SN in post mortem tissue. In all examined samples, we identified the neuromelanin-rich nigrosomes as regions with increased
  by precisely registering
  maps to histology using ultra-high resolution
  -WI (Figs. 1A, B, C; S1A, B, D). The
  relaxation rates in samples 2 and 3 are higher than in sample 1, which can be attributed to the intersubject variability of local iron concentrations in and volume fraction of DN’s neuromelanin (Table 2, Fig. S3).
Our results deviate from the study by Blazejewska et al. (Blazejewska et al., 2013), who interpreted a hyperintense feature on post mortem  -WI, the swallow tail, as N1. This interpretation was adopted in several subsequent studies (Schwarz et al., 2014, 2018; Lehéricy et al., 2014; Mahlknecht et al., 2017). A potential cause of this seeming contradiction may be a difference in co-registration strategies or definition of nigrosomes in the two studies. In our study, ultra-high resolution MRI was used for local co-registration with histology, enabling registration with a precision of about 100 µm, while an affine co-registration of large sections was used in the earlier study, potentially causing a local mismatch. In addition, Blazejewska et al. defined nigrosomes on histological sections as areas with low calbindin immunoreactivity, while we defined nigrosomes as areas with high density of dopaminergic neurons. Although we also found low calbindin immunore-activity staining intensity in areas of high DN density in all samples (Fig. S1G), they did not always perfectly co-align, since calbindin-poor areas were larger than areas of high DN density. On the other hand, it was difficult to identify the swallow tail feature in our data, since we used tissue blocks that did not always encompass the entire SN. It was recently reported that the swallow tail shows intersubject variability in in vivo MRI data (Cheng et al., 2019). A further study is required to identify the histological underpinning of the swallow tail feature and its exact relation to N1, including precisely co-registered quantitative MRI and histology on whole brains. Such a study would be of high importance for the development of an in vivo nigral biomarker, since the substantia nigra is a heterogeneous structure, containing not only the nigrosomes but also afferent and efferent fibers. As relaxation is impacted by different structures across SN, it will be crucial to look at the regions where dopaminergic neurons contribute predominantly.
Experimental limitations and biophysical modeling assumptions
Our conclusions about relaxation mechanisms were drawn from experiments on formalin-fixed post mortem tissue, which differ from in vivo tissue in several ways. The minor effects of vasculature, increased temperature, and increased diffusion coefficient (Birkl et al., 2016) in vivo were already discussed.
Additionally, our model probably underestimates iron-induced relaxation in vivo by 5 %, as the labile iron pool is washed out during preparation, before PIXE measurements and histochemistry are performed. The labile pool contains 5 % of the total iron in soluble proteins such as transferrin (Kakhlon and Cabantchik, 2002; Stüber et al., 2014).
Except for the labile iron pool, we assume that the cellular iron distribution observed in post mortem SN tissue reflects well the in vivo cellular iron distribution. Post-fixation iron accumulation that changed the MRI contrast was observed recently in neuromelanin-rich neurons in post mortem locus coeruleus (Betts et al., 2019). However, this process is most likely specific to locus coeruleus: There, the neuromelanin-containing neurons are iron-poor under physiological conditions, while neuromelanin in SN is rich in iron (Zecca et al., 2004b).
In the chemical iron extraction experiment, which we used to quantify iron-induced relaxation in SN, we assumed that all changes in MRI parameters are attributed to missing iron. The chemical iron extraction procedure could have additional effects on the tissue and alter non-iron-induced relaxation rates. Such alterations did most likely not affect  , as we found no significant differences between
  pre- and post-extraction in the iron-poor crus cerebri region on a quantitative
  map (Fig. 2B, ventro-lateral of ROI S).
While nanoscale processes are merely a minor driver of iron-induced  according to our analyses, the relaxivities of iron in neuromelanin and ferritin used in the biophysical model could be different from relaxivities in tissue as they were determined in vitro (Trujillo et al., 2017; Gossuin et al., 2002). Particularly for neuromelanin, the difference in molecular structure and granularity of the synthetic melanin used in vitro may affect its effective relaxivity. It is experimentally cumbersome to overcome these limitations. However, as the iron extraction experiment shows that iron contributes much stronger to
  than to R2 and nanoscale processes contribute equally to R2 and
  , they are of minor interest here.
For modeling relaxation rates due to processes on the microscale, we estimated the effective susceptibility per iron load of DN using Curie’s law for an isolated spin 5/2, which is an oversimplification in view of the two iron binding sites of neuromelanin (Zucca et al., 2017). An experiment to determine neuromelanin’s susceptibility would be of great help to refine our model.
While the high correspondence between experimental results and theory makes it unlikely that any major contributor was overlooked, relaxation effects due to more fine grained iron distribution patterns smaller than the voxel size of the 3D iron concentration map were disregarded. The 3D iron concentration maps had a resolution of 0.88 µm in plane and a slice thickness of 10 µm, which could be increased using electron microscopy.
The model did not explicitly include myelin as a driver of  and R2 contrast, since the myelin concentration in N1 is low, as can be seen on Luxol stains for myelin (Fig. S1F1). Using the model in other areas will require to enhance it and take myelin’s contribution into account.
Importantly, the theoretical predictions were compared to experimental values in a region of four MRI voxels. It was limited by the area of neuron-to-neuron registration, comprising a volume of 440 µm × 440 µm × 100 µm. Therefore, the relative contributions of different relaxation mechanisms, reported in Fig. 5, correspond to few representative voxels and were not averaged across nigrosomes. To extend the theory to other regions in SN, the comparison may be performed on a larger region. This would require the challenging co-registration of the entire SN by identifying shared DN on sections stained with Perls’ solution for iron.
Conclusion
In this paper, we develop a generative model of iron-induced transverse relaxation in nigrosome 1, informed by 3D quantitative iron histology. Our biophysical model constitutes an important step on the road toward a unified, quantitative understanding of iron-induced MRI relaxation in the human brain. We demonstrate mechanistically that dopaminergic neurons contribute predominantly to iron-induced  , although their neuromelanin only contains a minority of tissue iron. By linking
  to the averaged tissue iron content in dopaminergic neurons, this study lays the groundwork for developing a biomarker of nigral integrity. Such a biomarker will help understanding the interplay of iron accumulation and neuronal depletion in healthy ageing and Parkinson’s disease, as an important step toward early stage PD diagnosis.
Materials and Methods
Theory of Iron-Induced Transverse Relaxation
Iron contributes to transverse and effective transverse relaxation rates (R2 and  , respectively) through processes occurring at different temporal and spatial scales (Kiselev and Novikov, 2018). These processes can be categorized into molecular interactions on the nanoscale and dephasing due to a heterogeneous cellular iron distribution on the microscale (Kiselev and Novikov, 2018). We assume that the contributions to
  and R2 of processes occurring on these two spatial scales are statistically independent.11 In this case, the decays of both spin and gradient echo signals (SGE and SSE) can be described as a product of decays induced by each process:

 where R2,nano/micro and
  are the iron-induced transverse and effective transverse relaxation rates, respectively, resulting from processes on the nano- and microscale. They are in general time-dependent, allowing for non-exponential behaviour. R2,other and
  are the relaxation rates induced by tissue components others than iron.
Molecular Interactions on the Nanoscale
On the nanoscale, spin-spin interactions of water protons with iron electrons result in transverse MRI relaxation. Acting on the nanometer length scale, these processes depend on the iron binding site (iron spin state and water accessibility), but are independent of the cellular distribution of iron (Kiselev and Novikov, 2018). Since the diffusion time over the nanoscale distances is much smaller than the echo time of an MRI experiment, this relaxation mechanism results in a linear-exponential decay and contributes equally to transverse and effective transverse relaxation rates, i.e.  .
.
The contributions of ferritin- and neuromelanin-bound iron to the nanoscale transverse relaxation rate can be described by empirical relaxivities measured in ferritin and neuromelanin solutions at room temperature, physiological pH, and a static magnetic field of 7 T used in this study:
 where r2,FT = 0.0223s −1/ppm (Gossuin et al., 2002) and r2,NM = 0.847s −1/ppm (Trujillo et al., 2017) are the relaxivities of iron in ferritin and neuromelanin, respectively,12 and
  and
and  are the average tissue iron contents in ferritin and neuromelanin, respectively, i.e. the local iron concentrations associated to the chemical forms (cFe,FT and cFe,NM) multiplied with their volume fraction 1 − ζ and ζ, respectively.
Heterogeneous Cellular Iron Distribution on the Microscale
The MRI signal from brain tissue is affected by dephasing due to magnetic tissue heterogeneity on the cellular microscale (Kiselev and Novikov, 2018; Yablonskiy and Haacke, 1994). In particular, the heterogeneous distribution of paramagnetic iron among different cell types (Zecca et al., 2004b; Morawski et al., 2015) strongly impacts the MRI signal. Larmor frequency perturbations caused by iron-rich cells induce MRI signal dephasing and therefore signal decay (Duyn and Schenck, 2017).
The resulting relaxation rates depend on the spatial distribution of tissue iron and diffusion of water molecules through regions with a spatially varying Larmor frequency (Kiselev and Novikov, 2018). In the general case, the GE and SE decay contributions from microscale processes can be described by

 respectively, where Δf is the iron-induced Larmor frequency perturbation and r(t) the coordinate of a diffusing water proton spin. The averaging in Eqs. (4) and (5) is performed over the diffusion paths of all water protons within the MRI voxel, which cannot be performed analytically in the general case. Instead, numerical Monte Carlo simulations can predict MRI signal decays for arbitrary distributions of magnetic perturbers and tissue diffusion properties (Gagnon et al., 2015). For the two limiting cases of slow and fast diffusion, Eqs. (4) and (5) analytical solutions were reported.
In the case of negligible diffusion,13 the static dephasing approximation is applicable. In this case, the microscale contribution to the transverse relaxation rate R2,micro is zero and only an effective transverse relaxation rate  is induced. If the water protons remain static, the path integral in Eq. (4) simplifies to the Fourier transformation of the Larmor frequency probability density ρ(Δf) (Marques and Bowtell, 2005), which can be estimated from the intravoxel Larmor frequency histogram (Fig. 4A).
 In the special case of Larmor frequency perturbations caused by localized magnetic inclusions of simple geometry (here, iron-rich dopaminergic neurons), the analytical solution of Eq. (6) provides a quantitative link between the susceptibility of DN and
  . As was demonstrated by Yablonskiy and Haacke (Yablonskiy and Haacke, 1994), spherical magnetic inclusions contribute to
  according to
 where ζ is the volume fraction of the magnetic inclusions and Δ χ is the difference in susceptibility between the inclusions and the surrounding tissue. Importantly, the contribution of magnetic inclusions to
  is proportional to the product of their volume fraction and their susceptibility difference to the surrounding tissue.
In the opposite limiting case of fast diffusion, an analytic solution for arbitrary local magnetic field perturbations is provided by an effective medium theory for the motional narrowing regime (Novikov and Kiselev, 2008). The effective medium theory approximates the signal by the first terms of a series expansion in the parameter  · TE, which has to be much smaller than one for the series to converge. In this case, the contribution to R2,micro and
  are comparable. They are determined by the angular-averaged spatial two-point correlation function of the iron-induced Larmor frequency perturbation
  in the Fourier domain (Kiselev and Novikov, 2002) (Fig. 4B):14

 The function gGE/SE describes the diffusion averaging and is given by
  and
and  for GE and SE decays, respectively, where D is the diffusion constant (Kiselev and Novikov, 2002).
Software Implementation
The biophysical model was predominantly implemented using the Python programming language (Python Software Foundation, https://www.python.org/). A previously published Monte Carlo simulation (Gagnon et al., 2015) was re-implemented in the C programming language and run with 106 protons and a 0.1 m time step. The diffusion constant was set to D = 0.3 µm2/ms post mortem and D = 1 µm2/ms in vivo (Miller et al., 2012). Relaxation rates were calculated with the same procedure as for experimental MRI data, using the experimental echo times for fitting (see below).
Post mortem Human Brain Tissue Samples
Three midbrain samples (samples 1-3) including substantia nigra from human post mortem brains were provided by the Brain Banking Centre Leipzig of the German Brain Net (GZ 01GI9999-01GI0299), operated by Paul Flechsig Institute of Brain Research (Approval # 82-02). Sample 1, used in the iron tissue extraction experiment and for biophysical modeling, was donated by a 57-y-old male subject and contained bilateral SN. The samples 2 and 3 contained the left SN from a 86-y-old and a 61-y-old male subject, respectively. The causes of death of the donors of samples 1, 2, and 3 were liver failure, heart failure, and renal failure, respectively. Brain material was obtained at autopsy with prior informed consent and approved by the responsible authorities. The post mortem interval before fixation was less than 24 h for all tissue samples. Following the standard Brain Bank procedures, blocks were immersion-fixed in 4% paraformaldehyde in phosphate buffered saline (PBS) at pH 7.4 for at least six weeks to ensure complete fixation. Prior to MRI experiments, tissue blocks were washed in PBS with 0.1 % sodium azide to remove formaldehyde residues from the tissue.
Quantitative MRI
Fixed tissue samples were placed in acrylic spheres of 6cm diameter and immersed in Fomblin (Solvay Solexis, Bollate, Italy) to eliminate background MRI signal. MRI scanning was performed on a Siemens Magnetom 7T whole-body MRI scanner (Siemens Healthineers, Erlangen) using a custom-built two-channel quadrature coil designed for imaging small samples. 3D high resolution quantitative multi-parametric mapping (Weiskopf et al., 2013) was performed with the following parameters: A 3D multi-echo fast low-angle shot (FLASH) (Haase et al., 2011) with field of view (FOV) 32 × 32 × 25 mm3 for the first sample, 50 × 50 × 28 mm3 for the other samples; matrix size 144 × 144 × 112 for the first sample, 224 × 224 × 128 for the other samples (approximately 220 µm isotropic resolution for all samples); twelve echo times TE = 4/7.34/10.68/ … /40 0.74 ms recorded using bipolar readout; repetition time TR = 60 ms; flip angle α = 27°; bandwidth BW = 344 Hz/pixel. A single-slice 2D high resolution spin echo acquisition was performed with the following parameters: FOV 42 × 42 mm2 for the first sample, 28 × 28 mm2 for the other samples; slice thickness 0.6 mm; matrix size 192 × 192 for the first sample, 128 × 128 for the other samples (219 µm isotropic inplane resolution); six acquisitions with TE = 15/25/35/45/55/75 ms for the first sample, and with TE = 11/16/25/37/56/83 ms for the other samples; TR = 2s; α = 27°; BW = 344 Hz/pixel. 3D ultra-high resolution  -WI was performed using a single-echo FLASH with the following parameters: FOV 46 × 37 × 14 mm3; matrix size 896 × 728 × 287 (51 × 51 × 9 µm3 resolution); TE = 19.7 ms; TR = 180 ms; α = 48°; BW = 40 Hz/pixel; partial Fourier 6/8. All magnitude and phase images were reconstructed and stored. Quantitative parameter maps of
  and R2 were calculated from the magnitude images using a linear-exponential fit with a Rician noise floor implemented in Python.
Iron Extraction Experiment
After the MRI acquisition, the posterior part of the left SN from sample 1 was soaked in a solution of 2 % deferoxamine and 2 % sodium dithionite for 15 days at 37 °C to remove iron from the tissue. The solution was changed every three days. After iron extraction,15 the MRI acquisition was performed on this sample with the same parameters as before. The ROIs of N1 and N3 were segmented by an anatomy expert (M. M.) on the ultra-high resolution  -WI acquired before iron extraction. A rigid landmark registration between the MRI data acquired before and after iron extraction was performed.
Histology and Immunohistochemistry
Tissue blocks were embedded in paraffin (Histowax, SAV LP, Flintsbach) and cut into 10 µm sections using a sliding microtome (Jung Histoslide 2000, Leica, Wetzlar). Block-face imaging was used for initial co-registration between histology and MRI. The sections were transferred to Superfrost®Plus glass slides (Thermo Fisher Scientific, Massachusetts). For sample 1, ten consecutive sections containing the right substantia nigra with visible neuromelanin-pigmented nigrosomes N1 and N3 were stained with Perls’ stain for iron in order to generate 3D quantitative iron maps. Deparaffinized sections were incubated for 2 h at 37 °C in Perls’ working solution, before they were washed in PBS and Tris-HCl. Prior to the 3,3’-diaminobenzidine (DAB) reaction, the sections were preincubated with 0.5 mg DAB per ml Tris-HCl. After a 10 min DAB visualization reaction, the sections were washed in Tris-HCl, PBS, and distilled water before they were embedded in Entellan (Merck Millipore, Darmstadt).16 The sections were examined on an AxioScan.Z1 microscope (Zeiss, Jena) with a 20× objective lens (NA 0.5) with the same imaging parameters for all slides and no gamma correction. The images were precisely co-registered to the ultra-high resolution  -WI with vessels as landmarks (Fig. 1B, C) using the 3D Slicer software (https://www.slicer.org/). For samples 2 and 3, a section was stained with Perls’ stain. For all samples, the sections adjacent to the Perls’ stained sections were used for PIXE. Consecutive sections were stained with Luxol fast blue to localize myelinated fibers and with calbindin antibody for additional nigrosome verification.
PIXE Iron Quantification
PIXE was used to acquire quantitative iron maps (Ryan, 2011). Sections from all samples were deparaffinized, embedded in mounting medium (DePeX, Merck Millipore, Darmstadt), and sub-sequently placed into aluminum frames. Prior to PIXE, light microscopy was performed on the framed sections using an Axio Imager 2 microscope (Zeiss, Jena). The images were registered to ultra-high resolution  -WI as above. For sample 1, PIXE was performed at the Leipzig ion beam laboratory (LIPSION, Leipzig University, Leipzig) using a proton beam of 2.25 MeV and 0.5 nA with a diameter of 0.8 µm. It locally knocked out inner shell electrons, leading to element-specific X-ray emission. Rutherford backscattering spectra were recorded for absolute concentration calculations. PIXE was performed on four ROIs in N1 with the following parameters: matrix size 1000 × 1000/1000 × 1000/500 × 1500/1600 × 400; FOV 800 × 800/400 × 400/400 × 1600/1600 × 400 µm2; deposited charge 3.1/6.7/2.3/6.7 µC. For samples 2 and 3, PIXE was performed at the Microanalytical Center (Department for Low and Medium Energy Physics, Jožef Stefan Institute, Ljubljana) using a proton beam of 3.03 MeV and 100 pA to 150 pA with a diameter of 1.5 µm. The measurement parameters were: matrix size 256 × 256 for both; FOV 560 × 560/400 × 400 µm2; deposited charge 10.23/6. 45 µC. Quantitative iron and sulfur maps were obtained using the GeoPIXE II software (CSIRO, Clayton), following (Morawski et al., 2015). These elemental maps were corrected to account for tissue shrinkage during paraffin embedding. A volume shrinkage factor of (0.76 ± 0.02) was found by comparing the distance between vessels on ultra-high resolution
  -WI on sample 1 with their distance in histology.
Iron Quantification in Neuromelanin
Light microscopy and PIXE were combined to determine the local iron concentration in neuromelanin of dopaminergic neurons and in ferritin outside of DN. DN were identified on microscopy images as brown neuromelanin domains, which most DN contain, especially the ones vulnerable in PD (Herrero et al., 1993). Microscopy images were co-registered to the PIXE measurements using elemental sulfur maps on which the sulfur-containing neuromelanin showed up. Probability maps of DN were obtained from semi-automatic segmentation on the microscopy images using fastER (Hilsenbeck et al., 2017). After thresholding at 50 %, morphological opening with a 2 × 2 µm2 kernel was performed to remove small masking artifacts. The local iron concentrations associated with neuromelanin and ferritin were estimated from averaging quantitative PIXE iron maps inside and outside of the DN mask, respectively. The overlap of the PIXE measurement areas on sample 1 (Fig. S1D1) was taken into account in the analysis by first averaging over the overlapping areas and second over the whole measurement area.
Generation of 3D Quantitative Iron Maps
3D quantitative iron maps of N1 were obtained by calibrating semi-quantitative iron maps generated from Perls’ stain with local iron concentrations from PIXE, and subsequent co-registration. Semi-quantitative iron maps were obtained from microscopy images of Perls’-stained sections by applying the Lambert Beer law to the blue color channel, which showed the highest dynamic range. Next, quantitative maps of the iron concentration associated with neuromelanin in DN and ferritin outside of DN were generated by a separate calibration of semi-quantitative iron maps: The local iron concentration in DN was set to the value extracted from quantitative PIXE iron maps using the subset of DN located directly adjacent to the semi-quantitative iron map’s volume. Outside of DN, the mean of the semi-quantitative iron maps in the region of the PIXE measurement areas in N1 in sample 1 (Fig. S1D1) was set to the local iron concentration in ferritin from PIXE. A 3D quantitative iron map of N1 was obtained by co-registration of quantitative iron maps in an ROI containing a part of N1, encompassing a volume of 2.5 × 2.3 × 0.1 mm3. To this end, a rigid registration with shared DN on adjacent sections as landmarks was performed. The volume was cropped to a DN-rich area spanning over four voxels of high resolution quantitative MRI parameter maps in N1, i.e. 440 × 440 µm2.
Informing the Biophysical Model
A susceptibility map was calculated from the 3D quantitative iron map by separately scaling iron concentrations in neuromelanin and ferritin with the effective susceptibilities of neuromelanin-bound iron (3.3 ppb/ppm, Supplementary Information) and ferritin-bound iron (1.3 ppb/ppm (Schenck, 1992)), respectively.17 This map was transformed to an evenly spaced coordinate grid with a resolution of 0.88 µm using BSpline interpolation in SimpleTIK (Lowekamp et al., 2013).
The 3D Larmor frequency shift in N1, used in Monte Carlo simulations (Fig. 5C, D) as well as to determine the Larmor frequency histogram (Fig. 5A), was obtained by convolving the 3D quantitative susceptibility map with a dipole kernel (Marques and Bowtell, 2005).
The 3D spatial two-point correlation function of the Larmor frequency was calculated using Γ2,Δf(k) = |Δf (k)|2/V, where V is the map’s volume. After controlling its isotropy, the 3D two-point correlation function was angularly averaged in the plane corresponding to microscopy to estimate the two-point correlator.
Modeling the microscale relaxation induced by iron in only one chemical form was based on modified 3D iron maps: For relaxation due to DN, the iron concentration outside of DN was set to the average concentration of ferritin-bound iron. For relaxation due to ferritin-bound iron, the iron concentration in DN was set to the average concentration of ferritin-bound iron.
Competing interests
The Max Planck Institute for Human Cognitive and Brain Sciences has an institutional research agreement with Siemens Healthcare. NW was a speaker at an event organized by Siemens Healthcare and was reimbursed for the travel expenses.
Acknowledgements
We thank Louis Gagnon and Daniel Mayer for their help with the implementation of Monte Carlo simulations, Anna Jauch for the help with histochemical staining, Nico Scherf for his help with advanced image analysis of histochemical images, Dmitry Novikov and Valerij Kiselev for the discussion on relaxation theory, and Bob Turner for fruitful discussions. M.B. has received funding from the International Max Planck Research School on Neuroscience of Communication: Function, Structure, and Plasticity. The research leading to these results has received funding from the European Research Council under the European Union’s Seventh Framework Programme (FP7/2007-2013) / ERC grant agreement n° 616905. N.W. has received funding from the BMBF (01EW1711A & B) in the framework of ERA-NET NEURON. N.W. has received funding from the European Union’s Horizon 2020 research and innovation programme under the grant agreement No 681094, and is supported by the Swiss State Secretariat for Education, Research and Innovation (SERI) under contract number 15.0137. Work at JSI was supported by the Slovenian research agency grants No. P1-0112, I0-0005, J7-9398, N1-0090 and EU H2020 project No. 824096 “RADIATE”. Aspects of this work were supported by funding from the DFG Priority Program 2041 “Computational Connectomics”, MO 2249/3–1 and the Alzheimer Forschungsinitiative e.V. (AFI #18072) to M.M.
Footnotes
↵1 These mean values are different from the values reported in Table 2, because here each DN was weighted equally, while in the mean values in Table 2 the iron concentration is weighted with the DN’s area in the microscopy section.
↵2 Throughout this paper, the unit ppm is used as µg g−1 wet tissue weight.
↵3 These average tissue iron contents differ slightly from the values reported for the PIXE measurements (Table 2), because the averages were taken over different ROIs (Figs. 3C, S1D1).
↵4 The experimental values were calculated as the difference between the measured relaxation rates in the MRI voxels corresponding to the 3D quantitative iron map and the non-iron-induced relaxation rates averaged over N1 from the iron extraction experiment, which was performed on the contralateral side of the same sample.
↵5 The error of the predicted relaxation rates was estimated from the residuals of the linear fit, as this was far larger than the error of the used average tissue iron contents (Table 2).
↵6 This is not unexpected, as the parameter α, which determines the applicability of the effective medium theory (Kiselev and Novikov, 2018), is larger than one for TE = 20 ms. We estimated the parameter
, using the standard deviation of the Larmor frequency ↵7 This was estimated using Curie’s law: xin vivo/xpost mortem = Tpost mortem/Tin vivo = 293 K/310 K ≈ 95 %.
↵8 This was estimated by subtracting from a reported
in the motor cortex (Deistung et al., 2013) a post-iron extraction of 15s−1 in the visual cortex (Fukunaga et al., 2010), as no data from the motor cortex was available.↵9 This was estimated as the difference between
measured in this area (Fig. 5) and the average rate in N1 after iron extraction (Fig. 2D, Table 1).↵10 To ensure comparability, we applied the same tissue shrinkage correction as for our PIXE measurements to the reported value, which was a factor of 0.76.
↵11 This is a plausible assumption as the correlation times on the two scales differ by several orders of magnitude: Assuming a tissue diffusion coefficient of D = 1 µm2 /ms, the diffusion times τ D = l2 /D across nano-(l = 10 nm) and microscale (l = 10 µm) distances are 100 ns, and 10 ms, respectively.
↵12 We derived r2,FT by evaluating the linear relation for R2 in Fig. 1A in (Gossuin et al., 2000) at 7 T and converting mmol l −1 to ppm with a density of 1 kgl −1. We derived r2,NM by evaluating the linear relation for r2 in (Trujillo et al., 2017) at 1 ppm and scaling it linearly from 3 T to 7 T.
↵13 Negligible and fast diffusion here mean that the time scale of signal dephasing is much shorter and longer, respectively, than the diffusion time over the length scale of magnetic inhomogeneities (Yablonskiy and Haacke, 1994).
↵14 To improve readability,
is referred to as two-point correlator in the main text of this article.↵15 No metals were present in the tissue after iron extraction, as checked with PIXE measurements.
↵16 For further details on the staining process, see (Weigelt, 2019).
↵17 For converting volume to mass susceptibility, we used a tissue density of 1 g/cm3.


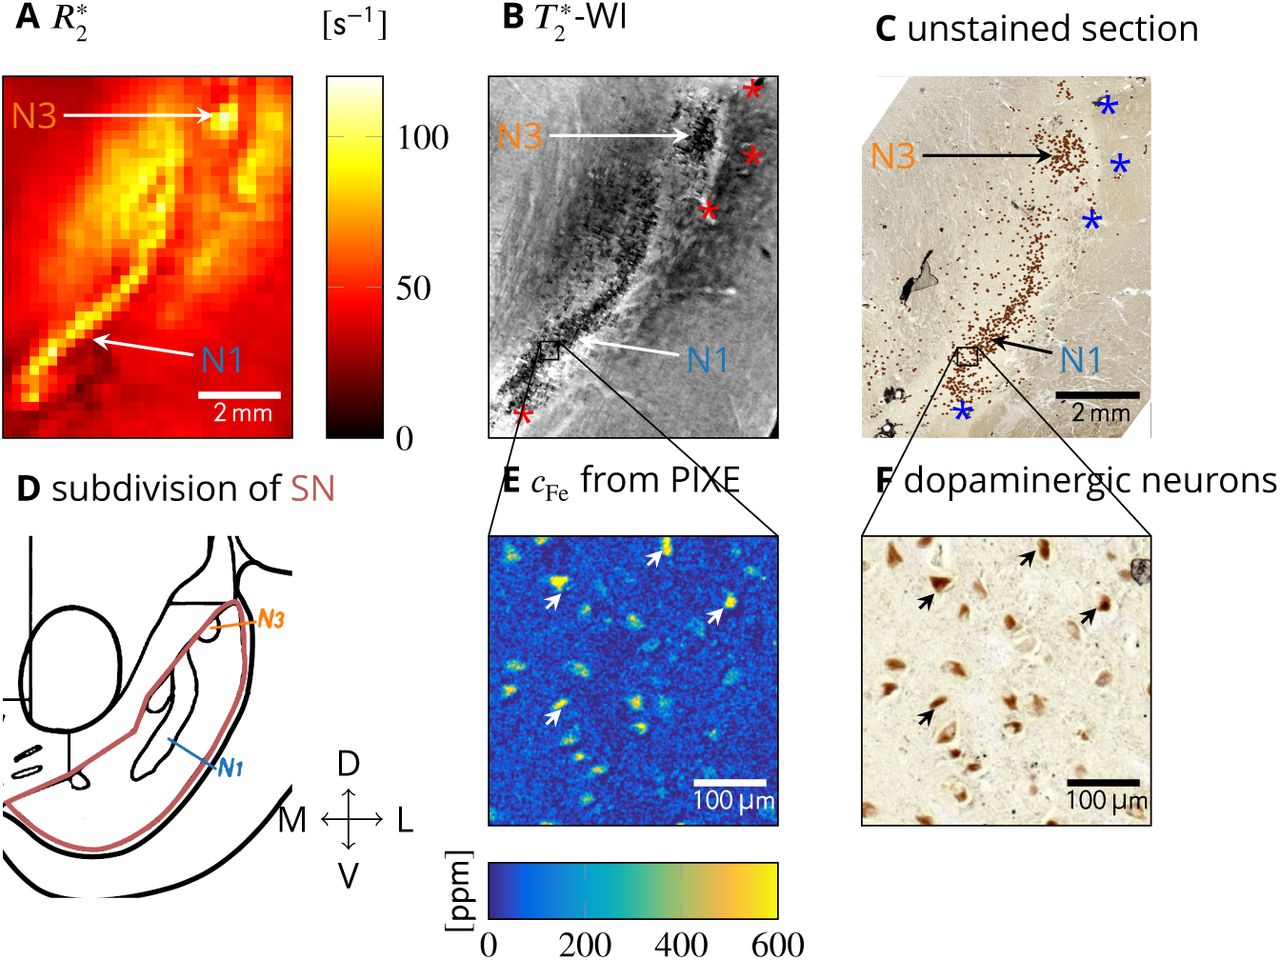
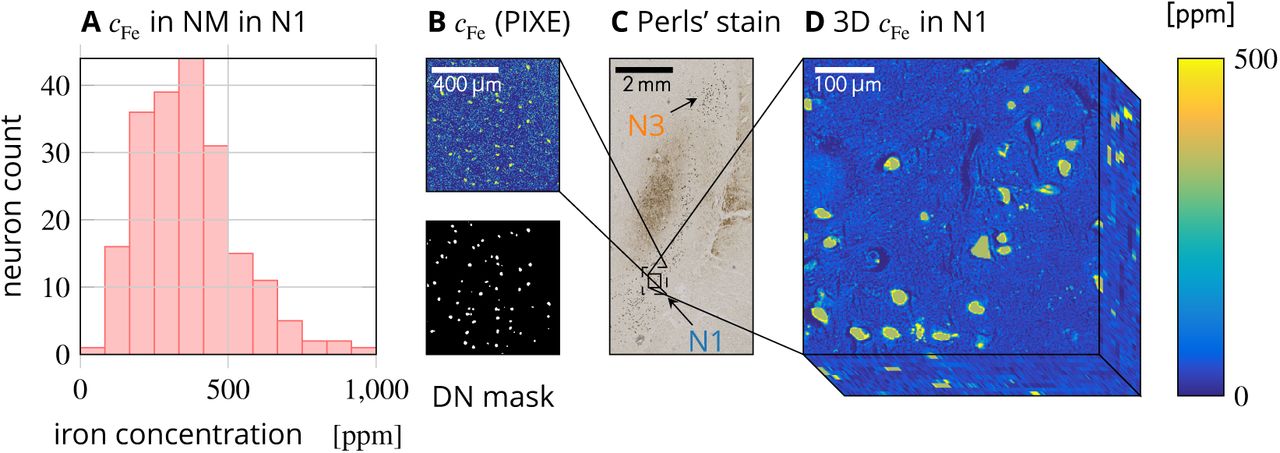
References


