

Summary
Adaptive memory recall requires a rapid and flexible switch from external perceptual reminders to internal mnemonic representations. However, owing to the limited temporal or spatial resolution of brain imaging modalities used in isolation, the hippocampal-cortical dynamics supporting this process remain unknown. We thus employed an object/scene cued recall paradigm across three studies, spanning single neuron recordings, intracranial as well as high-density EEG and fMRI. First, a hippocampal gamma power/spike rate increase distinguishing successful vs. unsuccessful recall emerged 500 ms after cue onset. Intriguingly, hippocampal gamma peaks marked the moments at which extrahippocampal activation patterns shifted from perceptual cue towards mnemonic target representations. In parallel, source-localised EEG (corroborated by fMRI) revealed a recall signal progressing from hippocampus to posterior parietal cortex and then to medial prefrontal cortex. These results identify the hippocampus as the switchboard between perception and memory and elucidate the ensuing hippocampal-cortical dynamics supporting the recall process.
Introduction
Imagine spotting a familiar face at a conference. Your eyes meet, and as your acquaintance approaches, you frantically try to recall the last time the two of you met and – without sneakily glancing at the name tag – remember what his or her name was. This example illustrates how adaptive behaviour often requires us to shift our focus from external sensory information to internal mnemonic representations. In experimental terms, this scenario constitutes a cued recall task, where a reminder cue may or may not trigger recall of associated mnemonic target information. How does our brain accomplish the feat of converting an external reminder into a target memory?
According to theoretical and empirical work, the hippocampus plays a key role in encoding and retrieving associative memories in a flexible and domain-general manner (Davachi, 2006; Eichenbaum et al., 1992; Mayes et al., 2007). In particular, during encoding the hippocampus is thought to link disparate cortical representations (e.g., a face and a name) into a coherent memory trace (Lisman, 1999; Staresina and Davachi, 2009; Wallenstein et al., 1998). It retains pointers/indices to the cortical sites involved in the initial experience (Teyler and DiScenna, 1986; Teyler and Rudy, 2007), such that presenting a partial reminder prompts reinstatement of the entire association via hippocampal pattern completion (Grande et al., 2019; Horner et al., 2015; Marr, 1971; Norman and O’reilly, 2003; Staresina et al., 2013). However, whether the hippocampus and its purported role in pattern completion indeed govern the conversion from perceptual cues to mnemonic targets is unknown.
With the advent of multivariate pattern analyses (MVPA) (Kriegeskorte et al., 2006; Norman et al., 2006), human functional magnetic resonance imaging (fMRI) studies have provided links between hippocampal activation and cortical reinstatement of mnemonic target representations during successful recall (Bosch et al., 2014; Gordon et al., 2013; Ritchey et al., 2013; Staresina et al., 2012b). That said, the relatively poor temporal resolution of the fMRI signal leaves open whether the hippocampus precedes or follows mnemonic reinstatement, let alone whether hippocampal engagement would trigger a rapid switch from perceptual cue to mnemonic target representations.
Importantly, the cognitive complexity and representational richness of memory recall likely requires concerted engagement of wider brain networks (Olsen and Robin, 2020; Ranganath and Ritchey, 2012). Indeed, besides the hippocampus, neuroimaging work has consistently implicated a particular set of cortical regions in episodic memory tasks (Ritchey and Cooper, 2020; Rugg and Vilberg, 2013), herein referred to as the ‘cortical retrieval network’ (CRN). The CRN overlaps with the ‘default mode network’ (Buckner et al., 2008) and includes posterior parietal regions as well as medial prefrontal cortex. It has been linked to retrieval success across multiple stimulus domains (Hayama et al., 2012) as well as to episodic (re)construction processes (Benoit and Schacter, 2015; Hassabis and Maguire, 2007). Critically, a recent study employing ‘lesion network mapping’ (Boes et al., 2015) suggests that the hippocampus serves as a functional hub linking these cortical nodes in service of memory processes (Ferguson et al., 2019). While these results indicate that successful memory relies on intricate hippocampal-cortical interactions, fMRI alone cannot resolve the temporal dynamics within the CRN, e.g., whether hippocampal engagement precedes that of cortical nodes and whether there might be a particular activation sequence among those nodes, potentially bearing insights into their different functional contributions (Ritchey and Cooper, 2020).
In sum, understanding the hippocampal-cortical dynamics supporting memory recall has been hindered by the temporal ambiguities inherent in fMRI. We thus capitalised on the enhanced temporal resolution afforded by human electrophysiological recordings (Nobre and van Ede, 2020; Rugg and Curran, 2007; Staresina and Wimber, 2019), employing the same cued recall paradigm (Figure 1) across three studies, ranging from single-neuron to whole-brain recordings. First, we recorded intracranial Electroencephalography (iEEG) from hippocampus as well as extrahippocampal sites in pre-surgical epilepsy patients, including a case with hippocampal single unit microwire recordings. Using MVPA, our data revealed that for the first 500 ms, extrahippocampal activation profiles predominantly reflect the cue stimulus. At 500 ms, a hippocampal signal sets in (increases in high gamma power and firing rates), distinguishing between successful and unsuccessful recall. Based on trial-wise analysis of extrahippocampal activation patterns, we found that this hippocampal signal triggers the switch from perceptual cue to mnemonic target representations. Next, we used high-density scalp EEG to elucidate the role of the CRN during successful recall. Projecting our data into source space, we found that the CRN (as corroborated by a separate fMRI study) emerged at ~800 ms. Importantly though, there was a particular sequence of recall signals (alpha power decreases) within the CRN, progressing from the MTL via posterior parietal cortex towards medial prefrontal cortex. Together, these results reveal how the hippocampus triggers the conversion of perceptual cues to mnemonic targets, accompanied by sequential engagement of parietal and frontal retrieval networks.

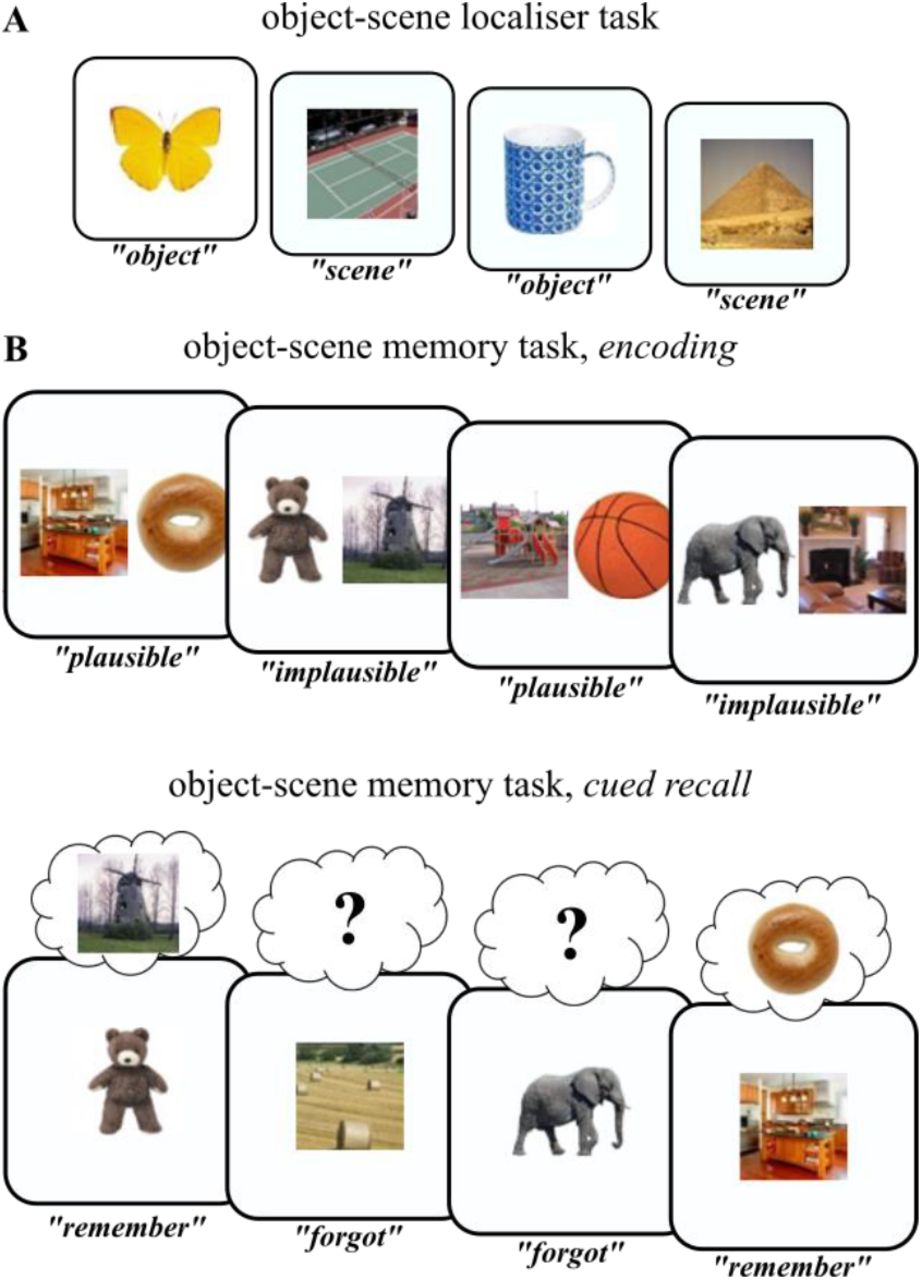
Experimental paradigm. A. In a localiser session, participants saw trial-unique images of objects and scenes and indicated the category of the given image. This part served as an independent training dataset for multivariate pattern analyses. B. The main experiment employed an object-scene memory task, consisting of an encoding phase (top) and a cued recall phase (bottom). During encoding, participants saw trial-unique object-scene pairs and indicated whether the given combination was plausible or implausible. During cued recall, participants were given either the object or the scene image as the cue and were asked to recall the paired target (scene or object image, respectively). The key conditions were (i) trials in which participants indicated they did remember the target image (“Remember” trials) and (ii) trials in which participants indicated they did not remember the target image (“Forgot” trials).
Results
Behaviour
The same memory paradigm (Figure 1) was used across three studies – an iEEG study (n = 8), a high-density scalp EEG study (n = 20) and an fMRI study (n = 20; (Staresina et al., 2013)), with slight adaptations depending on the imaging modality (see Methods). For the intracranial and scalp EEG studies, we additionally conducted ‘localiser’ runs before and after the main memory experiment (Figure 1A) in which images of objects and scenes were presented separately (different images from those used in the memory task) and participants indicated via button press which category the image belonged to. This part served to train a classifier to distinguish brain patterns of object vs. scene representations (see below). In the memory experiment (Figure 1B), participants were presented with trial-unique combinations of object and scene images during encoding. The task was to imagine the given object in the given scene and indicate whether the combination was plausible or implausible. During retrieval, a cued recall task was employed in which only one of the images was shown (‘cue’), with the question whether the associated image (‘target’) was also remembered. Catch trials were interspersed in which participants were prompted to describe the target image after giving a “Remember” response.
In the iEEG study, accuracy on the localiser task was on average 94% (SEM = 2%) correct (mean Reaction Time (RT) = 1.47 s). During the cued recall task, iEEG participants indicated they remembered the target on 67% of trials and that they forgot the target on the remaining 33% of trials (SEM = 5%). During catch trials, accuracy was 94% (SEM = 2%). RTs were faster for “Remember” trials (M = 2.29 s, SEM = 0.20) than for “Forgot” trials (M = 5.22 s, SEM = 0.27; P = .008, Wilcoxon signed rank test). Importantly, “Remember” RTs did not differ significantly for object vs. scene targets (P = .844, Wilcoxon signed rank test).
In the scalp EEG study, accuracy on the localiser task was on average 98.45% (SEM = 0.45%) correct (mean RT = 1.63 s). During cued recall, participants remembered 60% and forgot 40% of target images (SEM = 3%). Accuracy on catch trials was 92% (SEM = 2%). RTs were faster for “Remember” trials (M = 1.61 s, SEM = 0.08) than for “Forgot” trials (M = 2.37 s, SEM = 0.17; P < .001). Again, RTs did not differ for object vs. scene targets (P = .67).
In the fMRI study, RTs were again faster for “Remember” trials, with no difference between object vs. scene targets (see Staresina et al. (2013) for details).
A hippocampal recall signal at 500 ms – gamma power, alpha power and firing rates
Our first analysis examined spectral power in the hippocampus (Figure 2A) during successful vs. unsuccessful cued recall (“Remember” vs. “Forgot”). As shown in Figure 2B, we observed an extended cluster in the gamma frequency range (65-115 Hz, 0.51-1.56 s) in which “Remember” trials elicited greater power than “Forgot” trials (cluster P < .005 (corrected), average cluster t(7) = 4.05). This finding replicates and extends a previous report in which we found enhanced gamma power (~50-90 Hz, ~0.5-1.3 s) for successful vs. unsuccessful associative recognition memory (Staresina et al., 2016). Of note, that study also revealed a later power decrease in the alpha band (~1-2 sec, centred around 10 Hz) for successful associative recognition. Indeed, a more targeted analysis also revealed a significant decrease for “Remember” relative to “Forgot” trials in our current paradigm, ranging from 0.85 s to 1.36 s and spanning frequencies from 9-17 Hz (Figure S1).
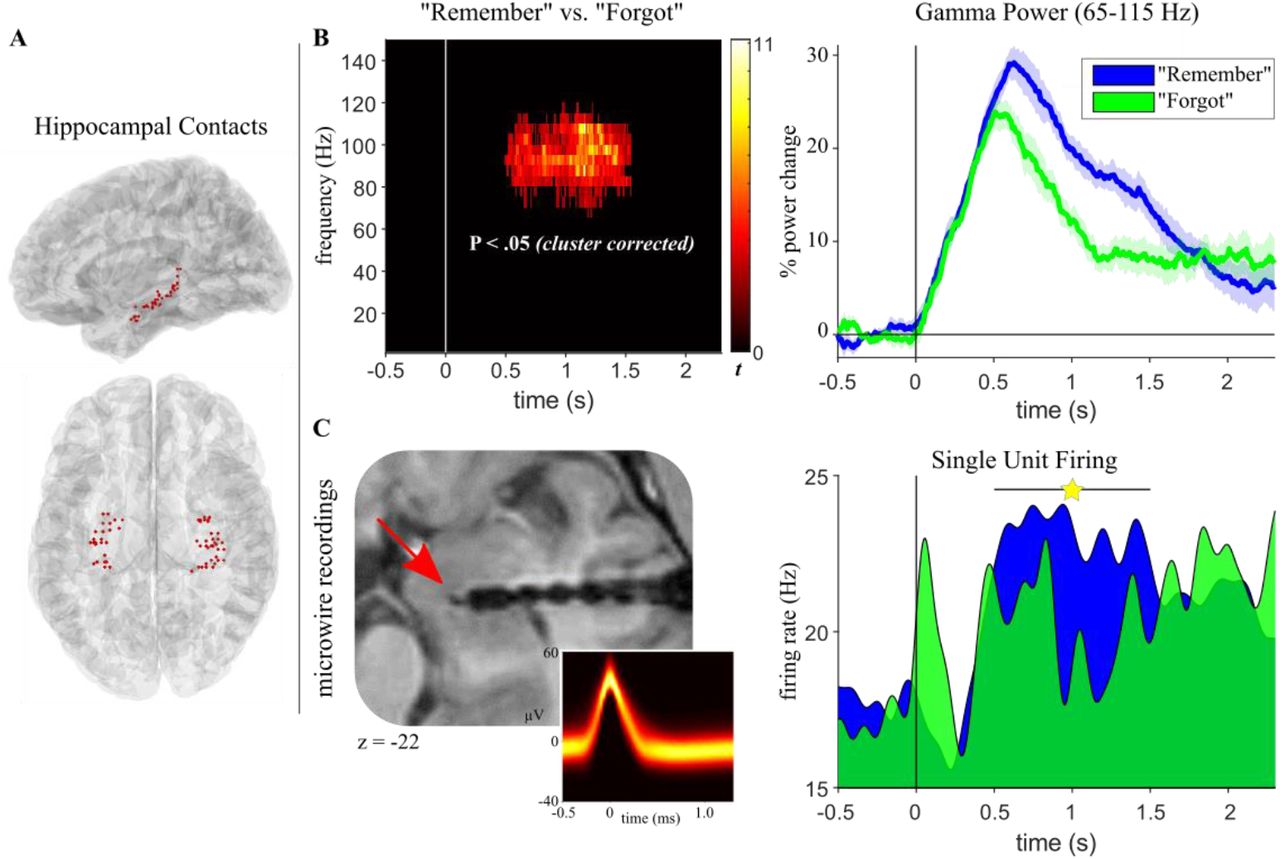
Hippocampal recall signal. A. Hippocampal electrode coverage across participants shown on a normalised sagittal (top) and horizontal (bottom) brain template. B. Left: Results from a time-frequency analysis (P < .05, corrected), contrasting “Remember” vs. “Forgot” trials and revealing a cluster in the high gamma range (65-115 Hz) with power increases for “Remember” trials. Right: Power time courses for “Remember” (blue) and “Forgot” (green) trials in the significant gamma cluster, highlighting enhanced and sustained engagement for “Remember” trials starting at 500 ms post cue onset. Lines show condition means +/- SEM of condition differences across participants. C. Left: Patient with additional microwire recordings in the hippocampus (red arrow) shown on the normalised post-implantation anatomical MRI. Inset shows waveforms of action potentials in a single hippocampal neuron depicted as temperature-scaled density plots. Right: Firing rates (Hz) of the hippocampal neuron across time for “Remember” (blue, n = 168) and “Forgot” (green, n = 24) trials. Spike trains were first convolved with a Gaussian kernel (50 ms width, 1ms time resolution) to obtain continuous representations of instantaneous neuronal firing rates. Star indicates a significant increase for “Remember” trials between 0.51 and 1.56 s.
What is the underlying nature of the hippocampal gamma power effect? Based on non-human primate recordings, it has been argued that high/broadband gamma signals reflect (multi-) unit spiking activity (Buzsáki et al., 2012; Ray and Maunsell, 2015). Human recordings have revealed a positive correlation between the fMRI blood-oxygen-level-dependent (BOLD) signal and both spikes and high-frequency local field potentials (LFPs; 40-130 Hz) in auditory cortex (Mukamel et al., 2005), but a direct link between unit firing and gamma power in the human hippocampus is lacking. In one of our patients, additional microwires were implanted to measure single unit firing rates from the hippocampus (Figure 2C). We therefore derived firing rates (Hz) for “Remember” trials (n = 168) and “Forgot” trials (n = 24) from a single hippocampal neuron (see Methods) and statistically compared these firing rates in the time window in which the group gamma power effect was observed (0.51-1.56 s). As shown in Figure 2C, results indeed revealed a significant increase for “Remember” trials (z = 2.55, P = .011, Wilcoxon rank sum test). Moreover, we found that hippocampal firing rates strongly and positively correlate with spectral power specifically in the high gamma range on a trial-by-trial level (Figure S2). Together, these results link the hippocampal gamma power increase for “Remember” trials to an increase in neuronal firing rates.
The hippocampal recall effect between ~500 and 1500 ms (Figure 2B) could in principle emerge from two different scenarios. On the one hand, it could represent a ‘hardwired’ peak at ~500 ms reflecting input propagation delays from visual cortex (Mormann et al., 2008), followed by sustained engagement from 500-1500 ms to accompany/facilitate the recall process. On the other hand, this pattern could also emerge from more transient events (e.g., discrete bursts (van Ede et al., 2018)) occurring at different latencies across trials, with gamma peak latencies perhaps tracking trial-specific response times (RTs). To adjudicate between these alternatives, we first plotted hippocampal gamma power (65-115 Hz) for all “Remember” trials as a function of response latency. As shown in Figure 3A, this revealed a highly consistent peak at ~500 ms post cue onset, regardless of a trial’s RT. To explicitly test for sustained hippocampal engagement during successful recall, we then separated each participant’s “Remember” trials into ‘short’ and ‘long’ RTs based on a median split. Indeed, comparison of the two trial types revealed sustained gamma power for long RT trials relative to short RT trials (Figure 3B). These results suggest that a hippocampal recall signal sets in at ~500 ms post cue onset and accompanies/facilitates the recall process thereafter (see Discussion).

Temporal profile of the hippocampal recall signal. A. Hippocampal gamma power (65-115 Hz, z-scored across time from −.5 s to reaction time (RT)) across all artifact-free “Remember” trials (pooled across participants), sorted based on trial-specific RT (white line). Dotted vertical line marks 500 ms post cue onset. B. Hippocampal gamma power (65-115 Hz) for “Remember” trials (cf. Figure 2B), separated – for each participant – based on a median split of RTs into short (< median; dark blue) and long (> median; light blue). Lines show condition means +/- SEM of condition differences across participants. Star indicates interval of significantly sustained gamma power for ‘long RT’ trials (from 1.61-2.3 s, P < .05, corrected).
From perception to memory via the hippocampus
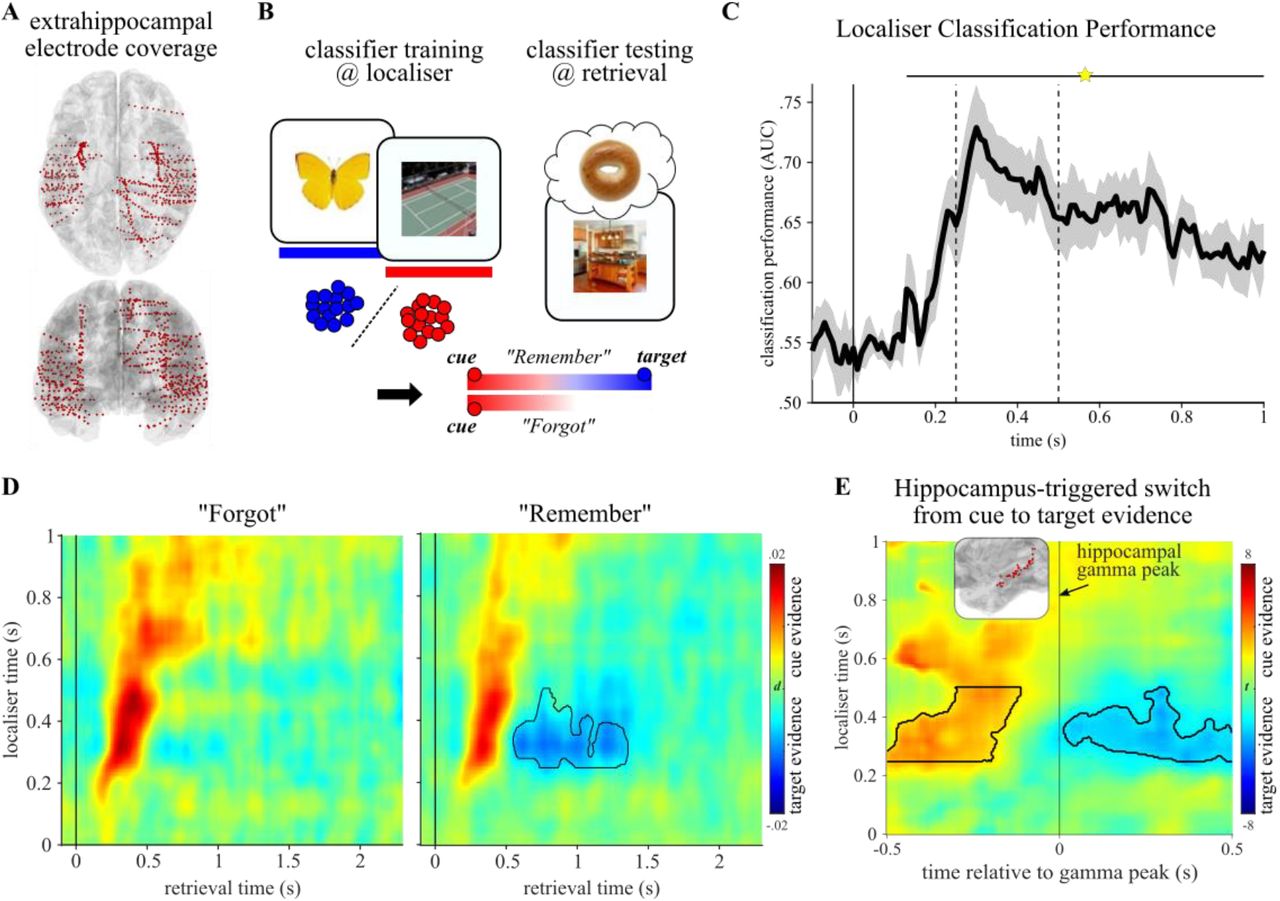
Does the hippocampal recall signal constitute the switch from perceptual to mnemonic representations? Our approach to address this question is outlined in Figure 4B. First, we used all extrahippocampal iEEG contacts (Figure 4A) to train a classifier (linear discriminant analysis, LDA) on object vs. scene trials during the independent localiser session. The resulting training weights were then applied during recall trials. For example, if the cue was a scene image and the target was an object, we would first expect stronger classifier evidence for scene representations. During “Remember” trials only, the classifier evidence should switch towards object representations. The exact opposite pattern should be seen for object cue-scene target trials.

Switch from perceptual to mnemonic representations in the iEEG data. A. Extra-hippocampal electrode coverage across participants shown on a normalised horizontal (top) and coronal (bottom) brain template. B. Analysis strategy: A linear classifier was trained on an independent localiser to distinguish object (blue) vs. scene (red) representations. During retrieval, this classifier was used to quantify evidence for cue vs. target representations. Both “Remember” and “Forgot” trials should initially show cue evidence, but for “Remember” trials only evidence should eventually switch to target representation (in this example, from scene to object representation). C. Cross-validated classifier performance during the localiser session, indicating robust decodability of objects vs. scenes from 130 ms onward (star, P < .05 corrected), with a peak between 250 and 500 ms (vertical dashed lines). D. Localiser time x retrieval time cross-classification. Hot colours indicate cue evidence, cold colours indicate target evidence. Both “Forgot” (left) and “Remember” (right) trials show strong cue evidence within the first 500 ms. Critically, “Remember” trials show a switch from cue to target evidence between ~500 and 1500 ms (black contour highlights significant cluster, P < .05, one-tailed, corrected, localiser data restricted to peak from 250-500 ms). E. For “Remember” trials, localiser time x retrieval time maps were realigned, on a trial-by-trial basis, to the time point of maximal hippocampal gamma power (65-115 Hz, Figure 2B). Results show significant cue evidence before and significant target evidence after the hippocampal gamma peak (t maps from a contrast against 0). Black contours highlight significant cluster, P < .05, two-tailed, corrected (localiser data restricted to peak from 250-500 ms).
Using 5-fold cross-validation, we first verified that object vs. scene images could be reliably decoded during the localiser. Results confirmed high classifier accuracy (Figure 4C), with peak performance between 250-500 ms post stimulus onset reaching >70% accuracy (significant cluster from 130-1000 ms, P < .005 (corrected), average cluster t(7) = 5.73). To capture object and scene representations during recall, each localiser time point (from 0 to 1 s) was then used for training and each retrieval time point (0 to 2.3 s) was used for testing. In the resulting localiser time x retrieval time map, positive classifier values (‘decision values’) reflect cue evidence and negative values reflect target evidence. As shown in Figures 4D and S4, retrieval representations were strongly cue-driven within the first 500 ms for both “Remember” and “Forgot” trials. Critically though, only “Remember” trials then showed evidence for a representational switch from the cue to the target category (for separate object cue-scene target and scene cue-object target data, see Figure S4B). Specifically testing for target evidence, a significant cluster emerged for “Remember” trials from 550-1355 ms (P = .020 (one-tailed, corrected), average cluster t(7) = −2.35), with no target evidence during “Forgot” trials. Indeed, target evidence was significantly stronger for “Remember” compared to “Forgot” trials (reaching significance from 660-905 ms, P = .008 (corrected), average cluster t(7) = −2.94). These results show that after 500 ms, extrahippocampal activation patterns switch from cue to target representations during successful recall. It deserves explicit mention that this representational switch occurred during “Remember” trials despite the fact that the cue image remained on the screen for the entire duration of the retrieval trial (see Methods).
Inspection of gamma power time courses (Figure 2B) and classification maps (Figure 4D) raises the intriguing possibility that the hippocampal gamma power increase during “Remember” trials might mark the very moment at which the brain switches from cue to target representations. To test this notion directly and taking the natural variability in gamma peak latencies across trials into account (Figure 3A), we repeated the classification analysis, but realigned each trial to its hippocampal gamma power peak (within a 500 ms search window around the group’s median gamma power peak for “Remember” trials). Strikingly, as shown in Figure 4E, results indicate significant cue evidence in the 500 ms window before the hippocampal peak (P = .008, mean cluster t(7) = 3.14, extending to −115 ms relative to the hippocampal peak) and significant target evidence in the 500 ms window after the hippocampal peak (P = .016, mean cluster t(7) = −2.72, starting at +15 ms relative to the hippocampal peak). A direct comparison of classifier evidence in the 500 ms pre-vs. 500 ms post hippocampal peak (collapsing across the 250-500 ms localiser window) yielded a significant difference, as did the comparison of classifier evidence from 0-500 ms post cue onset vs. 0-500 ms post hippocampal peak (both P = .008, Wilcoxon signed-rank test).
Hippocampus-triggered recall signals across the cortical retrieval network – fMRI and source-localised EEG alpha power
Results from our iEEG sample showed that 500 ms after cue onset, a hippocampal signal distinguishes successful from unsuccessful cued recall and triggers a switch from cue-to target representations. As mentioned in the introduction though, hippocampal engagement alone is unlikely to be sufficient for full-blown memory recall. What are the cortical dynamics supporting the recall process? To address this question and given the sparse and variable cortical coverage in our iEEG recordings, we conducted the same experiment in a sample of 20 healthy participants using high-density scalp EEG.
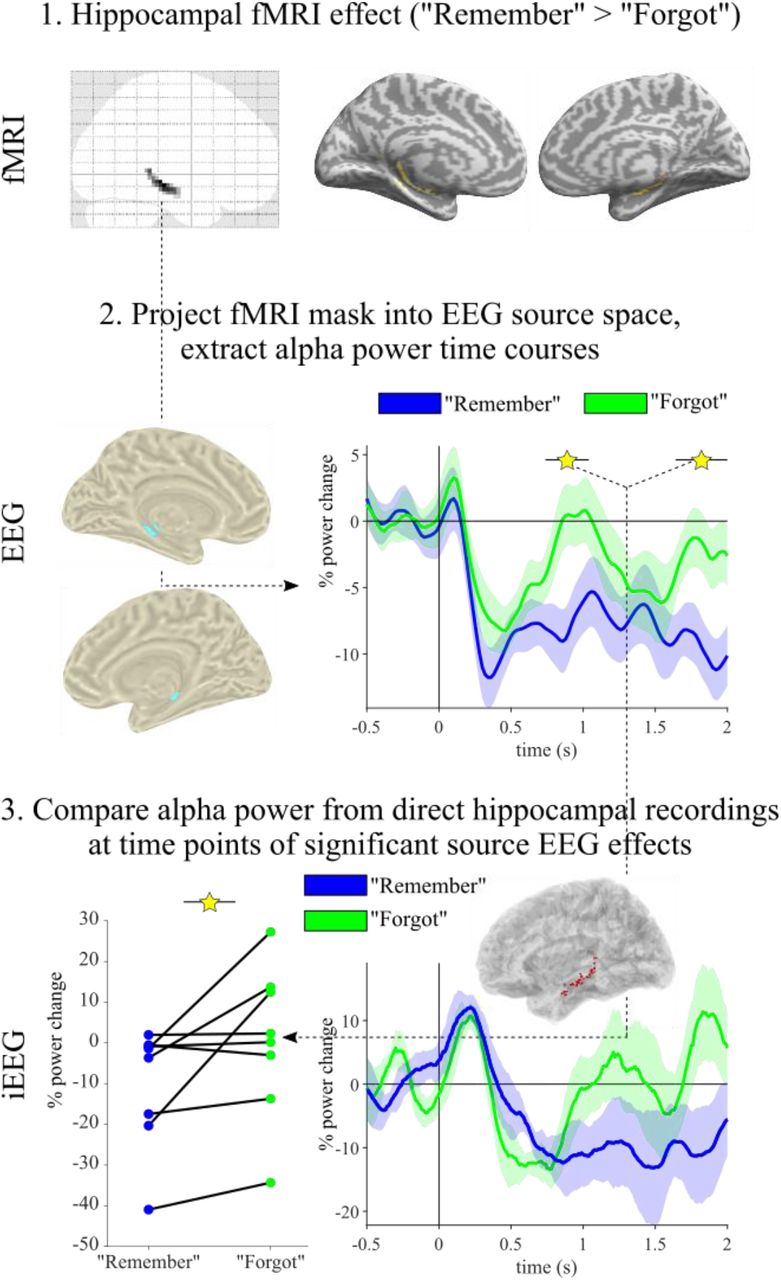
We recently showed that decreases in alpha power (~8-12 Hz) track memory strength in the cortical retrieval network (CRN, (Martín-Buro et al., 2020)). We therefore projected the sensor EEG data into source space (see Methods) and extracted alpha power in the resulting virtual voxels (see Figure S6 for the complete time-frequency-sensor analysis). To localise whole-brain recall effects, we first averaged alpha power from 500-1600 ms post stimulus onset (i.e., from the onset of the iEEG hippocampal recall effect to the average RT for “Remember” trials) and contrasted “Remember” vs. “Forgot” trials. As shown in Figure 5B, results revealed significant alpha power decreases in the CRN, encompassing medial and lateral temporal cortex, medial and lateral posterior parietal cortex and medial prefrontal cortex. As source localisation warrants some interpretive caution, particularly in deeper sources, we compared the source EEG results with an fMRI dataset employing the same paradigm (Staresina et al., 2013). As shown in Figure 5A and 5B, the comparison of “Remember” vs. “Forgot” trials yielded remarkably similar results for fMRI BOLD effects and EEG alpha power effects. We next capitalised on the temporal resolution of EEG to examine how the recall signal (alpha power decrease) evolves within the CRN across time. To this end, we repeated the comparison of “Remember” vs. “Forgot” trials, progressing from 0 to 1600 ms in 100 ms steps, each averaging alpha power across a +/- 50 ms time window. Each comparison was again cluster-corrected for multiple comparisons across virtual voxels. As shown in Figure 5C, the first time window to show a significant effect occurred at 800 ms and encompassed the medial temporal lobe. It is worth pointing out that this is also the time window in which our intracranial data showed an alpha power decrease for “Remember” trials in the hippocampus (Figure S1), providing a link between the two datasets and imaging modalities. This link is further corroborated by a comparison of hippocampal alpha power in the iEEG data with significant hippocampal voxels from the fMRI study projected into EEG source-space (Figure S7). In any case, at ~1000 ms the recall effect encompassed medial and lateral posterior parietal cortex (PPC), followed by a recall effect in medial prefrontal cortex (mPFC) at ~1200 ms. These results reveal a hitherto unknown sequence of recall signals within the CRN, starting in MTL and proceeding via PPC to mPFC regions.

Recall dynamics in the cortical retrieval network. A. fMRI results from the contrast of “Remember” vs. “Forgot” trials, thresholded at P < .05 (family-wise-error (FWE) corrected) shown on a rendered, normalised structural MRI template. Right inset shows the restricted brain coverage (bright area) in that study. Bilateral views are shown in Figure S5. B. Results from source-localised EEG alpha (8-12 Hz) power, averaged from 500-1600 ms and comparing “Remember” vs. “Forgot” trials (P < .05, cluster corrected). The network of alpha power decreases for “Remember” trials closely resembled BOLD increases shown in A. C. Time-resolved comparison of “Remember” vs. “Forgot” trials, proceeding in 100 ms steps (each map thresholded at P < .05, cluster corrected). The first significant effect emerged at 800 ms in the medial temporal lobe (MTL), followed by posterior parietal cortex (PPC) at 1000 ms and medial prefrontal cortex (mPFC) at 1200 ms. Additional views are shown in Figure S6.
Discussion
Our study elucidates the role of the hippocampus as a switchboard from perception to memory and unveils the ensuing cortical dynamics supporting the recall process. Using a simple and robust cued recall paradigm (Figure 1), iEEG recordings first revealed a hippocampal signal in the high gamma range distinguishing between successful and unsuccessful recall from 500 ms onwards (Figure 2B). A case with concurrent microwire recordings suggests that this high gamma effect reflects an increase in neuronal firing rates (Figure 2C and S2). Using multivariate pattern analysis (MVPA), we observed – for successful recall only – a representational switch from the cue stimulus category (< 500 ms) to the target stimulus category (> 500 ms; Figure 4D). Time-locking the MVPA to hippocampal gamma peaks showed cue evidence before and target evidence after these peaks (Figure 4E), indicating that the hippocampus triggers the conversion from perceptual input to mnemonic output. Zooming out of the hippocampus with fMRI and high-density scalp EEG, we first established engagement (BOLD increase, alpha power decrease) of the cortical retrieval network (CRN) during successful recall, including posterior parietal cortex (PPC) and medial prefrontal cortex (mPFC) (Figure 5A and 5B). Critically, using time-resolved alpha power in source space, we found a particular recall cascade across the CRN: Starting at ~800 ms in the MTL, successful recall subsequently recruited PPC at ~1000 ms, followed by mPFC at ~1200 ms.
The hippocampus as the switchboard from perceptual cues to mnemonic targets
We show that the switch from cue to target representations in extrahippocampal sites is time-locked to the hippocampal gamma peak (Figure 4E). This finding arguably provides the strongest empirical evidence thus far for the long-held notion that the hippocampus orchestrates cortical pattern completion (Marr, 1971; Norman and O’reilly, 2003; Teyler and DiScenna, 1986). Owing to modality-specific methodological limitations across species, such empirical evidence has been challenging to obtain. That is, fMRI lacks the temporal resolution to pinpoint a hippocampal signal preceding target reinstatement, although recent analytical advances have yielded some progress in resolving fine-grained memory dynamics with fMRI (Schuck and Niv, 2019; Staresina et al., 2013). Scalp EEG and MEG, combined with advanced source reconstruction methods (Gross, 2019; Michel et al., 2004), in principle provide adequate levels of spatial and temporal precision to uncover whole-brain memory dynamics (Bergström et al., 2013; Martín-Buro et al., 2020). However, ambiguities remain when interpreting activation in deeper sources such as the medial temporal lobe (MTL), at least without converging evidence from other imaging modalities. Recent optogenetic studies in mice have shown that experimental activation of hippocampal cell assemblies elicits contextual fear behaviour (Liu et al., 2012) and that silencing hippocampal cells abolishes reinstatement of memory representations in cortical structures such as entorhinal cortex, perirhinal cortex and retrosplenial cortex (Tanaka et al., 2014). However, it remains open to what extent contextual fear conditioning captures the intricacies of episodic memory recall in humans. Moreover, these studies remain agnostic about the fast temporal relationship between hippocampal and cortical engagement during episodic memory recall.
The hippocampal recall effect reported here (Figure 2) unifies and extends a series of recent human electrophysiological results. Specifically, a hippocampal recall signal starting at ~500 ms after onset of a retrieval cue has been reported for evoked field potentials (Staresina et al., 2012a), high gamma power (Staresina et al., 2016) and single neuron firing rates (Staresina et al., 2019), attesting to the complementary nature of these electrophysiological signals (Buzsáki et al., 2012). Figure 2B moreover illustrates the sustained nature of the hippocampal recall effect, extending from ~500-1500 ms post cue onset. We have interpreted the 500 ms onset as reflecting conduction delays from sensory regions to the hippocampus (Mormann et al., 2008) and the ensuing ~1 s period as reflecting recurrent hippocampal-cortical interactions in service of memory retrieval (Staresina and Wimber, 2019). However, this pattern could also emerge from transient bursts (van Ede et al., 2018) or ripples (Norman et al., 2019; Vaz et al., 2019; Vaz et al., 2020) igniting the recall process at different latencies across trials, perhaps tracking trial-specific response times (RTs). As shown in Figure 3A, our data point to a highly consistent gamma peak occurring at ~500 ms post cue onset irrespective of RT, corroborating the notion that 500 ms constitutes a relatively ‘hard-wired’ delay at which a hippocampal recall signal sets in, at least in the experimental context of our cued recall paradigm. This gamma peak latency is in agreement with single neuron firing latencies observed here (Figure 2C) and in previous studies examining memory-selective hippocampal neurons (Rutishauser et al., 2015; Staresina et al., 2019), as well as with event-related potential (ERP) recordings from the hippocampus (Smith et al., 1986). Importantly though, we also found that trials with longer RTs show more sustained hippocampal gamma power than trials with shorter RTs (Figure 3B), suggesting that hippocampal engagement accompanies extrahippocampal recall/reinstatement processes shown to unfold between 500 and 1500 ms (Jafarpour et al., 2014; Staresina et al., 2019; Yaffe et al., 2014) (see also Figure 4D and S4). It deserves mention that the consistent onset notwithstanding, the sustained recall signal may well include discrete gamma bursts/ripples (Norman et al., 2019; Vaz et al., 2019; Vaz et al., 2020).
Temporal dynamics in the cortical retrieval network
While the hippocampus may trigger (and accompany) successful recall, the process of reinstating a full-blown episodic memory and deploying adaptive behaviour most likely relies on intricate interactions across multiple cortical areas (Olsen and Robin, 2020; Ritchey and Cooper, 2020). Apart from content-specific areas involved in reinstatement (Ritchey et al., 2013; Staresina et al., 2012b; Wheeler and Buckner, 2004), recent fMRI research has revealed a brain network consistently emerging during successful recall (Rugg and Vilberg, 2013). Beyond the hippocampus, this network includes medial and lateral parietal cortex (PPC) and medial prefrontal cortex (mPFC), all of which are densely connected with the hippocampus (Aggleton, 2012; Ferguson et al., 2019). What is still unresolved, however, is the particular role each of the different cortical retrieval network (CRN) nodes plays (Ritchey and Cooper, 2020). For instance, BOLD activation profiles were found to differ between mPFC and parietal regions (Sestieri et al., 2011). Also, BOLD time course analyses revealed a transient recall signal in the hippocampus, medial PPC and mPFC, but a sustained response in lateral PPC, scaling with the duration for which episodic details had to be maintained before making a response (Vilberg and Rugg, 2012, 2014).
Here we first confirmed involvement of the CRN, reanalysing an fMRI study employing the same memory paradigm (Staresina et al., 2013) (Figure 5A and Figure S5; note that brain coverage focused on MTL regions and thus did not fully capture parietal or mPFC regions). Next, we projected our high-density EEG data into source space and extracted alpha power for “Remember” and “Forgot” trials. As shown in Figure 5 and Figure S6, juxtaposing the fMRI BOLD effects with the source-localised alpha power effects, both derived from the same memory paradigm, reveals a striking correspondence in the topography of the two measures. This result is consistent with the tight inverse relationship between fMRI BOLD and alpha power (Hermes et al., 2017; Laufs et al., 2003; Scheeringa et al., 2011) and corroborates the feasibility of source-localised M/EEG alpha power to study whole-brain memory dynamics (Martín-Buro et al., 2020). Capitalising on the time resolution of EEG, we next examined the temporal dynamics within the CRN. As shown in Figure 5C, results uncovered a temporal dissociation of recall signal onsets. Starting at ~800 ms in the MTL, a recall signal then emerged in medial PPC at ~1000 ms, followed by mPFC at ~1200 ms. It is interesting to note that while hippocampal, medial PPC and mPFC recall signals were rather transient, lateral PPC (left Angular Gyrus) showed a sustained effect co-terminating with the average RT (Figure 5C, bottom), consistent with recent fMRI results (Vilberg and Rugg, 2012, 2014).
How confidently can the initial recall signal (~800 ms) be localised to the hippocampus? Involvement of the hippocampus in this recall task is not only corroborated by our fMRI data, but our intracranial recordings revealed a hippocampal alpha power effect spanning the same time and frequency window (Figure S1; see also (Staresina et al., 2016)). In fact, we explicitly demonstrate how alpha rhythms can unify fMRI, EEG and iEEG data from the hippocampus (Figure S7). Projecting the functional hippocampal clusters from our fMRI study into EEG source space revealed a significant alpha power decrease for “Remember” compared to “Forgot” trials in two extended time windows (the first emerging between 700 and 800 ms). In the same time windows, a significant difference in alpha power was also seen in our direct hippocampal recordings. This result adds to recent evidence emphasising the feasibility of using source-localised M/EEG recordings to examine hippocampal memory processes (Pu et al., 2018; Ruzich et al., 2019). It also suggests that the hippocampal alpha power decrease, shown to follow the hippocampal gamma power increase with a short delay (Figure S1 and (Staresina et al., 2016)), kick-starts the alpha power recall cascade across the cortical retrieval network.
In any case, the functional significance of the MTL-PPC-mPFC trajectory is unknown at present. There is ongoing debate about the role of different PPC regions (e.g., posterior midline, superior parietal lobule, inferior parietal lobule) in episodic retrieval (Cabeza et al., 2008; Wagner et al., 2005), but one prevalent view is that involvement of PPC regions scale with the amount of mnemonic evidence (Wagner et al., 2005). Likewise, the functional parcellation and the specific role of medial PFC in memory retrieval is still poorly understood (De La Vega et al., 2016), although there is consensus about a role of prefrontal areas in higher order information integration and action planning (Euston et al., 2012; Gilbert et al., 2006; Rushworth et al., 2004; Simons and Spiers, 2003). One tentative scenario could thus be that PPC serves as an ‘episodic buffer’ (Vilberg and Rugg, 2008), accumulating episodic details that are reinstated in content-specific areas through hippocampal pattern completion. Medial PFC might then integrate this mnemonic evidence with the current task set and initiate goal-directed behaviour.
Conclusion
Spanning single neuron data, intracranial EEG, source-localised scalp EEG and fMRI, our study elucidates – with remarkable convergence across imaging modalities – the hippocampal and cortical dynamics supporting flexible memory recall. Upon presentation of a reminder cue, the hippocampus orchestrates pattern completion and thereby switches the brain from a perceptual to a mnemonic state. This triggers a parallel cascade of recall signals in the cortical retrieval network (via posterior parietal cortex to medial prefrontal cortex), likely to steer successful recall and guide adaptive behaviour.
Materials and methods
Participants
Twenty healthy, right-handed participants (12 male, 8 female) with normal or corrected-to-normal vision volunteered in the EEG experiment. They were aged 20-33 years (μ = 25.01). An additional six participants had been rejected from analysis due to noisy EEG data (n=2), inconsistent Polhemus data (n=2), or poor memory performance (< 40% ‘Remember’ trials, n=2). All participants were fluent English speakers. Participants gave written informed consent and received course credits or financial remuneration. Ethical approval was granted by the University of Birmingham Research Ethics Committee (ERN_14-1379). In additional to functional recordings, structural MRIs were acquired for 15 participants.
For the intracranial EEG study, 7 patients from the Queen Elizabeth Hospital in Birmingham (UK) and one patient from La Paz University Hospital in Madrid (Spain), all suffering from medically intractable epilepsy, volunteered (6 male, 2 female, aged 24-53 μ = 35). Additional patient characteristics are listed in Table S1. Ethical approvals were granted by the National Research Ethics Service UK (code 15/EM/0182) and by the Clinical Research Ethics Committee at La Paz University Hospital Madrid (code IP-2401), respectively.
EEG acquisition and hardware
For the recording of behavioural responses and the presentation of instructions and stimuli, Psychophysics Toolbox Version 3 (Brainard, 1997) and MATLAB 2014b (MathWorks, Natick, USA) were used with Windows 7, 64-Bit running on a desktop computer. Stimuli were presented on a 15.6-inch CRT monitor (Taxan ergovision 735 TC0 99) with a resolution of 1280 x 1024 pixels and a refresh rate of 75 Hz. On-screen instructions were shown in Verdana font with a font size of 20 and participants were seated at about 50 cm from the screen. The left and right arrow keys, used with the index finger and middle finger of the right hand, served as response buttons throughout all phases of the experiment. They also corresponded to the response options on the screen that were shown below the image throughout the practice phase. During the main experiment, response options were shown as a reminder during the transitions between blocks. To proceed between different phases of the experiment, participants used the space bar. Electroencephalogram (EEG) was recorded with 128 sintered Ag/AgCl active electrodes and a BioSemi Active-Two amplifier. The signal was digitized at a rate of 1024 Hz on a second computer via ActiView recording software (BioSemi, Amsterdam, Netherlands). After EEG preparation, electrode positions and headshape were measured using a Polhemus FASTRAK device (Colchester, VT, USA) in conjunction with Brainstorm (Tadel et al., 2011).
iEEG acquisition and hardware
To record behavioural responses and present instructions and stimuli, a Toshiba Tecra laptop (15.6 inch screen) was used in Birmingham and a Dell Vostro 1720 laptop was used in Madrid (17 inch screen). Both operated on Windows 7, 64-Bit. Psychophysics Toolbox Version 3 (Brainard, 1997) was used with MATLAB 2014. Button assignment was identical to the EEG study. Intracranial EEG (iEEG) was recorded using laterally implanted depth electrodes. Electrode shafts contained 5-15 contacts. In one case, we additionally analysed hippocampal microwire recordings obtained from Behnke-Fried electrodes. Data were digitised at either 512 Hz (n=1) or 1024 Hz (n=7).
Experimental procedure
EEG
The stimulus material consisted of a total of 712 colour images sized 200 x 200 pixels, half depicting objects and half depicting scenes (Konkle et al., 2010; Staresina et al., 2013). The set was supplemented with additional images obtained via a Google search and chosen to match the main image set in style. Participants received written and verbal instructions. Additionally, short instructions were displayed on the screen before each block in the experiment as a reminder.
Prior to the main experiment, participants performed a ‘localiser’ run in which they were shown 100 images (50 objects, 50 scenes) presented in the centre of the screen. To account for possible EEG signal changes across the experiment, a second localiser run was performed after the memory experiment using a different set of 100 images. Before each run, participants additionally completed 10 practice trials (5 objects, 5 scenes) that were not recorded. The purpose of the localiser was to derive independent electrophysiological measures for object and scene processing for later analysis of the recall portion (see below).
Each trial started with a fixation cross presented for a jittered time of 1.5 ± 0.1 s. Subsequently, an object or scene image was superimposed on the fixation cross. To ensure that participants attend to the stimulus, they had to press a button to indicate whether the image depicts an object or a scene. After 1 s, a legend appeared at the bottom of the screen reminding participants of the assignment between left/right buttons and object/scene. To avoid contamination of the classifier by response mapping, this assignment was flipped in the second localiser run (initial assignment counterbalanced across participants). The trial terminated after a button press, although the image remained on the screen for a minimum of 2 s and a maximum of 10 s.
The main experiment consisted of 8 runs following the paradigm used in (Staresina et al., 2013). Each run was split into 4 blocks: a pre-encoding delay block, an encoding block, a post-encoding delay block, and a retrieval block. Before and after each block, a progress bar was displayed for 6 s, alerting participants to the impending start of the next block. During delay blocks, random numbers between 0 and 100 were shown, and participants pressed the left key for even numbers and the right key for odd numbers. This phase was self-paced, with a new number appearing immediately after a button press. Participants were encouraged to perform the task as fast as possible while maintaining high performance. Each delay block lasted 3 min.
Each encoding block consisted of 32 trials. Each trial started with a fixation cross presented for 1.5 ± 0.1 s. Subsequently, a unique, randomly chosen object-scene pair was shown. During 16 randomly assigned trials, the object appeared left of the centre and the scene appeared right, with the opposite arrangement for the other 16 trials. The object-scene pair remained on the screen until a button was pressed, but it was displayed for a minimum of 2.5 s and a maximum of 4 s. Participants indicated with the index finger that the object-scene pair was “plausible”, i.e., likely to appear in real life or nature, or used their middle finger to indicate that it was “implausible”.
Each retrieval block comprised 32 trials. Each trial commenced again with a fixation cross 1.5 ± 0.1 s. Subsequently, a cue was shown in the centre of the screen, either an object or a scene taken from the previous encoding block. The object-scene pair remained on the screen until a button was pressed, but it was displayed for a minimum of 2.5 s and a maximum of 6 s. Participants were asked to indicate whether they “remember” (index finger) or “forgot” (middle finger) the corresponding paired associate. Half of the cues were objects, the other half scenes. Across the 32 trials, each cue type (object or scene) was presented in mini-blocks of eight consecutive trials alternating between 8 object cues (O) and 8 scene cues (S), i.e., O-S-O-S or S-O-S-O. Participants were instructed to only press “remember” when their memory was vivid enough to give a detailed description of the associate. To ensure that this is indeed the case, in ~20% of the cases “remember” responses were followed by the instruction to enter a description of the target associate using the computer keyboard, followed by pressing the Enter-key (‘catch-trials’).
iEEG
For the iEEG study, the procedure was largely similar, with a few modifications. The stimulus pool for the memory portion consisted of 192 objects and 192 scenes (drawn from the same pool as described above). To accommodate different levels of cognitive capacity across epilepsy patients, we prepared three versions of the experiment, varying in the duration of each run. In Level 1, an encoding/retrieval block consisted of 8 trials, resulting in a total of 24 runs including a pre/post-encoding delay of 30 s. In Level 2, there were 12 runs with 16 trials per encoding/retrieval block and 60 s delay periods. In Level 3, there were 6 runs with 32 trials per encoding/retrieval block and 120 s delay periods. Which version was used depended on performance on a short practice run at difficulty Level 1. One patient performed the task at Level 1, three at Level 2 and the remaining four patients at Level 3. In terms of stimulus timing, responses were self-paced, but images remained on the screen for a minimum of 2 s and a maximum of 10 s (at which point the response was coded as ‘invalid’ and included in the ‘Forgot’ condition). Instead of typing in responses during the ~20% catch trials, patients verbally described the paired associate and responses were transcribed by the experimenter. In order not to overtax patients, runs were spread across 1-3 experimental sessions, with an effort to keep sessions close in time. Again, object/scene localiser runs were conducted before and after each memory session. The same set of 50 object and 50 scene images was used repeatedly, images and response legend remained on the screen for a minimum of 2 s and a maximum of 10 s, and switch of response finger assignment was introduced.
Preprocessing
EEG
EEG data were preprocessed using the FieldTrip toolbox for EEG/MEG analysis (Oostenveld et al., 2011). Data were downsampled to 256 Hz, high-pass filtered at 0.1 Hz using a windowed sinc FIR filter and low-pass filtered at 100 Hz using a Butterworth IIR filter. Furthermore, a band-stop filter was applied at 50 Hz to remove line noise. Localiser and memory data were then segmented into epochs. The temporal range of the epochs was −1 to 2 s around stimulus onset for localiser trials. For retrieval trials, the epoch started at −1 s and ended at the time of the button press +1 s, or at 6 s post-stimulus, whichever was shorter. Noisy EEG channels were identified by visual inspection and discarded. Subsequently, Infomax ICA (Bell and Sejnowski, 1995) was used to clean the data. To this end, all epochs were manually inspected and artifact trials containing muscle artifacts or mechanical artifacts (≈10%) were discarded. The resultant data were high-pass filtered above 1 Hz, all blocks from the localiser and memory experiment were concatenated to a single dataset and ICA was applied. Using visual inspection of the spatial patterns, time-series and power spectra, a number of ICA components associated with eye blinks, eye movements, and EMG were identified and rejected from the original localiser and memory experiment data (prior to manual artifact rejection and high-pass filtering). Next, EEG channels that were discarded earlier were interpolated using a weighted average of the neighbouring channels. Finally, the data were re-referenced using a Common Average Reference (CAR).
iEEG
For each patient, intra- and extrahippocampal contacts were identified based on the post-implantation structural MRI. Contacts with hardware artifacts were discarded based on visual inspection (average of 6% across patients). The numbers of contacts per patient included in the analyses are listed in Table S1. Subsequently, a Common Median Reference including all remaining contacts was used to re-reference the data. We used the same data-driven outlier rejection approach as for the EEG data: For univariate time-frequency analyses (Figure 2), the 10% most extreme power values across trials were discarded within each contact and for each time/frequency bin prior to collapsing all hippocampal contact per patient and calculating the patient-specific condition averages entering second-level analyses.
In one patient, 4 Behnke-Fried hybrid micro-macro electrodes (Ad-Tech Medical Instrument Corporation) were implanted (1 in the left hippocampus, 3 in the right hippocampus). Each Behnke-Fried hybrid electrode contained 8 high impedance microwire electrodes with a diameter of 38 μm, and one low impedance microwire extending from the tip. The low-impedance microwire was used for referencing. The data were recorded continuously throughout the experiment on an ATLAS Neurophysiology system (Neuralynx Inc.) with a sampling rate of 32 kHz and stored as a raw signal for processing and analysis. A total of 2 sessions were recorded from the patient. Each recording session lasted approximately 45 min. Offline spike detection and sorting was performed using Wave_clus 3 (Chaure et al., 2018). Sorted units were manually confirmed and classified as single units (SU), multi-units (MU), or artifacts based on spike shape and variance, peak-amplitude-to-noise level, the inter-spike interval (ISI) distribution of each cluster and presence of a refractory period. Units were taken forward to analyses if they showed a significant stimulus-evoked increase in firing rate. To this end, spike trains were first convolved with a Gaussian kernel (50 ms width, 1 ms time resolution) to obtain continuous representations of instantaneous neuronal firing. Next, we compared, across all experimental trials (n = 384), firing rates in the first second after stimulus onset with the 500 ms pre-stimulus baseline period. This was done via FieldTrip’s non-parametric cluster permutation method (Maris and Oostenveld, 2007), correcting for multiple comparisons across time (P < .05, two-tailed).
Two units showed a significant increase in firing rates, one of which was classified as a SU and one as a MU. We focused our analyses on the SU, but results (Figure 2C) remain unchanged when collapsing the two unit types.
EEG source modelling
FieldTrip (Oostenveld et al., 2011) was used to transform the EEG data from sensor to source space. Forward modelling was performed by first segmenting individual structural MRIs into grey matter, white matter, cerebrospinal fluid, skull, and scalp compartments. For 5 participants, individual MRIs were not available and the standard MNI template was used instead. As geometric model of the head, a hexahedral mesh with a shift of 0.3 was used. The FieldTrip-SimBio pipeline (Vorwerk et al., 2018) was then used with tissue conductivities of 0.33, 0.14, 1.79, 0.01, and 0.43 in order to create a Finite Element Method (FEM) volume conduction model. To co-register the MRI with the Polhemus coordinates of the electrodes, the fiducials (nasion, LPA, RPA) were manually identified in each MRI. An interactive plot was used to inspect and, if necessary, correct the resultant fit between the head model and the Polhemus coordinates. A source model was defined in MNI space by defining a grid with a 10 mm spacing. The grid was then inversely mapped onto each participant’s MRI. This assured that a given grid point corresponded to the same anatomical location across participants. In total, there were 3294 grid points within the brain.
To project the data into source space, linearly constrained minimum-variance (LCMV) beamformers were used (Van Veen et al., 1997). Localiser and retrieval trials were band-pass filtered in the 2 – 30 Hz band and trial-wise covariance matrices were calculated and averaged. Regularization was performed by adding a scaled identity matrix whose trace corresponded to 1% of the trace of the empirical covariance matrix. This yielded a sources-by-channels matrix W ∈ ℝS×C of beamformer weights that allowed to transform the data from sensor to source space via matrix multiplication.
Time-frequency analysis
For both EEG and iEEG, time-frequency analysis of the retrieval data was performed using FieldTrip. Frequency decomposition of the data was achieved via Fourier analysis based on sliding time windows (moving forward in 10-ms (iEEG) or 25-ms (EEG) increments). The settings were optimised for two frequency ranges. For a lower frequency range (2–29 Hz, 1-Hz steps, EEG and iEEG), the window length was set to five cycles of a given frequency and the windowed data segments were multiplied with a Hanning taper before Fourier analysis. For calculation of alpha power (8-12 Hz) in source space, time-frequency analysis proceeded in 2-Hz frequency and 50-ms time increments to accommodate increased computational demands. For higher frequencies (30–150 Hz, 5-Hz steps, iEEG only), we applied multitapering using a fixed window length of 400 ms and seven orthogonal Slepian tapers (resulting in spectral smoothing of ~±10Hz). We pursued a data driven approach to discard outliers (instead of manual artifact rejection). Specifically, for each participant, the 10% most extreme power values across trials were discarded within each channel and for each time/frequency bin prior to creating condition-specific averages. This procedure is equivalent to taking the trimmed mean, with the exception that only positive outliers were considered as raw power values cannot be negative.
Participant-specific condition averages were normalised with respect to a 500 ms pre-stimulus baseline window (percent power change). Analyses were restricted to 2.3 s post cue onset for iEEG data and to 1.6 s post cue onset for EEG data, as this marked the respective average response time for “Remember” trials across participants.
Multivariate analysis
Multivariate classification of single-trial EEG and iEEG data was performed using MVPA-Light, a MATLAB-based toolbox for multivariate pattern analysis (Treder, 2020). For all multivariate analyses, a linear discriminant analysis (LDA) was used as classifier (Fisher, 1936). It was trained on localiser data to discriminate between objects and scenes. LDA is characterised by a weight vector w ∈ ℝP (P = number of features), which represents the normal to the hyperplane, and bias b ∈ ℝ which represents the classification threshold. For two classes, these parameters are given by
 where Σ ∈ ℝP×P is the pooled covariance matrix and μObject and μscene are the mean voltages across object and scene trials, respectively. To increase the robustness of the model for small sample sizes, shrinkage regularisation was used (Blankertz et al., 2011). The empirical covariance Σ matrix was replaced by a convex combination of Σ and the identity matrix I scaled by a factor ν such that trace(νI) = trace(Σ),

The optimal value for the regularisation hyperparameter λ ∈ [0,1] was estimated using the Ledoit-Wolf approach (Ledoit and Wolf, 2004). When applied to a test sample x ∈ ℝP, the classifier produces a decision value (dval) that represents the signed distance to the hyperplane,

Here, a positive dval is evidence for the presence of a brain pattern associated with an object, whereas a negative dval is associated with a scene. The larger its magnitude, the more confident the classifier is about its prediction.
Z-scoring was applied across trials for each time point separately to normalise channel variances and remove baseline shifts. This was first done across trials within runs and then again across all trials after concatenating runs. Non-hippocampal contacts (27-115 depending on participant) served as features and a different classifier was trained for every training time point. To quantify whether object and scene cues can be differentiated, LDA was trained and tested on the localiser data (Figure 4C, no temporal smoothing applied). As metric, we used Area Under the ROC Curve (AUC) which is calculated based on the ranks of the dvals. The AUC value is interpreted as the probability that a random sample from the first class has a larger dval than a random sample from the second class, and hence it is a natural measure for the separability of two classes. To avoid overfitting, data were split into training and test sets using 5-fold cross-validation (Lemm et al., 2011). Since cross-validation results are stochastic due to the random assignment of trials into folds, the analysis was repeated five times and results were averaged.
To investigate the occurrence of object/scene representations in the retrieval phase (Figure 4D), we used the temporal generalisation method (King and Dehaene, 2014). Localiser and recall data were first smoothed using a running average window of 100 ms. A classifier was then trained for every time point in the localiser data (Figure 4D, vertical axis) and tested for every time point in the retrieval phase (horizontal axis). No cross-validation was required since localiser and retrieval datasets were independent. As metric, we used a transformation of the dvals which we refer to simply as evidence. Note that in trials with object cues, a positive dval is associated with the cue, whereas in trials with scene cues, a negative dval is associated with the cue. Therefore, the following transformation translates object/scene evidence into cue/target evidence irrespective of the cue,
 where dvalobject is the average of the dvals across object cue trials and dvalscene is the average of the dvals across scene cue trials. Evidence > 0 then indicates the presence of a multivariate pattern consistent with the cue (cue evidence), whereas evidence < 0 indicates a target pattern (target evidence).
To investigate how the timing of the switch from cue to target representation relates to hippocampal gamma power, we realigned each retrieval trial to its respective gamma peak. To this end, time-frequency data were z-scored and a single power time series was created by averaging power across hippocampal contacts within the 65-115 Hz range. Again, prior to averaging across frequencies and hippocampal contacts, a trimmed mean was used wherein power values above the 90-th percentile (across trials) were discarded. The resultant signal was smoothed using a 100 ms zero-phase moving average filter. Finally, MATLAB’s findpeaks function (MinPeakProminence = 0.05) was used to identify local maxima in the 0.4 – 0.9 s range. This search interval reflects a 500 ms window around the median latency of gamma peaks across participants for “Remember” trials as shown in Figure 2B (0.65 s, identified after smoothing the time courses with a 100 ms moving average filter). If one or more discrete gamma peaks were found in this interval, the respective time axis was realigned to the highest such peak such that the hippocampal gamma peak corresponded to t=0. The time generalisation analysis was then repeated on the realigned data and cue/target evidence was calculated (Figure 4E).
For the EEG data, objects/scenes were decoded in source space using searchlight analysis (Kriegeskorte, 2011) on the localiser data (Figure S3). Source-projected data were z-scored across trials for each voxel, for each of the two localiser runs separately. A sphere of radius 2 cm was centred on each of the 3294 voxels in the brain. All voxels within the sphere that were inside the brain volume (10-26 voxels) were selected as features. Five-fold cross-validation with five repetitions was used to estimate AUC values. Classification was performed for every time point in a trial and then averaged in the 250 - 500 ms post-stimulus window. This analysis was repeated for every voxel.
Statistics
For behavioural analyses, reaction times (RTs) within participants were summarised by calculating the median in order to mitigate the effect of outliers. At the group level, arithmetic mean (M) and standard error of the mean (SEM) are reported. Wilcoxon signed rank tests were used to compare RTs in “Remember” and “Forgot” trials, and for object and scene cues (in “Remember” trials). Unless stated otherwise, FieldTrip’s cluster permutation test (Maris and Oostenveld, 2007) was used to account for multiple comparisons for all time-frequency and classification analyses, both in sensor space and in source space. A dependent-samples t-test with a threshold of P < .05 was used to define initial clusters. Maxsum (sum of all t-values in cluster) served as cluster statistic and Monte Carlo simulations were used to calculate the cluster p-value (alpha = .05, two-tailed) under the permutation distribution. Analyses were performed at the group level. Input data were 2-D or 3-D images of either spectral power or classification decision values for two conditions. For the “Remember” vs “Forgot” comparison, we contrasted spectral power in iEEG hippocampal contacts (Figure 2B, Figure S1), decoding-based decision values in the retrieval phase (Figure 4D, Figure S4), and EEG spectral power (Figure 5B, Figure S6). For the EEG searchlight analysis in source space (Figure S3), a two-sided cluster permutation test with 1000 randomisations was used to contrast classification accuracy (objects vs. scene) against chance performance. For the extended iEEG localiser x retrieval cross-classification (Figure S4A), three different cluster permutation tests were performed. In the first two analyses, decision values in “Remember” and “Forgot” trials were separately compared against a baseline condition of zero. In the third analysis, “Remember” and “Forgot” were directly contrasted.
FMRI data
For detailed description of fMRI acquisition parameters, see (Staresina et al., 2013). Preprocessing included correction for differences in slice acquisition timing, followed by motion correction across all runs. While a region-of-interest approach was taken in the original report, we here pursued a whole-brain approach within our restricted field-of-view. To this end, data were additionally smoothed with a 6-mm FWHM kernel and normalised to the standard MNI template provided in SPM12. Events were modelled as 6 s epochs in a standard General Linear Model analysis, extracting condition-specific parameter estimates (beta estimates).
Resource Availability
Data and analysis code will be made publicly available upon publication.
Author Contributions
Conceptualization, M.T., B.P.S.; Methodology, M.T., B.P.S.; Software, M.T., I.C., S.M.; Formal Analysis, M.T., B.P.S.; Investigation, M.T., F.R., M.C.M.-B., B.P.S.; Resources, F.C.B., A.U.-C., V.S., R.C., S.H.; Data Curation, M.C.M.-B., D.T.R.; Writing – Original Draft, M.T., B.P.S.; Writing – Review & Editing, M.T., I.C., M.W., S.H., B.P.S.; Visualization, M.T., B.P.S.; Supervision, B.P.S.; Project Administration, B.P.S.; Funding Acquisition, S.H., B.P.S.
Declaration of Interests
The authors declare no competing interests.
Supplemental Material
iEEG patient characteristics. Bold numbers denote group averages. ‘Diffuse’ epileptic focus indicates that invasive monitoring did not yield a clear focus.

Hippocampal time-frequency map. Colours depict the difference in relative power for “Remember” vs. “Forgot” trials, averaged across participants. Black contours highlight two significant clusters: One in the high gamma range (65-115 Hz), P < .05 (two-tailed), cluster corrected from 0-2.3 s and 2-150 Hz (cluster P < .005, average cluster t(7) = 4.05). The second cluster emerged, at slightly relaxed statistical thresholds, in the alpha and low beta range (9-17 Hz), P < .05 (one-tailed), cluster corrected from 0.5-2 s and 2-29 Hz based on Staresina et al. (2016) (cluster P = .043, average cluster t(7) = −2.55). Note that the comparison of “Remember” vs. “Forgot” trials in an a priori defined frequency range of 8-12 (alpha band) and a time range of .5-2.3 s (from the onset of the hippocampal gamma recall effect to the average RT for “Remember” trials) was also significant (P = .039, two-tailed Wilcoxon signed rank test). Dashed horizontal line demarcates the different spectral analyses for lower (2-29 Hz) and higher (30-150 Hz) frequency ranges.
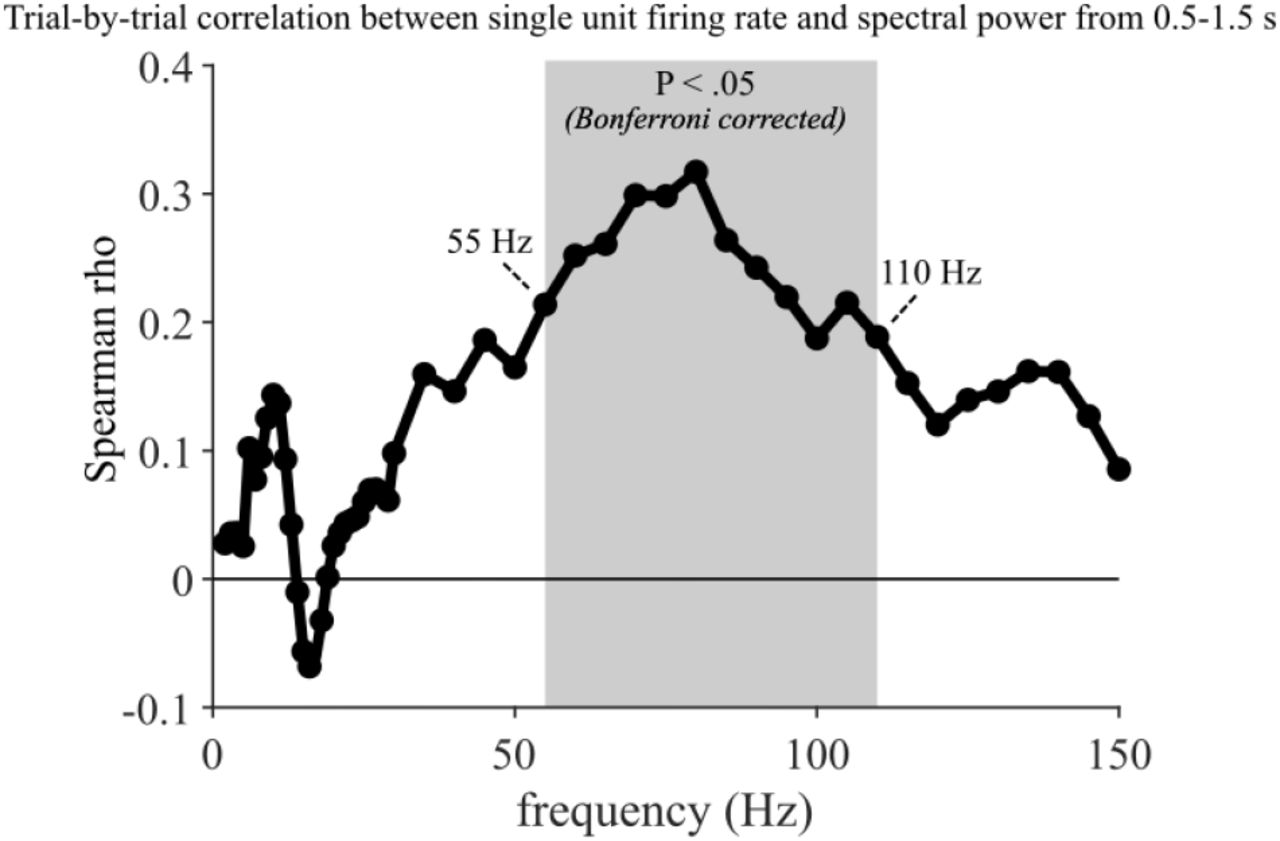
Trial-by-trial correlation between hippocampal (i) single neuron firing rates and (ii) spectral power, both averaged from .5-1.5 s. Shaded grey area highlight the frequency range in which correlation values (Spearman rho) survived Bonferroni correction (55-110 Hz), correcting for 53 comparisons (frequency range = 2 to 29 Hz in 1 Hz steps, then 30 to 150 Hz in 5 Hz steps, Pcritical = 0.0009).

Object/scene decoding of the EEG data via searchlight analysis in source space. Localiser data were projected into source space and object/scene classification was done via cross-validated LDA across moving searchlights (2 cm radius). Results were averaged from 250-500 ms post stimulus onset (to coincide with the classifier performance peak in the iEEG data, Figure 4C) and thresholded at P < .05 (cluster corrected). Note the robust object/scene decodability in occipito-temporal and ventral temporal cortex.

A. Localiser time x retrieval time cross-classification for the iEEG data. Hot colours indicate cue evidence, cold colours indicate target evidence. Contours highlight significant clusters (P < .05, two-tailed), corrected for .25-.5 s localiser time and 0-2.3 s retrieval time. For “Forgot” trials, only cue evidence was significant (P = .016, mean t(7) = 3.22, significant from 195-480 ms at retrieval). For “Remember” trials, both cue and target evidence were significant (cue evidence: P < .005, mean t(7) = 3.29, significant from 220-445 ms at retrieval; target evidence: P = .023, mean t(7) = −2.67, significant from 565-915 ms at retrieval). The direct comparison showed significantly stronger target evidence for “Remember” compared to “Forgot” trials (P = .008, mean t(7) = −2.94, significant from 660-905 ms at retrieval). B. Results in A averaged across the 250-500 ms localiser time window and plotted separately for object cue-scene target (solid lines) and scene cue-object target (dashed lines) trials. Positive values denote object evidence (blue), negative values denote scene evidence (red). Left: For “Forgot” trials, classifier evidence reflects the cue category and then returns to baseline levels. Right: For “Remember” trials, classifier evidence first reflects the cue category and at ~500 ms crosses over to reflect the target category.
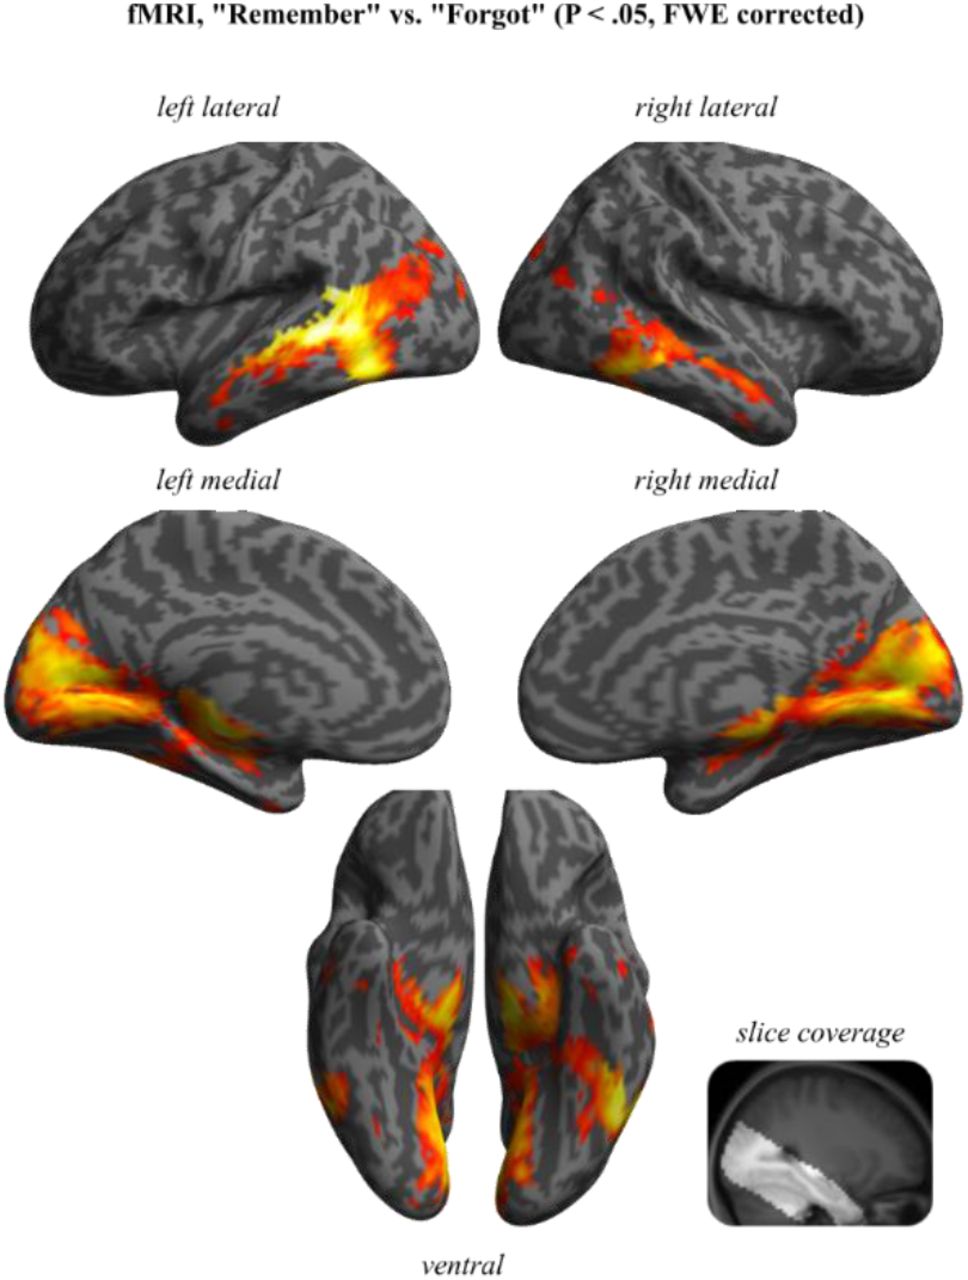
Results from a reanalysis for an fMRI dataset employing the same cued recall paradigm (Staresina et al., 2013). Maps show the contrast of “Remember” vs. “Forgot” trials, thresholded at P < .05 (family-wise-error (FWE) corrected with a minimum of 5 contiguous voxels) shown on rendered, normalised structural MRI templates. Right inset shows restricted brain coverage (bright area).

Extended results from the EEG study. A and B show results from a global time x frequency x sensor comparison for “Remember” vs. “Forgot” trials, including a time range from 0-1.6 s, a frequency range from 230 Hz and all 128 channels. This revealed a significant cluster (A, averaged across significant sensors) in which alpha power (spanning frequencies in the beta range but with a peak at 10 Hz) was reduced for “Remember” vs. “Forgot” trials from ~800-1600 ms post stimulus onset (cluster P < .001). The scalp topography of the effect (B, averaged across significant time/frequency bins) indicated a widespread extent, with a slightly stronger effects at left compared to right hemisphere sensors. C. Time-resolved comparison of alpha (8-12 Hz) power for “Remember” vs. “Forgot” trials in source space, proceeding in 100 ms steps (each map thresholded at P < .05, cluster corrected). The first significant effect emerged at 800 ms in the medial temporal lobe (MTL), followed by posterior parietal cortex (PPC) at 1000 ms and medial prefrontal cortex (mPFC) at 1200 ms.

Alpha rhythms link recall effects across fMRI, EEG and iEEG. Top: First, the fMRI contrast map shown in Figure S5 was restricted to an anatomical bilateral hippocampus mask (provided by Neuromorphometrics, Inc. under academic subscription and included in SPM12). Middle: The resulting functional-anatomical mask was then projected into EEG source space (1cm3 spatial resolution), resulting in one virtual hippocampal voxel in each hemisphere (left). Alpha power (8-12 Hz) time courses were then extracted from these voxels for “Remember” and “Forgot” trials and compared via FieldTrip’s cluster-based permutation test (correcting for multiple comparisons across time) (right). Two clusters emerged in which “Remember” trials showed significant decreases in alpha power relative to “Forgot” trials: One from 0.738 s – 1.039 s (Pcluster = .018, see also Figure 5C) and one from 1.641 s – 2 s (Pcluster = .008). Bottom: Alpha power (8-12 Hz) time courses were extracted from our direct hippocampal recordings in epilepsy patients and “Remember” vs. “Forgot” trials were contrasted across the significant time windows emerging from the EEG source analyses. Results confirmed a significant power decrease for “Remember” trials relative to “Forgot” trials (P = .039, Wilcoxon signed rank test). Left: Corresponding alpha power values for each participant (n=8). Right: Alpha power time courses. For comparability, both EEG and iEEG data are displayed until 2 s post stimulus onset.
Acknowledgements
This work was supported by a Wellcome Trust/Royal Society Sir Henry Dale Fellowship (107672/Z/15/Z) to B.P.S., a European Research Council Starting Grant (ERC-2017-StG 759432) to I.C., a European Research Council Consolidator Grant (647954) to S.H., a grant from the Wolfson Foundation and Royal Society to S.H., a grant from the Economic Social Sciences Research Council (ES/R010072/1) to S.H. and a European Research Council Starting Grant (ERC-STG-2016-715714) to M.W.


