

Abstract
The timing of reproductive behaviour – age at first sexual intercourse (AFS) and age at first birth (AFB) – has implications for reproductive health, adolescent development and evolutionary fitness. In the largest genome-wide association study to date (AFS, N=387,338; AFB, N=542,901), we identify 370 independent signals, 11 which are sex-specific, with a 5-6% polygenic score prediction. Heritability shifted from 10% for those born in 1940 to 23% for the 1965 birth cohort. Using Genomic SEM, we show that signals are largely driven by the genetics of reproductive biology and externalizing behaviour. This is supported by extensive biological follow-up that isolates key genes related to follicle stimulating hormone (FSHB), implantation (ESR1), infertility (endometriosis, spontaneous abortion) and spermatid differentiation, morphogenesis and binding (KLF17, ZPBP). Later AFB is protective against later-life disease (type 2 diabetes, cardiovascular) and associated with longevity. Those from higher childhood socioeconomic circumstances and polygenic scores in the highest deciles (90%+) experience markedly later reproductive onset. Results are relevant for interventions in teenage sexual, reproductive and mental health, deepen our understanding of the drivers of later-life health and longevity, and fuel infertility and functional follow-up experiments.
The timing of onset of human reproductive behaviour – age at first sexual intercourse (AFS) and age at first birth (AFB) – has implications for reproductive health, adolescent development and evolutionary fitness. First sexual intercourse has occurred increasingly earlier, by the age of 16 for one-third of contemporary UK teenagers.1 Early reproductive onset is linked to teenage pregnancy2 but also adverse health outcomes such as cervical cancer, depression, sexually transmitted diseases2 and substance use disorders.3, 4 In contrast to earlier sexual debut, we have witnessed progressively later ages at first birth for women, now reaching an average of 30 years in many modern societies and even later for men (Supp Note Fig S1).5 Late reproductive behaviour is associated with lower fecundity and subfertility6 and infertility traits such as endometriosis and early menopause,7, 8 with over 20% of women born after 1970 in many modern countries now remaining childless.9 Earlier ages of sexual debut and later ages at first birth has marked the decoupling of reproduction from sexual behaviour in many contemporary societies, with implications for sexual, reproductive and later-life health (Supp Note Fig S2).
Since reproductive behaviour is shaped by biology, disease and behaviour, a multidisciplinary approach is required to understand the common genetic aetiology and how it relates to health, reproductive biology and externalizing behaviour. Since the onset of reproductive behaviour generally occurs in adolescence to early adulthood, it is often linked to externalizing behaviour such as self-control and psychiatric (e.g., ADHD) and substance use disorders (e.g., smoking, alcohol use), often mediated by the environment (e.g., childhood socioeconomic conditions) (Supp Note Fig S3). Furthermore, it may be that individuals inherit a common genetic liability for a spectrum of interlinked complex traits related to reproduction, health and longevity. There has also been limited attention to understanding how these genetic effects are stratified by sex or across different socioeconomic and historical contexts.
In a previous GWAS of AFS (n=125,667)10 and AFB (n=343,072),8 we identified 38 and 10 novel independently-associated single-nucleotide polymorphisms (SNPs), respectively. The current study comprises a markedly expanded sample size for AFS (N=387,338) and AFB (N=542,901), uncovering 370 independent autosomal or X chromosomal loci, some of which are sex-specific, with 99 candidate genes expressed at the protein level in the brain, glands and reproductive organs. With methods and main findings summarized in Fig 1, this study reveals underlying genetic drivers, common genetic liabilities, heterogeneity by childhood socioeconomic status and historical period and further evidence of the relationship of later reproductive onset with fewer later-life metabolic life diseases and increased longevity.


Summary and description of methods and main results, onset of timing of human reproductive behaviour GWAS
Results
Phenotypic changes in human reproductive behaviour and heritability over time
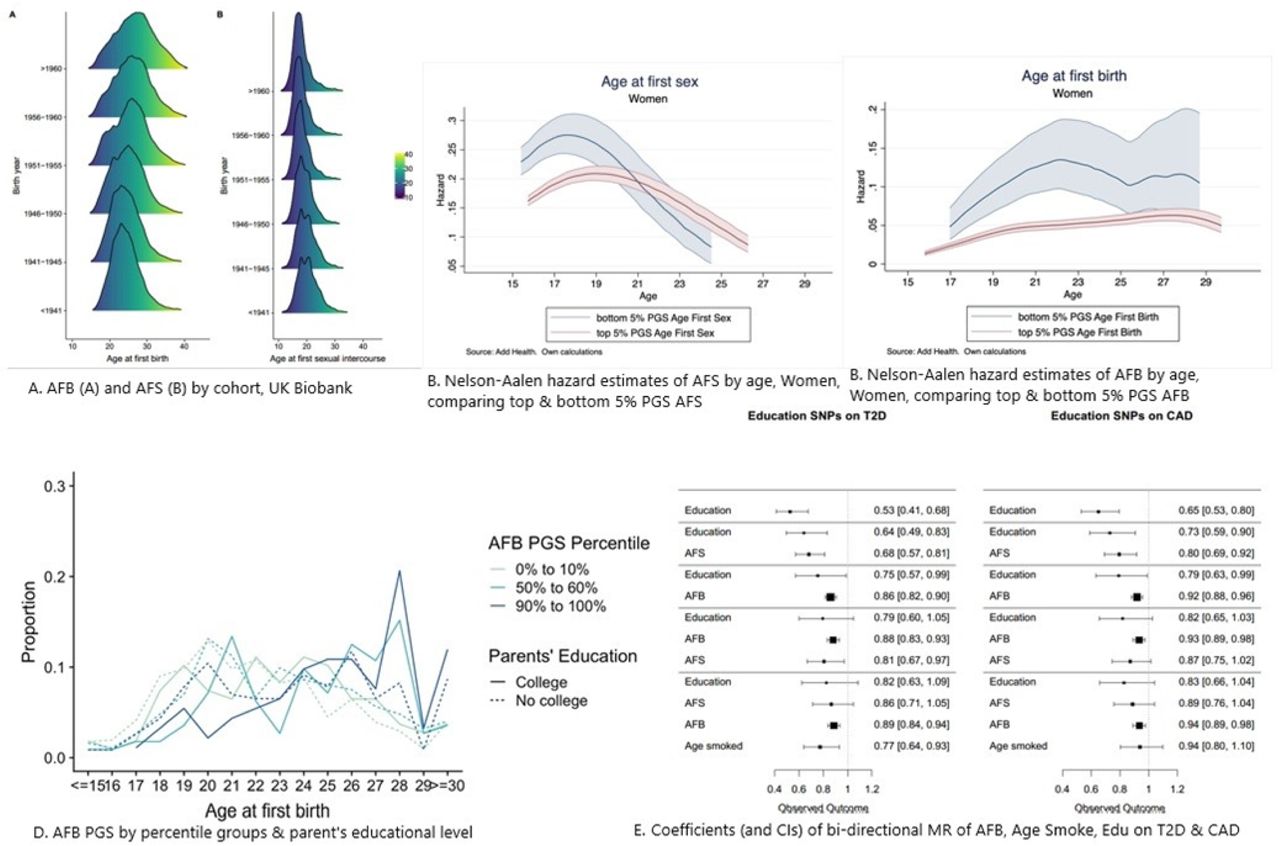
Descriptive analyses using the UK Biobank (see Online Methods) illustrate shifts in mean AFS and AFB, changes in the shape of the distribution by birth cohort, and a bi-modal distribution of AFS in earlier cohorts (Fig 2A, Supp Note Fig S1). Whereas AFB was often in the early 20s for older birth cohorts, this distribution has spread and shifted to older ages over time, with a marked drop in Pearson’s correlation between AFS and AFB from those born <1941 (0.60) to those born >1960 (0.31) (Supp Note Fig S2). Using GREML,11, 12 we found a steady increase in SNP-heritability by birth cohort for AFB for women from just under 10% for those born in 1940, climbing to around 23% for the latest cohorts born in 1965. For AFS, heritability ranges between 13 and 23% with a trend for women similar to AFB and a U-shaped trend for men (Supp Note Fig 4A-B).

Age at first sex (AFS) and age at first birth (AFB) changes over time, polygenic score (PGS) prediction and bi-directional MR

Gene prioritization of age at first sex (AFS) and age at first birth (AFB)
Meta-analysis GWAS Human Reproductive Behaviour
We conducted a meta-analysis of GWAS results from 36 cohorts for AFS and AFB in individuals of European ancestry. We imputed to the 1000 Genomes Project reference panel in a pooled sample and then stratified the analysis by sex (Supp Note Tables S1-8). In total, we discovered 370 associated loci. The GWAS of AFS identified 281 (271 pooled of which 4 on the X chromosome; 2 women; 8 men) independent SNPs at genome-wide significance (p<5 × 10⁻⁸, Fig S5; Table S10). The GWAS of AFB identified 89 (84 pooled of which 4 on the X chromosome; 1 women) independent SNPs at genome-wide significance (p<5 × 10⁻⁸, Fig S6; Table S9). The distribution of genome-wide test statistics for AFS and AFB showed significant inflation (λGC = 1.84 and 1.47, respectively), however LD score regression showed that this could be attributed almost entirely to polygenicity rather than to population substructure (LD intercept AFS 1.07 (SE = 0.01); AFB 1.03 (SE = 0.01, Supp Note). The LD Score intercept test confirmed that only a very small percentage (5.5%) of the observed inflation in the mean Χ2 statistic was due to population stratification or other confounders, rather than to a polygenic signal.
Polygenic prediction
We then calculated polygenic scores (PGSs) using three different specifications (Supp Note, Sect 4). To validate the performance of the PGSs, we performed out-of-sample prediction in the AddHealth and UKHLS cohorts using ordinary least-squares (OLS) regression models and report the R2 as a measure of goodness-of-fit of the model (Supp Note 4; Fig S7). PGSs including all SNPs explain up to 5.8% of the variance for AFS and 4.8% for AFB. A 1 SD change in the AFS/AFB PGS is associated with a 7.3 and 6.3 month delay in AFS and AFB, respectively. We then ran survival models to account for right-censoring, which occurs when an individual does not experience the event of first sex or birth by the time of the interview.13 Using AddHealth data, we estimated nonparametric hazard functions and then compared individuals at the top and bottom 5% of the PGS (see Fig 2B, 2C women, Supp Note Fig S8-9 men). Those in the top 5% PGS for AFS (i.e., genetic predisposition for later AFS) are less likely to have their sexual debut before age 19. AFS PGSs appear more relevant in explaining women’s AFS in comparison to men. Those in the top 5% PGS for AFB (i.e., genetic predisposition for later AFB) postpone AFB across all ages until approximately age 27, with similar curves for both sexes.
Environmentally mediated childhood socioeconomic status
Disadvantaged socioeconomic status has been shown to be highly related to early sexual behaviour and teenage pregnancy.14 To explore the impact of environmentally mediated parental genetic effects on our PGSs, we examined PGS prediction across low (0-10%), medium (50-60%) and high (90-100%) PGS percentiles by parents’ education (college versus no college) as a proxy for childhood socioeconomic status (Supp Note Fig 10A-B). Indeed, those in the highest decile of the PGS (90-100%) for later AFB have a higher AFB, particularly past age 27, which is accentuated for those with highly educated parents (Fig 2D; Fig S10A). Likewise, being in the highest PGS decile for AFS is associated with later sexual intercourse, especially for those from highest socioeconomic childhood households (Supp Note Fig 10B).
Genetic correlations
To test the relationships of AFS and AFB with related phenotypes, we calculated genetic correlations using LD score regression15 (Fig 3, Supp Note Fig S11, S13, Tab S11). Given previous evidence,8 we examined 28 traits by sex from six relevant categories including: reproductive (e.g., age at menarche, miscarriage or stillbirth, number of sexual partners), behavioural (e.g., educational attainment, risk tolerance), psychiatric disorders (e.g., ADHD, schizophrenia), substance use (e.g., age of initiation of smoking, cannabis use), personality (e.g., openness to experience) and anthropometric (e.g., BMI, height). The strongest genetic correlations were observed for reproductive traits, followed by behavioural traits, particularly with AFB and educational attainment in women (0.74, ±0.01), compared to AFS (0.53, ±0.01). There was also a negative genetic correlation between adult risk tolerance and AFS/AFB (AFS ∼–0.40; AFB ∼–0.25); i.e., those less genetically prone to risk are more genetically predisposed to postpone reproductive behaviour. Amongst psychiatric traits, the strongest correlation was with ADHD (AFS females –0.58, ±0.03, males –0.61, ±0.03; AFB females –0.63, ±0.03; males – 0.68, ±0.09) and Major Depressive Disorder (MDD) (AFS females –0.37, ±0.03, males –0.32, ±0.03; AFB females, –0.42, ±0.03; AFB males, –0.33, ±0.08). Previous studies have linked MDD to the serotonin transporter gene locus.16 We also observed strong genetic correlations with age at onset of smoking (AFS ∼ 0.68, ±0.03; AFB ∼0.74, ±0.03), a trait that provides a unique window into adolescent substance use behaviour around the same time of early reproductive behaviour. Genetic factors influencing early smoking, early sexual debut and teenage pregnancy are thus – to some extent – shared. As shown in Fig 3, there are few sex differences in these correlations, with the exception of small variations in number of children, anorexia and openness to experience.

Genetic correlations of age at first birth (A) and age at first sex (B) with a selection of related traits.
GenomicSEM, Exploratory Factor Analysis and Bi-Directional Mendelian Randomization to explore aetiology and causality
To understand the relationships underlying these genetic correlations, we first used GenomicSEM.17 GenomicSEM uses structural equation modelling to decompose the genetic covariance matrix, calculated using multivariate LD score regression, of a set of traits. Parameters are estimated by minimizing the difference between the observed genetic covariance matrix and the covariance matrix derived from the model (Supp Note). We fit a series of genetic regression models in which AFB (or AFS) was regressed on both years of education and one other possible mediating trait, such as openness, cognitive performance, ADHD and age of initiation of smoking (Supp Note Tab S12A-L, Fig S12A-B). In other words, we wanted to test whether the strong genetic correlation of AFS/AFB with education was the result of another mediating trait such as personality, ADHD or substance use. We found that the genetic correlation of years of education with AFB and AFS was independent of factors like risk tolerance, substance use, and psychiatric disorders. This suggests that the genetic correlation between years of education and AFB is largely a product of direct coupling between these traits, rather than being both downstream of a common identified cause. The exception was age at initiation of smoking – as noted previously, a window into risky adolescent behaviour – which partially mediated the relationship of AFB and AFS with years of education.
Exploratory factor analysis (EFA) was then used to examine whether the genetic signal of the onset of reproductive behaviour originated from two genetically distinguishable subclusters of reproductive biology versus externalizing behaviour. Using a two-factor EFA model (Methods) to fit the genetic covariance matrix AFS and AFB with these two additional traits, we found that the entire model accounted for 47% of the overall variance, with 22% attributed to risk tolerance and 4% to age at menarche. In a more robust analysis we fit a Genomic SEM for AFB in women and regressed several genetic measures of reproductive biology (age at menarche, age at menopause) and a latent factor representing a common genetic tendency for externalizing behaviour (age at initiation of smoking, age first used oral contraception, ADHD) (Fig S14). These genetic factors predicted 88% of the variance, with the majority of variance significantly predicted by externalizing factors (0.90,±0.02), followed by age at menopause (0.20, ±0.04) and age at menarche (0.16,±0.03). We note that selection bias, induced by the fact that AFB can only be measured among individuals with at least one live birth, may have inflated this estimate.
Given the strong genetic correlations between the phenotypes discussed above, we used Mendelian Randomization (MR)-based analyses18 to explore causality and assess the direction of effect between AFB, AFS and years of education19 as well as risk taking (measured in adulthood)4 and age at smoking initiation20 (Supp Note Sect 8, Tab S13A). For the majority of pairs of phenotypes we found strong evidence of bi-directionality, which was also seen after applying Steiger fitting. The relationship between AFB and years in education appeared to be the explanatory factor that linked AFB to the two risk taking phenotypes. This was not the case, however, for AFS where the analysis suggests that age at initiation of smoking (and the environment and processes that lead to this) are upstream of the start of AFS. In that case the relationship was significant when assessed as age at smoking to AFS but not the other way round. Of note, associations were much stronger for age at initiation of smoking initiation than for risk-taking behaviour assessed in adulthood, suggesting that the timing of this behaviour is key.
A second set of MR analyses examined whether AFS and AFB PGSs have effects on type 2 diabetes (T2D)21 and coronary artery disease (CAD),22 independently of years of education (Fig 1E, Tab S13B, Fig S15). T2D and CAD were chosen since they are two common major diseases, with broadly defined behavioural risk factors. Findings show that the association with years of education and later life diseases are substantially attenuated by the effects of AFB. This concurs with a large body of research that has established a biological association with the timing of AFB and metabolic diseases including early AFB linked to high blood pressure,23 obesity24 and diabetes.25 Reproductive timing thus appears to capture a latent variable that detects these metabolic effects but also years of education and other behavioural traits and can therefore serve as a more powerful predictor of later life disease than years of education alone. This also suggests that many of the associations with diseases that have previously been ascribed to years of education, may result from a more broadly defined socio-behavioural trajectory.
Cox proportional hazard models of a polygenic score for AFB on longevity
The disposable soma theory of evolution hypothesizes that longevity demands investments in somatic maintenance – such as remaining in education – that in turn reduces resources available for reproduction. To test trade-offs between reproductive behaviour and senescence as argued in the ageing and longevity literature,26 we conducted additional analyses to test whether our AFB PGS was associated with (parental) longevity (Supp Note, Tab S14). We first estimated a baseline Cox proportional hazard model of our AFB PGS on parental longevity and then included the EA3 PGS and risk covariates followed by a final model including number of siblings as a proxy for parental fertility. We found that a genetically predicted 1 SD increase in AFB is associated with a 2-4% lower mortality, suggesting that there is likely a trade-off between reproduction and longevity.
Gene prioritization
To understand the biology represented by the variants associated with AFS and/or AFB, we performed a gene prioritization analysis that connected variants to genes and prioritized candidate genes based on likely involvement reproductive biology or psychiatric traits. To this end, we used predicted gene function,27 single-cell RNA sequencing data in mice,28, 29 literature mining,30 in silico sequencing,31 and Summary-data based Mendelian Randomization(SMR)32 using eQTL data from brain and blood.33 Integrating results across all approaches resulted in the prioritization of 386 unique genes; 314 genes in 159 loci for AFS and 106 genes in 42 loci for AFB (Supp Tab 15A-19C). Of these, 99 were expressed at the protein level in cell types of brain, glands, and/or (fe)male reproductive organs34 (Fig 4). Gene prioritization in sex-specific loci resulted in the prioritization of 11 genes for AFB in women, one gene for AFS in women and 23 genes for AFS in men. Of these, 12 genes at three loci were expressed at the protein level in relevant tissues (Supp Note, Fig S16).
Genes that play a role in follicle stimulating hormone (CGA 35), oocyte development (KLF1736), and implantation and placental growth (ESR1, SUMO137, ARNT,38 CAV1,39 E2F140) were prioritized for AFS in data from men and women combined, while FSHB41 and ESR1 were (also) prioritized for AFB. Other genes prioritized in loci identified in the pooled meta-analyses were expressed at the protein level in (developing) sperm – highlighting a role for spermatid differentiation (KLF1742) for AFS – as well as for sperm morphogenesis and binding between acrosome-reacted sperm and the zona pellucida (ZPBP43) for AFB. The meta-analysis in women only yielded genes related to endometriosis (CCR1)44 and spontaneous abortion (CXCR6) for AFB (Supp Note Fig S18).45 Taken together, these results suggest that intrinsic biological processes that influence fertility also influence the onset of sexual behaviour in men and women. Interestingly, NUP210L – prioritized for AFS and highly expressed in developing and mature sperm34 – is normally testis-specific, but was recently shown to be expressed in prefrontal cortex neurons of G allele carriers in rs114697636 (MAF 3%, D’ 0.90 with AFS lead SNP rs113142203), attributed to allele-specific activation through improved binding affinity for testis receptor 2.46 Methylation of, and variants near NUP210L have been associated with psychologic development disorders, intelligence, and mathematical ability,47 illustrating how a testis-specific gene can influence the brain in some individuals.
Several genes prioritized in AFS-associated loci in data from men and women combined have previously been implicated in risk seeking behaviour, sociability and anxiety (GTF2I,48 TOP2B,49 E2F150, NCAM1,51 NFASC,52 MEF2C53). In the sex-specific meta-analysis for AFS, a role for externalizing behaviour was supported through ERBB4 in women; and through SLC44A1 and NR1H3 in men. ERBB4 has previously been linked to fear, anxiety,54 schizophrenia,55 and polycystic ovary syndrome (PCOS);56 SLC44AI encodes a choline transporter that plays a key role in cerebral inhibition related to substance use and depressive disorders57; and NR1H3 has been implicated in major depressive disorder (MDD).58 These genes provide concrete examples of how an innate predisposition for externalizing behaviour can influence initiation of reproductive behaviour.
The gene prioritization results partly mirror and compliment the rigorous post-GWAS in silico association analyses we performed for loci identified for AFS and AFB. However, experimental validation is required before firm conclusions can be drawn about the involvement of, and mechanisms through which prioritized candidate genes influence AFS and AFB. More information on protein-protein interaction hubs, as well as on genes highlighted by literature mining30 are provided in the supplementary information.
Discussion
In this study, we presented the results of the largest GWAS to date of the onset of human reproductive behaviour in the form of age at first sex (AFS) (N=387,338) and age at first birth (AFB) (N=542,901). We identified 370 independent signals harbouring at least 386 prioritized candidate genes, using 1000G imputed genotype data and an X-Chromosome analysis, which allowed us to detect considerably more signals than ever before (Fig 5). In comparison, a recent GWAS for type 2 diabetes,59 for instance, detected 243 loci. Similar to previous work, we showed that the total SNP heritability accounted for 10-22% of phenotypic variance and varied by birth cohort.12, 60 The incremental R2 of our PGSs based on significantly associated loci is around 5-6%, similar what is observed for common demographic and social variables (e.g., years of education, age at marriage), which have been classically used to explain the timing of human reproductive behaviour. Comparatively, 5-6% is in the range observed for other complex traits, like BMI (5.8%)61 and schizophrenia (8.4%).62 The number of signals also opened up opportunities for functional follow-up analyses which suggested a role for spermatid differentiation and oocyte development. The analyses of the correlation and underlying aetiology of these traits revealed a common genetic basis of both AFS and AFB with externalizing behaviour and substance use and links to internalizing traits and infertility. Finally, we showed that AFB is an important predictor for late age at onset of disease and longevity, and that it substantially attenuates the effect of years in education.

Summary genome-wide association study of timing of onset of reproductive behaviour: age at first sex (AFS) and age at first birth (AFB)
Although we opened many new avenues for research, the present GWAS still faces certain limitations. First, the sample sizes for men were still appreciably smaller than for women since reproductive and fertility data is routinely collected less often from men. In order to understand the causes of infertility in men this needs to be taken into consideration in future data collection. Initial within-family analyses showed that our discovery GWAS may actually overestimate causal effects (Supp Note), genotypes associated with later onset of reproductive behaviour genotypes are also associated with parental reproductive genotypes, likely leading to a social environment that affects reproductive and other behaviours. Collection and analysis of family data is clearly a future area of research for reproductive and related behaviour. The lack of accessibility of publically available summary statistics from published research, meant that we were unable to examine the relationship with other traits, particularly with infertility related traits (e.g., PCOS). Future data collection could benefit from focussing on behavioural disinhibition markers that appear to be highly related to self-control, which has implications for disease prevention and behavioural interventions into lifestyle factors related to obesity, Type 2 diabetes or substance use disorders. A glaring limitation is our focus on European-ancestry individuals in Western countries. Whilst common in this area of research,63 extension to other ancestries and geographical contexts is required in the future. This is particularly relevant in the context of parent gene-environment interactions, which may be specific to the social background of the sample.
Our detailed correlation, GenomicSEM and MR analyses also provided a deeper understanding of the underlying aetiology of related traits and pleiotropy and the associations between human reproductive behaviour and disease risk. We anticipate that our results will provide leads to address important interventions in infertility, teenage sexual and mental health, as well as for functional follow-up experiments that will likely yield targets that can be translated in efficient medication to improve fertility (e.g., in IVF) but also for interventions on reproductive health related to earlier sexual debut and teenage pregnancy.
Author Contributions
A full list of all authors, including the Human Reproductive Behaviour Consortium, eQTLGen and BIOS Consortium can be founded in the Supplementary Note 12.1. MCM and FRD designed and led the study. MCM wrote the paper and supplementary note with contributions by authors for respective analyses and comments by all authors. DMB conducted phenotypic changes, phenotype preparation, LD Score and genetic correlations, Genomic SEM and exploratory factor analysis and sex-specific effects. NB conducted GWAS meta-analysis, MTAG, PGS prediction, survival models, and Cox models of longevity. FCT and FRD conducted the cohort QC. FCT conducted GREML cohort heritability analysis and phenotype preparation in UKBB. FRD ran Mendelian Randomization, conducted GWAS analyses and JRBP conducted COJO and X-Chromosome analysis. NvZ conducted DEPICT and Phenolyzer analyses. AV and HS conducted in silico sequencing and SMR analyses. TP conducted cell type enrichment analyses. MdH integrated gene prioritization results and performed downstream analyses, e.g. Human Protein Atlas; Entrez, GeneCards and Uniprot mining; and STRING Protein-Protein interaction analyses. Authors in the Human Reproductive Behaviour Consortium provided data and cohort analyses. The eQTLGen and BIOS Consortiums provided data for additional analyses. All authors reviewed and approved the final version of the paper.
Competing interests
The main authors declare no competing interests. The views expressed in this article are those of the author(s) and not necessarily those of the NHS, the NIHR, or the Department of Health. MMcC (Mark McCarthy) has served on advisory panels for Pfizer, NovoNordisk and Zoe Global, has received honoraria from Merck, Pfizer, Novo Nordisk and Eli Lilly, and research funding from Abbvie, Astra Zeneca, Boehringer Ingelheim, Eli Lilly, Janssen, Merck, NovoNordisk, Pfizer, Roche, Sanofi Aventis, Servier, and Takeda. As of June 2019, MMcC is an employee of Genentech, and a holder of Roche stock.
Additional Information
This work was conducted under UK Biobank application 11425, 12514, 22276 and 9797.
Data and materials availability
Upon publication, GWAS summary statistics are available at the GWAS Catalog (www.ebi.ac.uk/gwas/downloads/summary-statistics). Access to individual level data from multiple sources used in this GWAS can be obtained by bona fide scientists through application to the specific data providers. The analysis plan was pre-deposited in the Open Science Framework website: https://osf.io/b4r4b/
Supplementary information is available at: https://doi.org/xxxxxx
Reprints and permissions information is available at: xxxx
Correspondence and requests for material
should be addressed to M.C.M. and F.R.D.
Human Reproductive Behaviour Consortium - Author information
Evelina T. Akimova1, Sven Bergmann2,3,4, Jason D. Boardman5, Dorret I. Boomsma6, Marco Brumat7, Julie E. Buring8,9, David Cesarini10,11,12, Daniel I. Chasman8,9, Jorge E. Chavarro13,14,15, Massimiliano Cocca16, Maria Pina Concas16, George Davey-Smith17, Gail Davies18, Ian J. Deary18, Tõnu Esko19,20, Oscar Franco21, Audrey J. Gaskins14,15,22, Eco J.C. de Geus6, Christian Gieger23, Giorgia Girotto7,16, Hans Jörgen Grabe24, Erica P. Gunderson25, Kathleen Mullan Harris26, Fernando P. Hartwig17,27, Chunyan He28,29, Diana van Heemst30, W. David Hill18, Georg Homuth31, Bernando Lessa Horta27, Jouke Jan Hottenga6, Hongyang Huang13, Elina Hyppönen32,33, M. Arfan Ikram21, Rick Jansen34, Magnus Johannesson35, Zoha Kamali36, Maryam Kavousi21, Peter Kraft13,37, Brigitte Kühnel23, Claudia Langenberg38, Lifelines Cohort Study39,40, Penelope A. Lind41, Jian’an Luan38, Reedik Mägi19, Patrik K.E. Magnusson42, Anubha Mahajan43,44, Nicholas G. Martin45, Hamdi Mbarek6,46, Mark I. McCarthy43,44, George McMahon47, Matthew B. McQueen48, Sarah E. Medland41, Thomas Meitinger49, Andres Metspalu19,50, Evelin Mihailov19, Lili Milani19, Stacey A. Missmer13,51,52, Stine Møllegaard53, Dennis O. Mook-Kanamori54,55, Anna Morgan16, Peter J. van der Most39, Renée de Mutsert54, Matthias Nauck56, Ilja M. Nolte39, Raymond Noordam30, Brenda W.J.H. Penninx57, Annette Peters58, Chris Power59, Paul Redmond18, Janet W. Rich-Edwards13,15,60, Paul M. Ridker8,9, Cornelius A. Rietveld61,62, Susan M. Ring17, Lynda M. Rose8, Rico Rueedi2,3, Kári Stefánsson63, Doris Stöckl58, Konstantin Strauch64,65,66, Morris A. Swertz40, Alexander Teumer67, Gudmar Thorleifsson63, Unnur Thorsteinsdottir63, A. Roy Thurik61,62,68, Nicholas J. Timpson17, Constance Turman13, André G. Uitterlinden61,69, Melanie Waldenberger23,58, Nicholas J. Wareham38, Gonneke Willemsen6, and Jing Hau Zhao38
Author list ordered alphabetically.
1 Leverhulme Centre for Demographic Science, Department of Sociology, St. Antony’s College, University of Oxford, Oxford, United Kingdom
2 Department of Computational Biology, University of Lausanne, Lausanne, Switzerland
3 Swiss Institute of Bioinformatics, Lausanne, Switzerland
4 Department of Integrative Biomedical Sciences, University of Cape Town, Cape Town, South Africa
5 Department of Sociology and Institute of Behavioral Science, University of Colorado at Boulder, Boulder, CO, United States of America
6 Department of Biological Psychology, Amsterdam Public Health Research Institute, Vrije Universiteit Amsterdam, Amsterdam, The Netherlands
7 Department of Medical, Surgical and Health Sciences, University of Trieste, Trieste, Italy
8 Brigham and Women’s Hospital, Boston, MA, United States of America
9 Harvard Medical School, Boston, MA, United States of America
10 Department of Economics, New York University, New York, NY, United States of America
11 Research Institute for Industrial Economics, Stockholm, Sweden
12 National Bureau of Economic Research, Cambridge, MA, United States of America
13 Department of Epidemiology, Harvard T.H. Chan School of Public Health, Boston, MA, United States of America
14 Department of Nutrition, Harvard T.H. Chan School of Public Health, Boston, MA, United States of America
15 Channing Division of Network Medicine, Brigham and Women’s Hospital and Harvard Medical School, Boston, MA, United States of America
16 Institute for Maternal and Child Health IRCCS “Burlo Garofolo”, Trieste, Italy
17 MRC Integrative Epidemiology Unit, University of Bristol, Bristol, United Kingdom
18 Lothian Birth Cohorts, Department of Psychology, University of Edinburgh, Edinburgh, United Kingdom
19 Estonian Genome Center, University of Tartu, Tartu, Estonia
20 Broad Institute of the Massachusetts Institute of Technology and Harvard University, Cambridge, MA, United States of America
21 Department of Epidemiology, Erasmus Medical Center, Rotterdam, The Netherlands
22 Department of Epidemiology, Rollins School of Public Health, Emory University, Atlanta, GA, United States of America
23 Research Unit of Molecular Epidemiology, Helmholtz Zentrum München, German Research Center for Environmental Health, Neuherberg, Germany
24 Department of Psychiatry and Psychotherapy, University Medicine Greifswald, Greifswald, Germany
25 Division of Research, Kaiser Permanente Northern California, Oakland, CA, United States of America
26 Department of Sociology, Carolina Population Center, University of North Carolina at Chapel Hill, Chapel Hill, NC, United States of America
27 Postgraduate Program in Epidemiology, Federal University of Pelotas, Pelotas, Brazil
28 University of Kentucky Markey Cancer Center, Lexington, KY, United States of America
29 Department of Internal Medicine, Division of Medical Oncology, University of Kentucky College of Medicine, Lexington, KY, United States of America
30 Department of Internal Medicine, Section of Gerontology and Geriatrics, Leiden University Medical Center, Leiden, The Netherlands
31 Interfaculty Institute for Genetics and Functional Genomics, University of Greifswald, Greifswald, Germany
32 Australian Centre for Precision Health, University of South Australia Cancer Research Institute, Adelaide, Australia
33 South Australian Health and Medical Research Institute, Adelaide, Australia
34 Department of Psychiatry, Amsterdam Public Health and Amsterdam Neuroscience, Amsterdam UMC, Vrije Universiteit, Amsterdam, The Netherlands
35 Department of Economics, Stockholm School of Economics, Stockholm, Sweden
36 Department of Bioinformatics, Isfahan University of Medical Sciences, Isfahan, Iran
37 Department of Biostatistics, Harvard T.H. Chan School of Public Health, Boston, MA, United States of America
38 MRC Epidemiology Unit, Institute of Metabolic Science, Cambridge Biomedical Campus, University of Cambridge School of Clinical Medicine, Cambridge, United Kingdom
39 Department of Epidemiology, University of Groningen, University Medical Center Groningen, Groningen, The Netherlands
40 Department of Genetics, University of Groningen, University Medical Center Groningen, Groningen, The Netherlands
41 Psychiatric Genetics, QIMR Berghofer Medical Research Institute, Herston Brisbane, Queensland, Australia
42 Department of Medical Epidemiology and Biostatistics, Karolinska Institutet, Stockholm, Sweden
43 Wellcome Centre for Human Genetics, University of Oxford, Oxford, United Kingdom
44 Oxford Centre for Diabetes, Endocrinology and Metabolism, Radcliffe Department of Medicine, University of Oxford, Oxford, United Kingdom
45 Genetic Epidemiology, QIMR Berghofer Medical Research Institute, Herston Brisbane, Queensland, Australia
46 Qatar Genome Programme, Qatar Foundation, Doha, Qatar
47 School of Social and Community Medicine University of Bristol, Bristol, United Kingdom
48 Department of Integrative Physiology, University of Colorado at Boulder, Boulder, CO, United States of America
49 Institute of Human Genetics, Helmholtz Zentrum München, German Research Center for Environmental Health, Neuherberg, Germany
50 Institute of Molecular and Cell Biology, University of Tartu, Tartu, Estonia
51 Division of Adolescent and Young Adult Medicine, Department of Medicine, Boston Children’s Hospital and Harvard Medical School, Boston, MA, United States of America
52 Department of Obstetrics, Gynecology, and Reproductive Biology, College of Human Medicine, Michigan State University, Grand Rapids, MI, United States of America
53 Department of Sociology, University of Copenhagen, Copenhagen, Denmark
54 Department of Clinical Epidemiology, Leiden University Medical Center, Leiden, The Netherlands
55 Department of Public Health and Primary Care, Leiden University Medical Center, Leiden, The Netherlands
56 Institute of Clinical Chemistry and Laboratory Medicine, University Medicine Greifswald, Greifswald, Germany
57 Department of Psychiatry, EMGO Institute for Health and Care Research and Neuroscience Campus Amsterdam, VU University Medical Center/GGZ inGeest, Amsterdam, The Netherlands
58 Institute of Epidemiology, Helmholtz Zentrum München, German Research Center for Environmental Health, Neuherberg, Germany
59 Population, Policy and Practice Research and Teaching Department, UCL Great Ormond Street Institute of Child Health, London, United Kingdom
60 Division of Women’s Health, Department of Medicine, Brigham and Women’s Hospital and Harvard Medical School, Boston, MA, United States of America
61 Erasmus University Rotterdam Institute for Behavior and Biology, Rotterdam, The Netherlands
62 Department of Applied Economics, Erasmus School of Economics, Rotterdam, The Netherlands
63 deCODE Genetics/Amgen Inc., Reykjavik, Iceland
64 Institute of Medical Biostatistics, Epidemiology and Informatics (IMBEI), University Medical Center, Johannes Gutenberg University, Mainz, Germany
65 Institute of Genetic Epidemiology, Helmholtz Zentrum München, German Research Center for Environmental Health, Neuherberg, Germany
66 Chair of Genetic Epidemiology, IBE, Faculty of Medicine, LMU Munich, Germany
67 Institute for Community Medicine, University Medicine Greifswald, Greifswald, Germany
68 Montpellier Business School, Montpellier, France
69 Department of Internal Medicine, Erasmus University Medical Center, Rotterdam, The Netherlands
eQTLGen Consortium – Author information
Mawussé Agbessi1, Habibul Ahsan2, Isabel Alves1, Anand Kumar Andiappan3, Wibowo Arindrarto4, Philip Awadalla1, Alexis Battle5,6, Frank Beutner7, Marc Jan Bonder8,9, Dorret I. Boomsma10, Mark W. Christiansen11, Annique Claringbould8,12, Patrick Deelen8,13,12,14, Tõnu Esko15, Marie-Julie Favé1, Lude Franke8,12, Timothy Frayling16, Sina A. Gharib11,17, Greg Gibson18, Bastiaan T. Heijmans4, Gibran Hemani19, Rick Jansen20, Mika Kähönen21, Anette Kalnapenkis15, Silva Kasela15, Johannes Kettunen22, Yungil Kim23,5, Holger Kirsten24, Peter Kovacs25, Knut Krohn26, Jaanika Kronberg15, Viktorija Kukushkina15, Zoltan Kutalik27, Bernett Lee3, Terho Lehtimäki28, Markus Loeffler24, Urko M. Marigorta18,29,30, Hailang Mei31, Lili Milani15, Grant W. Montgomery32, Martina Müller-Nurasyid33,34,35, Matthias Nauck36,37, Michel G. Nivard38, Brenda Penninx20, Markus Perola39, Natalia Pervjakova15, Brandon L. Pierce2, Joseph Powell40, Holger Prokisch41,42, Bruce M. Psaty11,43, Olli T. Raitakari44, Samuli Ripatti45, Olaf Rotzschke3, Sina Rüeger27, Ashis Saha5, Markus Scholz24, Katharina Schramm46,34, Ilkka Seppälä28, Eline P. Slagboom4, Coen D.A. Stehouwer47, Michael Stumvoll48, Patrick Sullivan49, Peter A.C. ‘t Hoen50, Alexander Teumer51, Joachim Thiery52, Lin Tong2, Anke Tönjes48, Jenny van Dongen10, Maarten van Iterson4, Joyce van Meurs53, Jan H. Veldink54, Joost Verlouw53, Peter M. Visscher32, Uwe Völker55, Urmo Võsa8,15, Harm-Jan Westra8,12, Cisca Wijmenga8, Hanieh Yaghootkar16,56,57, Jian Yang32,58, Biao Zeng18, Futao Zhang32
Author list ordered alphabetically.
Computational Biology, Ontario Institute for Cancer Research, Toronto, Canada
Department of Public Health Sciences, University of Chicago, Chicago, United States of America
Singapore Immunology Network, Agency for Science, Technology and Research, Singapore, Singapore
Leiden University Medical Center, Leiden, The Netherlands
Department of Computer Science, Johns Hopkins University, Baltimore, United States of America
Departments of Biomedical Engineering, Johns Hopkins University, Baltimore, United States of America
Heart Center Leipzig, Universität Leipzig, Leipzig, Germany
Department of Genetics, University Medical Centre Groningen, Groningen, The Netherlands
European Molecular Biology Laboratory, Genome Biology Unit, 69117 Heidelberg, Germany
Netherlands Twin Register, Department of Biological Psychology, Vrije Universiteit Amsterdam, Amsterdam Public Health research institute and Amsterdam Neuroscience, the Netherlands
Cardiovascular Health Research Unit, University of Washington, Seattle, United States of America
Oncode Institute
Genomics Coordination Center, University Medical Centre Groningen, Groningen, The Netherlands
Department of Genetics, University Medical Centre Utrecht, P.O. Box 85500, 3508 GA, Utrecht, The Netherlands
Estonian Genome Center, Institute of Genomics, University of Tartu, Tartu 51010, Estonia
Genetics of Complex Traits, University of Exeter Medical School, Royal Devon & Exeter Hospital, Exeter, United Kingdom
Department of Medicine, University of Washington, Seattle, United States of America
School of Biological Sciences, Georgia Tech, Atlanta, United States of America
MRC Integrative Epidemiology Unit, University of Bristol, Bristol, United Kingdom
Amsterdam UMC, Vrije Universiteit, Department of Psychiatry, Amsterdam Public Health research institute and Amsterdam Neuroscience, The Netherlands
Department of Clinical Physiology, Tampere University Hospital and Faculty of Medicine and Health Technology, Tampere University, Tampere, Finland
University of Helsinki, Helsinki, Finland
Genetics and Genomic Science Department, Icahn School of Medicine at Mount Sinai, New York, United States of America
Institut für Medizinische InformatiK, Statistik und Epidemiologie, LIFE – Leipzig Research Center for Civilization Diseases, Universität Leipzig, Leipzig, Germany
IFB Adiposity Diseases, Universität Leipzig, Leipzig, Germany
Interdisciplinary Center for Clinical Research, Faculty of Medicine, Universität Leipzig, Leipzig, Germany
Lausanne University Hospital, Lausanne, Switzerland
Department of Clinical Chemistry, Fimlab Laboratories and Finnish Cardiovascular Research Center-Tampere, Faculty of Medicine and Health Technology, Tampere University, Tampere, Finland
Integrative Genomics Lab, CIC bioGUNE, Bizkaia Science and Technology Park, Derio, Bizkaia, Basque Country, Spain
IKERBASQUE, Basque Foundation for Science, Bilbao, Spain
Department of Medical Statistics and Bioinformatics, Leiden University Medical Center, Leiden, The Netherlands
Institute for Molecular Bioscience, University of Queensland, Brisbane, Australia
Institute of Genetic Epidemiology, Helmholtz Zentrum München - German Research Center for Environmental Health, Neuherberg, Germany
Department of Medicine I, University Hospital Munich, Ludwig Maximilian’s University, München, Germany
DZHK (German Centre for Cardiovascular Research), partner site Munich Heart Alliance, Munich, Germany
Institute of Clinical Chemistry and Laboratory Medicine, Greifswald University Hospital, Greifswald, Germany
German Center for Cardiovascular Research (partner site Greifswald), Greifswald, Germany
Department of Biological Psychology, Faculty of Behaviour and Movement Sciences, VU, Amsterdam, The Netherlands
National Institute for Health and Welfare, University of Helsinki, Helsinki, Finland
Garvan Institute of Medical Research, Garvan-Weizmann Centre for Cellular Genomics, Sydney, Australia
Institute of Human Genetics, Helmholtz Zentrum München, Neuherberg, Germany
Institute of Human Genetics, Technical University Munich, Munich, Germany
Kaiser Permanente Washington Health Research Institute, Seattle, WA, United States of America
Centre for Population Health Research, Department of Clinical Physiology and Nuclear Medicine, Turku University Hospital and University of Turku, Turku, Finland
Statistical and Translational Genetics, University of Helsinki, Helsinki, Finland
Institute of Genetic Epidemiology, Helmholtz Zentrum München - German Research Center for Environmental Health, Neuherberg, Germany
Department of Internal Medicine and School for Cardiovascular Diseases (CARIM), Maastricht University Medical Center, Maastricht, The Netherlands
Department of Medicine, Universität Leipzig, Leipzig, Germany
Department of Medical Epidemiology and Biostatistics, Karolinska Institutet, Stockholm, Sweden
Center for Molecular and Biomolecular Informatics, Radboud Institute for Molecular Life Sciences, Radboud University Medical Center Nijmegen, Nijmegen, The Netherlands
Institute of Clinical Chemistry and Laboratory Medicine, University Medicine Greifswald, Greifswald, Germany
Institute for Laboratory Medicine, LIFE – Leipzig Research Center for Civilization Diseases, Universität Leipzig, Leipzig, Germany
Department of Internal Medicine, Erasmus Medical Centre, Rotterdam, The Netherlands
UMC Utrecht Brain Center, University Medical Center Utrecht, Department of Neurology, Utrecht University, Utrecht, The Netherlands
Interfaculty Institute for Genetics and Functional Genomics, University Medicine Greifswald, Greifswald, Germany
School of Life Sciences, College of Liberal Arts and Science, University of Westminster, 115 New Cavendish Street, London, United Kingdom
Division of Medical Sciences, Department of Health Sciences, Luleå University of Technology, Luleå, Sweden
Institute for Advanced Research, Wenzhou Medical University, Wenzhou, Zhejiang 325027, China
BIOS Consortium (Biobank-based Integrative Omics Study) – Author information
Management Team Bastiaan T. Heijmans (chair)1, Peter A.C. ’t Hoen2, Joyce van Meurs3, Aaron Isaacs4, Rick Jansen5, Lude Franke6.
Cohort collection Dorret I. Boomsma7, René Pool7, Jenny van Dongen7, Jouke J. Hottenga7 (Netherlands Twin Register); Marleen MJ van Greevenbroek8, Coen D.A. Stehouwer8, Carla J.H. van der Kallen8, Casper G. Schalkwijk8 (Cohort study on Diabetes and Atherosclerosis Maastricht); Cisca Wijmenga6, Lude Franke6, Sasha Zhernakova6, Ettje F. Tigchelaar6 (LifeLines Deep); P. Eline Slagboom1, Marian Beekman1, Joris Deelen1, Diana van Heemst9 (Leiden Longevity Study); Jan H. Veldink10, Leonard H. van den Berg10 (Prospective ALS Study Netherlands); Cornelia M. van Duijn4, Bert A. Hofman11, Aaron Isaacs4, André G. Uitterlinden3 (Rotterdam Study).
Data Generation Joyce van Meurs (Chair)3, P. Mila Jhamai3, Michael Verbiest3, H. Eka D. Suchiman1, Marijn Verkerk3, Ruud van der Breggen1, Jeroen van Rooij3, Nico Lakenberg1.
Data management and computational infrastructure Hailiang Mei (Chair)12, Maarten van Iterson1, Michiel van Galen2, Jan Bot13, Dasha V. Zhernakova6, Rick Jansen5, Peter van ’t Hof12, Patrick Deelen6, Irene Nooren13, Peter A.C. ’t Hoen2, Bastiaan T. Heijmans1, Matthijs Moed1.
Data Analysis Group Lude Franke (Co-Chair)6, Martijn Vermaat2, Dasha V. Zhernakova6, René Luijk1, Marc Jan Bonder6, Maarten van Iterson1, Patrick Deelen6, Freerk van Dijk14, Michiel van Galen2, Wibowo Arindrarto12, Szymon M. Kielbasa15, Morris A. Swertz14, Erik. W van Zwet15, Rick Jansen5, Peter-Bram ’t Hoen (Co-Chair)2, Bastiaan T. Heijmans (Co-Chair)1.
Molecular Epidemiology Section, Department of Medical Statistics and Bioinformatics, Leiden University Medical Center, Leiden, The Netherlands
Department of Human Genetics, Leiden University Medical Center, Leiden, The Netherlands
Department of Internal Medicine, ErasmusMC, Rotterdam, The Netherlands
Department of Genetic Epidemiology, ErasmusMC, Rotterdam, The Netherlands
Department of Psychiatry, VU University Medical Center, Neuroscience Campus Amsterdam, Amsterdam, The Netherlands
Department of Genetics, University of Groningen, University Medical Centre Groningen, Groningen, The Netherlands
Department of Biological Psychology, VU University Amsterdam, Neuroscience Campus Amsterdam, Amsterdam, The Netherlands
Department of Internal Medicine and School for Cardiovascular Diseases (CARIM), Maastricht University Medical Center, Maastricht, The Netherlands
Department of Gerontology and Geriatrics, Leiden University Medical Center, Leiden, The Netherlands
Department of Neurology, Brain Center Rudolf Magnus, University Medical Center Utrecht, Utrecht, The Netherlands
Department of Epidemiology, ErasmusMC, Rotterdam, The Netherlands
Sequence Analysis Support Core, Leiden University Medical Center, Leiden, The Netherlands
SURFsara, Amsterdam, The Netherlands
Genomics Coordination Center, University Medical Center Groningen, University of Groningen, Groningen, The Netherlands
Medical Statistics Section, Department of Medical Statistics and Bioinformatics, Leiden University Medical Center, Leiden, The Netherlands
Online Methods
This article has a Supplementary Note with more details.
Samples
For Age at First Sexual intercourse (AFS), we included 397,338 pooled individuals (n=182,791 males; n=214,547 females) from the UK Biobank. For Age at First Birth (AFB), we included 542,901 individuals (n=124,088 males; n=418,758 females) from 36 studies. We performed a GWAS separately restricted to European ancestry individuals that passed quality control. European ancestry was chosen in this discovery study due to the availability of samples1 and for no biological or substantive reason. We acknowledge that social science research has found large differences in the earlier initiation of AFS and AFB by lower socioeconomic status, which often coincides with societal inequality2,3 and the socially (not biologically) constructed categories of race and ethnicity. Socioeconomic differences are examined in this article, but results are only applicable to European Ancestry groups, with a need for further cross-ancestry discovery research.
The Human Reproductive Behaviour Consortium. This consortium is a collaboration studying the GWAS of human reproductive behaviour including age at first sex and birth, number of children ever born, childlessness and related traits. In some cases we used summary statistics from our first GWAS of AFB and NEB4 on discovery cohorts (see Supp Note Tables S1-S3b).
Phenotype measurements, genotyping, imputation and meta-analysis
AFS is treated as a continuous measure with individuals considered as eligible if they had given a valid answer and ages lower than 12 excluded (see Supp Note 1.2). Since AFS has a non-normal distribution, a within-sex inverse rank normal transformation is required. AFB is also treated as a continuous measure, assessed for those who have ever given birth to a child. Details about participating cohorts, sample inclusion criteria, genotyping and imputation, models used to test for association, X chromosome analysis, quality control filters and diagnostics, and meta-analysis are in the Supp Note. A sample-size weighted meta-analysis of quality-controlled cohort-level results was performed using the METAL software.5 We performed conditional and joint multiple SNP analyses (COJO) to identify further independent SNPs and sex-specific analyses.
Sex-specific genetic effects
We used LD score bivariate regression6 to estimate the genetic correlation between men and women based on the sex-specific summary statistics from the meta-analysis results. There was a large genetic overlap among the sexes for AFB (0.95) and a somewhat lower overlap for AFS (0.79), suggesting sex-specific effects would be important to examine. In order to determine if there was evidence for sex-specific effects, we compared the allelic effects for these SNPs between men and women and derived a p-value for heterogeneity.7 A multiple testing correction was applied (0.05/242=2 × 10−4) to identify sex-specific associations. We then selected a region of ±1Mb around these lead SNPs to identify the genes that may be represented by these lead SNPs, followed by gene prioritization as we did for the main AFB and AFS analyses.
X chromosome analysis
For AFS, the UK Biobank provided results for between 977,536 and 990,735 variants on the X chromosome after QC (see Table S8). For AFB, 13 cohorts provided information on the X chromosome. Overall, we received 23 files, 13 for women, 8 for men and 2 for the pooled analysis in case there were individuals who were relatives in the data. On average, 275,023 variants survived QC with a minimum of 99,794 in women from WLS to 998,304 for the women in the UK Biobank sample (see TableS7 for full descriptives). Association analyses on the X chromosome were performed using software suggested in the analysis plan (XWAS, SNPtest or BOLT-LMM) using BOLT-LMM for AFS as this was only assessed in the UK Biobank data, for AFB, METAL was used as described above (see sup. note 3.5)
Phenotypic and genotypic historical changes
Descriptive analyses and correlations were undertaken using the UK Biobank data to illustrate phenotypic shifts in the age of AFS and AFB by birth cohort, in addition to changes in the spread of the distribution. Pearson’s correlation coefficients were calculated and correlation graphs illustrate the changing relationship between the two phenotypes over time. Genotypic changes and SNP-heritability by birth cohort were quantified in UK Biobank data using GREML8 as described earlier.9
MTAG
MTAG results10 were calculated using GWA meta-analysis results of the following related phenotypes: AFS, AFB, number of children ever born, childlessness. Using summary statistics from the pooled GWAS of each of the traits, MTAG uses bivariate LD score regression to account for unobserved sample overlap.
Polygenic score prediction
We performed out-of-sample prediction in two cohorts, the National Longitudinal Study of Adolescence to Adult Health (Add Health),11 based in the US and the UK Household Longitudinal Study - Understanding Society (UKHLS).12 We calculated three sets of polygenic risk scores (PGS) with weights based on meta-analysis results excluding the specific cohort from the calculation. First, pruning and thresholding of all SNPs was performed (250kb window; r2=.1) using PRSice13. Second, LDpred PGSs14 with the LD reference were calculated from the same genotyped files, using prior distributions for the causal fraction of SNPs equal to 1 and LDpred weights calculated under the infinitesimal model. Third, MTAG + LDpred PGSs were calculated using the same methodology as in the second PGSs, but this time based on MTAG results10. For both traits, we ran ordinary least-squares (OLS) regression models and report the incremental r2 as a measure of goodness-of-fit of the model. Confidence intervals are based on 1,000 bootstrapped samples.
Testing population stratification, survival models and environmentally mediated parental genetic effects of childhood socioeconomic status
To test whether population stratification biased our results or lead to false positives, we used the LD Score intercept method.15 For each phenotype, we used the “eur_w_ld_chr” files of LD Scores.16 These LD Scores were computed with genotypes from the European-ancestry samples in the 1000 Genomes Project using only HapMap3 SNPs with MAF > 0.01. We then ran survival models to account for right-censoring, which occurs when an individual does not experience the event of first sex or birth by the time of the interview.17 Using Add Health data, we estimated nonparametric hazard functions based on Nelson-Aalen estimates and then compared individuals at the top and bottom 5% of the PGS and plotted the estimated hazards. To further explore the impact of environmentally mediated parental genetic effects on our PGSs, we examined PGS prediction across low (0-10%), medium (50-60%) and high (90-100%) PGS percentiles by parent’s education status (college versus no college), which serves as a proxy for childhood socioeconomic status.
Genetic correlations
Genetic correlation (rg) values were computed to estimate the genetic correlation between the two traits using all polygenic effects captured by the SNPs and LD-score regression.18 We used summary statistics and the 1000 Genomes reference set, and restricted the analysis to European populations. We also followed the common convention of restricting our analyses to SNPs with MAF >0.01, thus ensuring that all analyses were performed using a set of SNPs that were imputed with reasonable accuracy across all cohorts. The standard errors (SEs) were produced by the LDSC python software package that uses a block jackknife over the SNPs. We estimated the genetic correlation between 28 different traits, pooled by both sexes and then divided by sex. Traits were divided into the six categories of: reproductive, behavioural, psychiatric disorders, substance use disorders, personality and anthropometric.
Genomic SEM (structural equation modelling)
In an attempt to understand the aetiology of the correlations, we used the R package GenomicSEM to fit genetic multivariable regression models. GenomicSEM19 uses structural equation modelling to decompose the genetic covariance matrix, calculated using multivariate LD score regression, of a set of traits. Formally, structural equation models subsume many statistical methods and are quite flexible. We fit a series of genetic multivariable regression models, in which AFB was regressed on EA (educational attainment) and a trait X, in which we modelled various relevant traits such as openness, cognitive performance and AI (age initiation smoking). We also fit an analogous series of models in which AFS was regressed on EA.
Exploratory factor analysis (EFA) and Genomic SEM by reproductive biology and externalizing behaviour
EFA was used to examine whether the genetic signal of the onset of reproductive behaviour originated from two genetically distinguishable sub-clusters of a biological component and an externalizing behaviour component. This would suggest distinct causal mechanisms and subtypes of individuals. We tested this by fitting a two factor EFA model to the genetic covariance matrix of AFB, AFS, NEB, and the proxies age at menarche (biological component) and risk tolerance (externalizing behaviour). To test this further, we estimated a more robust and additional measures of reproductive biology and externalizing behaviour and a sex-specific analysis of AFB for women. We fit a genomic structural equation model (Genomic SEM) where AFB in women is regressed on age at menopause, age at menarche, and a latent factor representing the common genetic tendency to externalizing behaviour. The factor is measured by AFS in women, age at initiation of smoking, age first used oral contraception, and ADHD, with the model scaled to unit variance for the latent factor.
Bi-directional Mendelian Randomization
We then tested whether causal pathways linking these phenotypes are potentially bidirectional and whether our phenotypes might offer distinct contributions. We identified 1000 Genomes proxies for our SNPs and used these in multivariate Mendelian Randomisation (MR) models. First, we modelled the interplay between AFB, AFS and EA (educational attainment)20 as well as risk taking (measured in adulthood)21 and age at smoking initiation (AI).22 In each case IVW23 and MR-EGGER24 methods were performed, with an additional round of IVW performed once a Steiger filter25 had been applied to remove SNPs that appears to show a primary association with the outcome rather than the exposure. Multivariate MR was use to try to dissect causal pathways.26 A second set of MR analyses focused on links to late life diseases, namely type 2 diabetes (T2D)27 and coronary artery disease (CAD)28, using the same methods. In particular, we use multivariate methods to test whether AFS or AFB had independent effects once the well-established links to length of educational attainment were controlled for.
Cox proportional hazard models of AFB polygenic score on longevity
To test trade-offs between reproductive behaviour and senescence, we conducted additional analyses to test whether our PGS for AFB was predictive of (parental) longevity. We restricted our models to mortality after age 60 to limit the possibility that early mortality affects parental fertility (i.e., collider bias).29 We calculated PGSs for AFB, Educational attainment (EA)30 and risky behaviour21 from the UK Biobank adopting the following procedure. We first split the sample in 10 random groups. We then iteratively estimated genome-wide association results for 9/10th of the sample and used these association results as weights for the calculation of polygenic scores in the remaining 1/10th of the sample. Polygenic scores were calculated using PRSice on a set of independent genotyped SNPs. We then estimated three sets of Cox Proportional hazard models to estimate the effect of the PGS of AFB on maternal and paternal age at death. All models control for the first 10 Genetic Principal Components, sex and year of birth, and are stratified by Local Authority District at birth calculated using the geo-coordinates provided in the UK Biobank due to differences in mortality related to material deprivation.31 We first estimated a baseline model and then included PGSs for EA and risk as covariates, followed by a final model including number of sibling (proxy for parental fertility).
Gene prioritization
We prioritized candidate genes in pooled and sex-specific GWAS-identified loci using predicted gene functions,32 single-cell RNA sequencing data in mice,33,34 literature mining,35 in silico sequencing,36 and synthetic Mendelian Randomization37 using eQTL data from brain and blood.38,39
DEPICT, RNAseq data from mouse brain and Tabula muris RNAseq data
First, DEPICT was used to perform pathway analyses, identify enrichment for cell types and tissues, and prioritize candidate genes.32 DEPICT is agnostic to the outcomes analyzed in the GWAS and employs predicted gene functions. For both AFS and AFB, all SNPs with p<1×10⁻⁵ in the pooled GWAS meta-analysis were used as input. Based on the results of the tissue enrichment analysis, we used DEPICT to identify nervous system cell types that are enriched for expression of genes in loci reaching p<1×10⁻⁵ in the GWAS, using RNAseq data from mouse brain.33 A similar approach using tabula muris RNAseq data34 helped prioritize additional central nervous system and pancreatic cell types for AFS. For enriched cell types from mouse brain and tabula muris, the top-10 contributing genes were selected as candidate genes resulting in the prioritization of 296 genes for AFS and 95 for AFB based on mouse brain; and 97 genes for AFS based on tabula muris data.
Phenolyzer to integrate prior knowledge and phenotype information
We used Phenolyzer (v1.1) to prioritize candidate genes by integrating prior knowledge and phenotype information.40 Here we used the regions defined by DEPICT v1.1, reflecting loci reaching P<1×10⁻⁵ in first instance. Phenolyzer takes free text input and interprets these as disease names by using a word cloud to identify synonyms. It then queries precompiled databases for the disease names to find and score relevant seed genes. The seed genes are subsequently expanded to include related (predicted) genes based on several types of relationships, e.g., protein-protein interactions, transcriptional regulation and biological pathways. Phenolyzer uses machine-learning techniques on seed genes and predicted gene rankings to produce an integrated score for each gene. We used search terms capturing three broad areas, i.e., (in)fertility, congenital neurological disorders and psychological traits, based on results from pathway, tissue and cell type enrichment analyses.
In silico sequencing
We used in silico sequencing to identify non-synonymous variants with an r2 for LD>0.7 with the lead SNPs in AFS and AFB-associated loci,36 which yielded genes that may drive the GWAS associations through direct effects on protein function.
Summary data-based Mendelian Randomization (SMR) and Heterogeneity in Dependent Instruments (HEIDI).37
We conducted this using eQTL data from brain41 and whole blood.39 This approach provided a list of genes that showed Bonferroni corrected significant evidence (thresholds for blood <3.2×10⁻⁶ brain <6.7×10⁻⁶) of mediating the association between our phenotypes and GWAS-identified loci based on results from brain and blood.
Integration of findings across all functional approaches
We integrated findings across all approaches and retained genes in loci that reached genome-wide significance, and that were located within 1M bp of a GWAS lead SNP. We next used data from the Human Protein Atlas42 to identify genes amongst 387 genes that are expressed at a low, medium or high protein level in brain, glands, and/or reproductive organs at a ‘supported’ or ‘enhanced’ degree of reliability. For the 97 genes that fulfilled these criteria, we mapped the brain, glandular and reproductive cell types in which they are highly expressed at the protein level;43 used a text-mining approach to extract functions from entries in Entrez, GeneCards and Uniprot; and identified phenotypes in mutant mice from the Mouse Genome Informatics (MGI) database44.
Ethics statement
All research was approved by the appropriate institutional review boards and participants of all studies provided informed consent to participate in those studies.
Data availability
Our policy is to make genome-wide summary statistics widely and publically available. Upon publication, summary statistics will be available on the GWAS Catalog website: https://www.ebi.ac.uk/gwas/downloads/summary-statistics
The phenotype and genotype data are available upon application from each of the participating cohorts and should be contacted directly regarding their different data access policies. Access to the UK Biobank is available through application with information available at: http://www.ukbiobank.ac.uk).
Acknowledgements
Acknowledgments and grant details can be found in the Supplementary Note Section 12.2.
References
References


