

Abstract
Neuroticism is an important risk factor for psychiatric traits including depression1, anxiety2,3, and schizophrenia4–6. Previous genome-wide association studies7–12 (GWAS) reported 16 genomic loci10–12. Here we report the largest neuroticism GWAS meta-analysis to date (N=449,484), and identify 136 independent genome-wide significant loci (124 novel), implicating 599 genes. Extensive functional follow-up analyses show enrichment in several brain regions and involvement of specific cell-types, including dopaminergic neuroblasts (P=3×10⁻⁸), medium spiny neurons (P=4×10⁻⁸) and serotonergic neurons (P=1×10⁻⁷). Gene-set analyses implicate three specific pathways: neurogenesis (P=4.4×10⁻⁹), behavioural response to cocaine processes (P=1.84×10⁻⁷), and axon part (P=5.26×10⁻⁸). We show that neuroticism’s genetic signal partly originates in two genetically distinguishable subclusters13 (depressed affect and worry, the former being genetically strongly related to depression, rg=0.84), suggesting distinct causal mechanisms for subtypes of individuals. These results vastly enhance our neurobiological understanding of neuroticism, and provide specific leads for functional follow-up experiments.
Neuroticism is an important risk factor for psychiatric traits including depression1, anxiety2,3, and schizophrenia4–6. Previous genome-wide association studies7–12 (GWAS) reported 16 genomic loci10–12. Here we report the largest neuroticism GWAS meta-analysis to date (N=449,484), and identify 136 independent genome-wide significant loci (124 novel), implicating 599 genes. Extensive functional follow-up analyses show enrichment in several brain regions and involvement of specific cell-types, including dopaminergic neuroblasts (P=3×10⁻⁸), medium spiny neurons (P=4×10⁻⁸) and serotonergic neurons (P=1×10⁻⁷). Gene-set analyses implicate three specific pathways: neurogenesis (P=4.4×10⁻⁹), behavioural response to cocaine processes (P=1.84×10⁻⁷), and axon part (P=5.26×10⁻⁸). We show that neuroticism’s genetic signal partly originates in two genetically distinguishable subclusters13 (depressed affect and worry, the former being genetically strongly related to depression, rg=0.84), suggesting distinct causal mechanisms for subtypes of individuals. These results vastly enhance our neurobiological understanding of neuroticism, and provide specific leads for functional follow-up experiments.
The neuroticism meta-analysis comprised data from the UK Biobank Study (UKB, full release14; N=372,903; Online Methods; Supplementary Fig. 1), 23andMe, Inc.15 (N=59,206), and the Genetics of Personality Consortium (GPC19; N=17,375; Online Methods, N=449,484 in total). In all samples, neuroticism was measured through (digital) questionnaires (Online Methods; Supplementary Information). SNP associations were meta-analyzed using METAL16, weighted by sample size (Online Methods). The quantile-quantile (Q-Q) plot of the genome-wide meta-analysis on 449,484 subjects and 14,978,477 SNPs showed high inflation (λ=1.65) and mean χ2 statistic (1.91) (Fig. 1a; Supplementary Table 1). The LD score regression (LDSC)17,18 intercept (1.02; SE=0.01) was consistent with inflation due to true polygenicity and large sample size. The LDSC SNP-based heritability (h2 SNP) of neuroticism was 0.100 (SE=0.003).

(a) Quantile-quantile plot of the SNP-based associations with neuroticism. (b) Manhattan plot showing the -log10 transformed P-value of each SNP on the y-axis and base pair positions along the chromosomes on the x-axis. The dashed line indicates genome-wide significance (P<5×10⁻⁸), the dotted line the threshold for suggestive associations (P<1×10⁻⁵). (c) Pie charts showing the distribution of functional consequences of SNPs in linkage disequilibrium (LD) with genome-wide significant lead SNPs in the meta-analysis, the minimum chromatin state across 127 tissue and cell types and the distribution of regulome DB score, a categorical score between 1a and 7, indicating biological evidence of a SNP being a regulatory element, with a low score denoting a higher likelihood of being regulatory. (d) Heritability enrichment of 22 functional SNP annotations calculated with stratified LD score regression.
CADD: CADD score; rdb: regulome DB score; MAF: minor allele frequency; Z-score: z-score from the GWAS meta-analysis in METAL. Results are reported on hg19 coordinates (NCBI b37). Genes containing multiple ExNS are annotated in red.
The GWAS meta-analysis identified 9,745 genome-wide significant (GWS) SNPs (P<5×10⁻⁸), of which 157 and 2,414 were located in known associated inversions on chromosomes 8 and 1710–12, respectively (Supplementary Table 2; Fig. 1b; Supplementary Fig. 2). FUMA19, a tool to functionally map and annotate GWAS results (Online Methods), extracted 170 independent lead SNPs (158 novel; see Supplementary information for definition of lead SNPs), which mapped to 136 independent genomic loci (124 novel; Online Methods; Supplementary information; Supplementary Table 3-8). Of all lead SNPs, 4 were in exonic, 88 in intronic, and 52 in intergenic regions. Of the 17,794 SNPs in high LD with one of the independent significant SNPs (see Supplementary information for definition of independent significant SNPs), most were intronic (9,147: 51,4%) or intergenic (5,460: 30,7%), and 3.8% was annotated as potentially having a functional impact, with 0.9% (155 SNPs) being exonic (Fig. 1c, Supplementary Table 9; see Supplementary Tables 10-11 for an overview of chromatin state and regulatory functions of these SNPs). Of these, 37 were exonic nonsynonymous (ExNS) (Table 1, Supplementary Table 12). The highest CADD score (34) of ExNS SNPs was for rs17651549, in exon 6 of MAPT, with a GWAS P-value of 1.11´10-28, in high LD with the lead SNP in that region (r2=0.97). rs17651549 is a missense mutation leading to an Arginine to Tryptophan change with allele frequencies matching the inversion in that region. The ancestral allele C is associated with a lower neuroticism score (see Table 1 and Supplementary Table 12 for a detailed overview of all functional variants in genomic risk loci).
Stratified LDSC20 (Online Methods), showed significant enrichment for h2 of SNPs located in conserved regions (enrichment=13.79, P=5.14×10⁻¹⁶), intronic regions (enrichment=1.27, P=1.27×10⁻⁶), and in H3K4me3 (enrichment=2.14, P=1.02×10⁻⁵) and H3K9ac regions (enrichment=2.17, P = 3.06×10⁻⁴) (Fig. 1d; Supplementary Table 13).
Polygenic scores (PGS) calculated using PRSice21 (clumping followed by P-value thresholding) and LDpred22 in three randomly drawn hold-out samples (UKB only, N=3,000 each; Online Methods), explained up to 4.2% (P=1.49×10⁻³⁰) of the variance in neuroticism (Supplementary Fig. 3; Supplementary Table 14).

Circos plot showing genes on (a) chromosome 6 and (b) chromosome 8 that were implicated by the genomic risk (blue areas) loci by chromatin interaction (CTI; orange), eQTL (green) or implicated by both eQTL and CTI mapping (red). The outer layer shows a Manhattan plot containing the -log10 transformed P-value of each SNP in the GWAS meta-analysis. Empty regions in the Manhattan plot layer indicate regions where no SNPs with P<0.05 are situated.
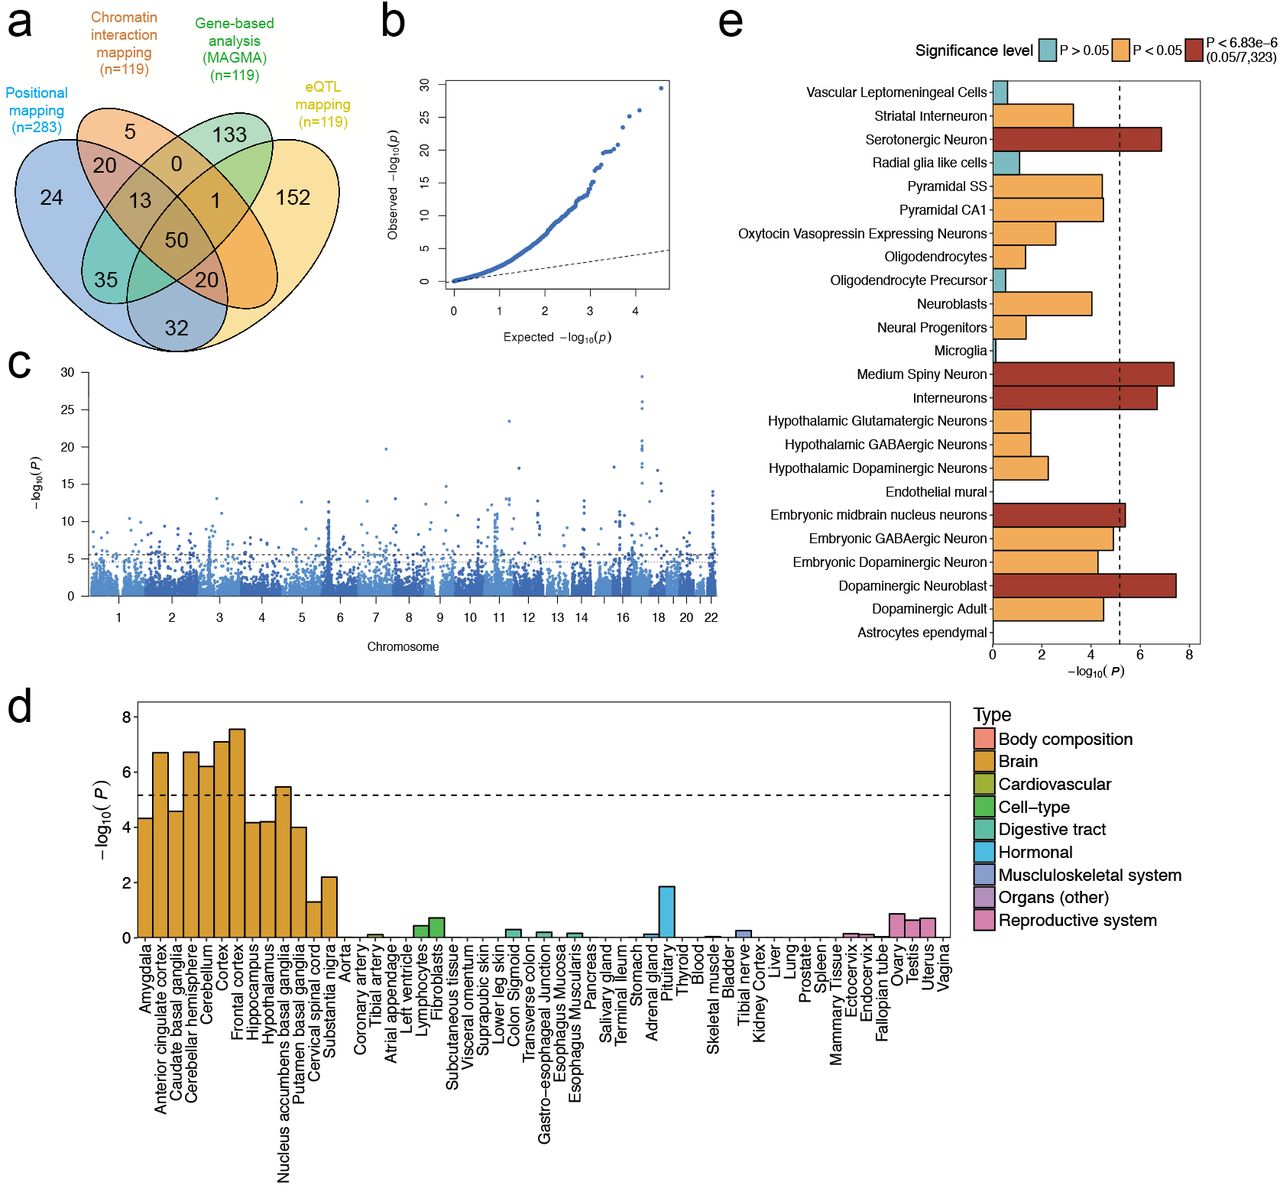
We used four strategies to link our SNP results to genes: positional, eQTL, and chromatin interaction mapping (Online Methods) and genome-wide gene-association analysis (GWGAS; MAGMA23). GWGAS evaluates the joint association effect of all SNPs within a gene yielding a gene-based P-value. Based on our meta-analytic results, 283 genes were implicated through positional mapping, 369 through eQTL-mapping, and 119 through chromatin interaction-mapping (Fig. 2a; Supplementary Table 15). GWGAS identified 336 GWS genes (P<2.75×10⁻⁶, Figs. 2b-c; Supplementary Table 16, Supplementary information), of which 203 overlapped with genes implicated by FUMA, resulting in 599 unique neuroticism-related genes. Of these, 50 were implicated by all four methods, of which 49 had chromatin interaction and eQTL associations in the same tissue/cell type (Fig. 2a, Supplementary Table 15).

a) Venn diagram showing overlap of genes implicated by positional mapping, eQTL mapping, chromatin interaction mapping, and gene-based genome-wide association (GWGAS). (b) Quantile-quantile plot of the GWGAS. (c) Manhattan plot of the genome-wide gene-based association analysis (GWGAS) on neuroticism. The y-axis shows the -log10 transformed P-value of each gene, and the chromosomal position (start position) on the x-axis. The dashed line indicates the threshold for genome-wide significance of the gene-based test (P< 2.76×10⁻⁶; 0.05/18,128), and the dotted line indicates the suggestive threshold (P<2.76×10⁻⁵; 0.5/18,128). (d) Gene expression profiles of identified genes for 53 tissue types. Expression data were extracted from the Genotype-Tissue Expression (GTEx) database. Expression values (RPKM) were log2 transformed with pseudocount 1 after winsorization at 50 and averaged per tissue. Gene-set tests for tissue expressions were calculated using MAGMA (Online Methods). (e) Enrichment of genetic signal for neuroticism in 24 brain cell types. The dashed line indicates the Bonferroni-corrected significance threshold (P=0.05/7,323=6.83´10-6).
19 of the 119 genes implicated through chromatin interaction mapping are especially interesting as they are implicated via interactions between two independent GWS genomic risk loci. There are several chromatin interactions in 7 tissue types (aorta, hippocampus, left ventricle, right ventricle, liver, spleen, pancreas) across two risk loci on chromosome 6 (Fig. 3a). Two genes are located in locus 45 and are mapped by chromatin interactions from risk locus 46 (HFE and HIST1H4C), and another 16 genes are coding histones in locus 46 and are mapped by interactions from locus 45 (Supplementary Table 15). XKR6 is located on chromosome 8 in risk locus 61, and is implicated by chromatin interactions in 5 tissue types (aorta, left ventricle, liver, pancreas and spleen) including cross locus interactions from locus 60 (Fig. 3b; Supplementary Table 15). This gene is also mapped by eQTLs in blood and transformed fibroblasts. Out of the 19 genes mapped by two loci, 4 are located outside of the risk loci (HIST1H2AI, HIST1H3H, HIST1H2AK and HIST1H4L), and 7 are also implicated by eQTLs in several tissue types (HFE in adipose subcutaneous, aorta, esophagus muscularis, lung, tibial nerve, sub-exposed skin and thyroid; HIST1H4J in blood and adrenal gland; and HIST1H4K, HIST1H2AK, HIST1H2BO and XKR6 in blood).
Gene-based P-values were used for gene-set analysis in MAGMA23,26, testing 7,246 predefined gene-sets derived from MsigDB24, gene expression profiles in 53 tissue types obtained from the GTEx Project25, and 24 cell-type specific expression profiles using RNAseq information26 (Online Methods). Neuroticism was significantly associated with genes predominantly expressed in 11 brain tissue types (Fig. 2d; Supplementary Table 17-18) and with 7 gene ontology (GO) gene-sets, with the strongest association for neurogenesis (P=0.0004) and neuron differentiation (P=0.002) (Supplementary Table 17). Conditional gene-set analyses (Online Methods) suggested that 3 of the 7 gene-sets (neurogenesis, P=4.4×10⁻⁹; behavioral response to cocaine, P=1.84×10⁻⁷; axon part, P=5.26×10⁻⁸) had largely independent associations, implying a role in neuroticism (Supplementary Table 19). Conditional analyses of the tissue-specific expression ascertained general involvement of (frontal) cortex expressed genes (Supplementary Table 20; Supplementary Fig. 4).
Cell type specific gene-set analysis showed significant association with genes expressed in multiple brain cell types (Fig. 2e; Supplementary Table 21), with dopaminergic neuroblasts (P=3×10⁻⁸), medium spiny neurons (P=4×10⁻⁸) and serotonergic neurons (P=1×10⁻⁷) showing the strongest associations, and conditional analysis indicated that these three cell types were also independently associated with neuroticism.
Aiming to further specify neuroticism’s neurobiological interpretation, we compared the genetic signal of the full neuroticism trait to that of two genetically distinguishable neuroticism subclusters depressed affect and worry13 (Online Methods). As a validation of the depressed affect dimension, we also compare with GWAS results for depression. GWA analyses of the subclusters were conducted on the UKB-data only (dictated by item-level data availability; Online Methods; depressed affect, N=357,957; worry, N=348,219). For depression, our metaanalysis comprised data from the UKB14 (N=362,696; Supplementary Fig. 5), 23andMe15 (N=307,354), and the Psychiatric Genetics Consortium (PGC27; N=18,759) (total N=688,809, not previously published; rg between samples: 0.61-0.80; Online Methods; Supplementary Table 22, Supplementary Information). Genetic correlations of neuroticism with all three phenotypes were considerable (depression: rg=0.79; depressed affect: rg=0.88, worry: rg=0.87; Supplementary Table 23).
The subclusters showed notable differences in genetic signal (e.g., exclusive GWS associations on chromosomes 2 and 19 for depressed affect, and chromosomes 3 and 22 for worry; Supplementary Figs. 6-12; Supplementary Tables 24-26). Of the 136 genetic loci associated with neuroticism, 32 were also GWS for depressed affect (7 shared with depression) but not for worry, and 26 were also GWS for worry (3 shared with depression) but not for depressed affect (Supplementary Table 27; Supplementary Fig. 12). These results were mirrored by gene-based analyses (Supplementary information; Supplementary Tables 28-30; Supplementary Fig. 13), suggesting that part of neuroticism’s genetic signal originates specifically in one of the two subclusters, possibly implicating different causal genetic mechanisms.
To test specificity of the gene-sets implicated in neuroticism in the conditional analyses, we repeated the analyses, but now corrected for depressed affect, and worry scores, respectively (Supplementary Table 31; Supplementary Fig. 14). The association with ‘axon-part’ was markedly lower after correction for worry scores (uncorrected P=5.26×10⁻⁸; corrected for depressed affect P=2.42×10⁻⁶; corrected for worry P=.0013), suggesting that the involvement of ‘axon-part’ in neuroticism originates predominantly from the worry-component.
To examine the genetic correlational pattern of neuroticism, and to compare it to the patterns observed for depression, depressed affect and worry, we used LDSC to calculate genetic correlations with 35 traits for which large-scale GWAS summary statistics were available (Supplementary Table 32; Online Methods). We observed 11 Bonferroni-corrected significant genetic correlations for neuroticism (α=0.05/(4´35); P<3.6×10⁻⁴) (Fig. 4; Supplementary Table 33), covering previously reported psychiatric traits (rg range: .20-.82) and subjective well-being (rg= -.68). These correlations were supported by enrichment of neuroticism genes in sets of genes previously implicated in psychiatric traits (Supplementary Table34). The rg’s of depression and depressed affect strongly mirrored eachother (correlation between their rg’s is r=.98; Supplementary information), validating the depressed affect cluster. The correlational patterns for depressed affect and worry were markedly different and sometimes antipodal, with the genetic signal of the full neuroticism trait being a blend of both.

Genetic correlations of neuroticism, depression, depressed affect and worry with various traits and diseases. LD score regression (Online Methods) tested genome-wide SNP associations for the neuroticism score against previously published results for 35 neuropsychiatric outcomes, antropometric and health-related traits, and brain morphology (Supplementary Table 32-33).
In conclusion, we identified 119 novel genetic loci for neuroticism. Extensive functional annotations highlighted several genes being implicated through multiple routes. We demonstrated the involvement of specific neuronal cell types and three independently associated genetic pathways, and established the genetic multidimensionality of the neuroticism phenotype, and its link with depression. The current study provides new leads, and testable functional hypotheses for unraveling the neurobiology of neuroticism, its subtypes, and genetically associated traits.
URLs
http://ctg.cncr.nl/software/magma
http://software.broadinstitute.org/gsea/msigdb/collections.jsp
Author Contributions
S.vd.S and D.P. conceived the study. M.N. and P.R.J. performed the analyses. S. St. performed the quality control on the UK Biobank data and wrote a pipeline to facilitate data processing. K.W. constructed the tool for biological annotation and ran the analyses. J.B. and P.F.S. performed the single-cell gene-expression analysis. M.N., P.R.J., S.vd.S and D.P. wrote the paper. All authors discussed the results and commented on the paper.
23andMe Research Team contributors
Michelle Agee, Babak Alipanahi, Adam Auton, Robert K. Bell, Katarzyna Bryc, Sarah L. Elson, Pierre Fontanillas, Nicholas A. Furlotte, David A. Hinds, Bethann S. Hromatka, Karen E. Huber, Aaron Kleinman, Nadia K. Litterman, Matthew H. McIntyre, Joanna L. Mountain, Elizabeth S. Noblin, Carrie A.M. Northover, Steven J. Pitts, J. Fah Sathirapongsasuti, Olga V. Sazonova, Janie F. Shelton, Suyash Shringarpure, Chao Tian, Joyce Y. Tung, Vladimir Vacic, and Catherine H. Wilson.
Author Information
Reprints and permissions information is available at www.nature.com/reprints. The authors declare no competing financial interest. Correspondence and resquests for materials should be addressed to d.posthuma{at}vu.nl.
Acknowledgements
This work was funded by The Netherlands Organization for Scientific Research (NWO Brain & Cognition 433-09-228, NWO MagW VIDI 452-12-014, NWO VICI 435-14-005 and 453-07-001, 645-000-003), Sophia Foundation for Scientific Research (SSWO, grant nr: S-1427). JB was funded by the Swiss National Science Foundation. Analyses were carried out on the Genetic Cluster Computer, which is financed by the Netherlands Scientific Organization (NWO: 480-05-003), by the VU University, Amsterdam, the Netherlands, and by the Dutch Brain Foundation, and is hosted by the Dutch National Computing and Networking Services SurfSARA. This research has been conducted using the UK Biobank Resource (application number 16406). We would like to thank the participants, including the 23andMe customers who consented to participate in research, and researchers who collected and contributed to the data.
Footnotes
↵§ These authors jointly supervised this work
References and notes


