

ABSTRACT
Most human protein-coding genes are regulated by multiple, distinct promoters, suggesting that the choice of promoter is as important as its level of transcriptional activity. While the role of promoters as driver elements in cancer has been recognized, the contribution of alternative promoters to regulation of the cancer transcriptome remains largely unexplored. Here we show that active promoters can be identified using RNA-Seq data, enabling the analysis of promoter activity in more than 1,000 cancer samples with matched whole genome sequencing data. We find that alternative promoters are a major contributor to tissue-specific regulation of isoform expression and that alternative promoters are frequently deregulated in cancer, affecting known cancer-genes and novel candidates. Noncoding passenger mutations are enriched at promoters of genes with lower regulatory complexity, whereas noncoding driver mutations occur at genes with multiple promoters, often affecting the promoter that shows the highest level of activity. Together our study demonstrates that the landscape of active promoters shapes the cancer transcriptome, opening many opportunities to further explore the interplay of regulatory mechanism and noncoding somatic mutations with transcriptional aberrations in cancer.
INTRODUCTION
The key element in regulation of transcription is the region upstream of the transcription start sites (TSS), the promoter. Promoters contain the elements required to initiate transcription, and they integrate the signals from distal regulatory elements and epigenetic modifications that together determine the level of transcription. In the human genome, the majority of protein coding genes are regulated by multiple promoters that initiate transcription for different gene isoforms. In contrast to alternative splicing which regulates gene isoform expression post-transcriptionally, the usage of alternative transcription start sites provides a way to regulate gene isoform expression pre-transcriptionally. Therefore, promoters not only determine when a gene is active and how active it is, they also regulate which gene isoform will be expressed.
In cancer, somatic mutations, genomic re-arrangements, and changes in the regulatory or epigenetic landscape have been found to affect the promoter of several oncogenes, and it has been suggested that promoters contribute to the malignant transformation of the cells (Khurana et al., 2016; Sharma, Kelly, & Jones, 2010; Vogelstein et al., 2013). Genome-wide studies of promoters using the H3K4me3 histone modification, an epigenetic mark found at active promoters (Bernstein et al., 2002; Ng, Robert, Young, & Struhl, 2003; Pokholok et al., 2005; Santos-Rosa et al., 2002; Schneider et al., 2004; Schubeler et al., 2004), or CAGE tag sequencing of the 5’ end of transcripts (Kanamori-Katayama et al., 2011; Kodzius et al., 2006; Shiraki et al., 2003; Takahashi, Kato, Murata, & Carninci, 2012) have found that transcription start sites frequently are differentially used in cancer (Hashimoto et al., 2015; Kaczkowski et al., 2016). Genes such as the proto-oncogene MET have been found to show specific activation of alternative promoters, suggesting that the choice of promoter is as important as its level of transcriptional activity (Gherardi, Birchmeier, Birchmeier, & Vande Woude, 2012; Muratani et al., 2014). However, as data such as H3K4me3 profiles or CAGE-Tag is not available for most cancer studies, the role of alternative promoters in cancer remains largely unexplored.
Because any change in a cell’s identity and function will be reflected in a change in gene expression, transcriptome profiling by RNA-Sequencing is one of the most widely studied large-scale molecular phenotypes in cancer. Analysis of gene expression in cancer has uncovered fundamental insights of tumor biology (Cancer Genome Atlas, 2012), enabled stratification of cancer types (Cancer Genome Atlas Research, 2012), predicted clinical outcome (Gerstung et al., 2015), and guided treatment decisions (Cancer Genome Atlas Research, 2011), forming a cornerstone of data driven precision oncology. RNA-Seq data measures the transcriptome largely unbiased, and as promoters regulate expression of isoforms with distinct 5’ start sites, it could potentially be used to identify active promoters. However, even though several thousand such data sets exist, the link between alternative promoters and isoform diversity in cancer has not been studied.
Here we demonstrate that active TSSs can be inferred from RNA-Seq data, enabling the analysis of promoter activity in thousands of samples using publicly available expression data. We apply this approach to comprehensively analyze alternative promoters in 1,209 cancer samples with matched whole genome sequencing data covering 27 different cancer types (Amin, Brooks, & PCAWG-3, 2017), and we compare promoter usage to more than 1,500 normal tissue samples (G. T. Consortium, 2013). We find that alternative promoters are frequently used to increase isoform diversity and that a large number of known cancer genes and novel candidates show deregulation of promoters in cancer. By analyzing matched whole genome sequencing data we investigate the interplay of promoter activity with recurrence of somatic mutations, showing how the precise knowledge of the promoter landscape helps interpreting somatic changes in tumor genomes.
RESULTS
Identification of active promoters in 1,209 cancer samples from 27 cancer types
The promoter is defined as the regulatory region upstream of the transcription start site. Using the Ensembl v75 annotations (Yates et al., 2016), we compiled a set of 112,985 possible promoters, assuming that isoforms which have identical or very close TSSs are regulated by the same promoter (Frith et al., 2008). We then define promoter activity as the total amount of transcription initiated at each promoter. By quantifying the expression that is initiated at each promoter we can then infer levels of promoter activity from RNA-Seq data (Fig. 1a). As the number of promoters is much smaller than the number of isoforms per gene, the problem of promoter activity estimation is heavily reduced in complexity, resulting in more robust inference (Supplementary Fig. 1a). To further reduce the number of false positives, we restrict the analysis to promoters that can be uniquely identified (Supplementary Fig. 1b). Following this approach, we quantified promoter activity in 1,209 samples from the PCAWG cohort covering 27 cancer types. Across all samples we identified the most active promoter (major promoter) for 16,694 genes, we identified 21,313 additional promoters that are active at lower levels (minor promoters), and we found 56% (48,312) of promoters to be inactive (Fig. 1b, Supplementary Fig. 1c). In the absence of regulatory genomics data, the first promoter of a gene is often assumed to be active. Interestingly, our data shows that the dominating major promoters can occur at any position within a gene. We find that 1 out of 3 major promoters are located downstream of the first TSS (Fig. 1c), demonstrating how RNA-Seq data adds information and context to genome annotations.

Promoter activity estimation using RNA-Seq data and comparison with ChIP-Seq and CAGE data. (a) Schematic representation of promoter activity quantification using RNA-Seq data. Isoforms which are controlled by the same promoter are grouped and promoter activity is estimated as the total expression of these grouped isoforms. (b) Categorization of annotated promoters based on the average activity estimate across all samples. Major: most active promoter for a gene; minor: active promoter, lower activity than major promoter; inactive: no activity detected (threshold: 0.5). (c) Major/minor promoter proportions across TSSs ranked by position (5’ to 3’), based on multi promoter genes with at least one active promoter. (d) Mean H3K4me3 ChIP-Seq signal across 59 ENCODE cell lines for the pan-cancer major (green), minor (red), and inactive promoters (purple) at the first TSS. (e) Percentage CAGE tag support for inactive, low, and high activity promoters. (f) Correlation of promoter activity estimates and H3k4me3 ChIP-Seq signal for lymphoid, liver, kidney, and colorectal ENCODE cell lines and PCAWG samples. PCAWG samples show higher correlation with ChIP-Seq data from the matching tissue.
To evaluate the accuracy of expression-based estimation of promoter activity, we compared them to publicly available H3K4me3 ChIP-Seq and CAGE tag data from a variety of different cell lines and tissues (E. P. Consortium, 2012; F. Consortium et al., 2014; Lizio et al., 2015). The major promoters identified in the PCAWG cohort show the highest levels of H3K4me3 and CAGE tag support, whereas promoters identified as inactive show the lowest H3K4me3 levels and CAGE tag support, demonstrating that expression and epigenetics based estimates show a remarkable level of consistency (Fig. 1d, e, Supplementary Fig. 1d, e, f). Furthermore, estimates from cancers were most similar to ChIP-Seq profiles from matching cell lines (Fig. 1f). Interestingly, while promoter activity estimates from patients were generally highly consistent, cell lines showed a much higher variance (Supplementary Fig. 1g). It has been observed before that cancer cell lines differ from the primary tissue, suggesting that RNA based estimates more accurately reflect the promoter landscape of the tumor than cell line based estimates. Overall, this analysis demonstrates that RNA-Seq data enables the quantitative, robust, and reproducible estimation of promoter activity.
Alternative promoters are a major contributor to isoform diversity
Genome-wide, we find that promoter activity is dominated by the tissue and cell of origin for each cancer type (Fig. 2a). This closely resembles the observation from gene expression, despite using only the minimal set of discriminative reads indicative of promoter activity (Supplementary Fig. 2a). In contrast to gene-level expression estimates, promoter activity enables us to investigate the contribution of each promoter to the overall expression pattern. Among all expressed protein-coding genes, 49% have at least 2 active promoters that contribute to more than 10% of the overall gene expression (Fig. 2b, c). In principle, these promoters are independent regulatory units which can be used in a different context to control changes in isoform expression. The usage of such alternative promoters - promoters whose activity depends on the context but not on the activity of the gene’s remaining promoters - will not be detectable with gene level based expressions analysis. Therefore, even though globally promoter activity reflects gene expression, there is additional information in promoter activity that cannot be detected at the gene expression level.

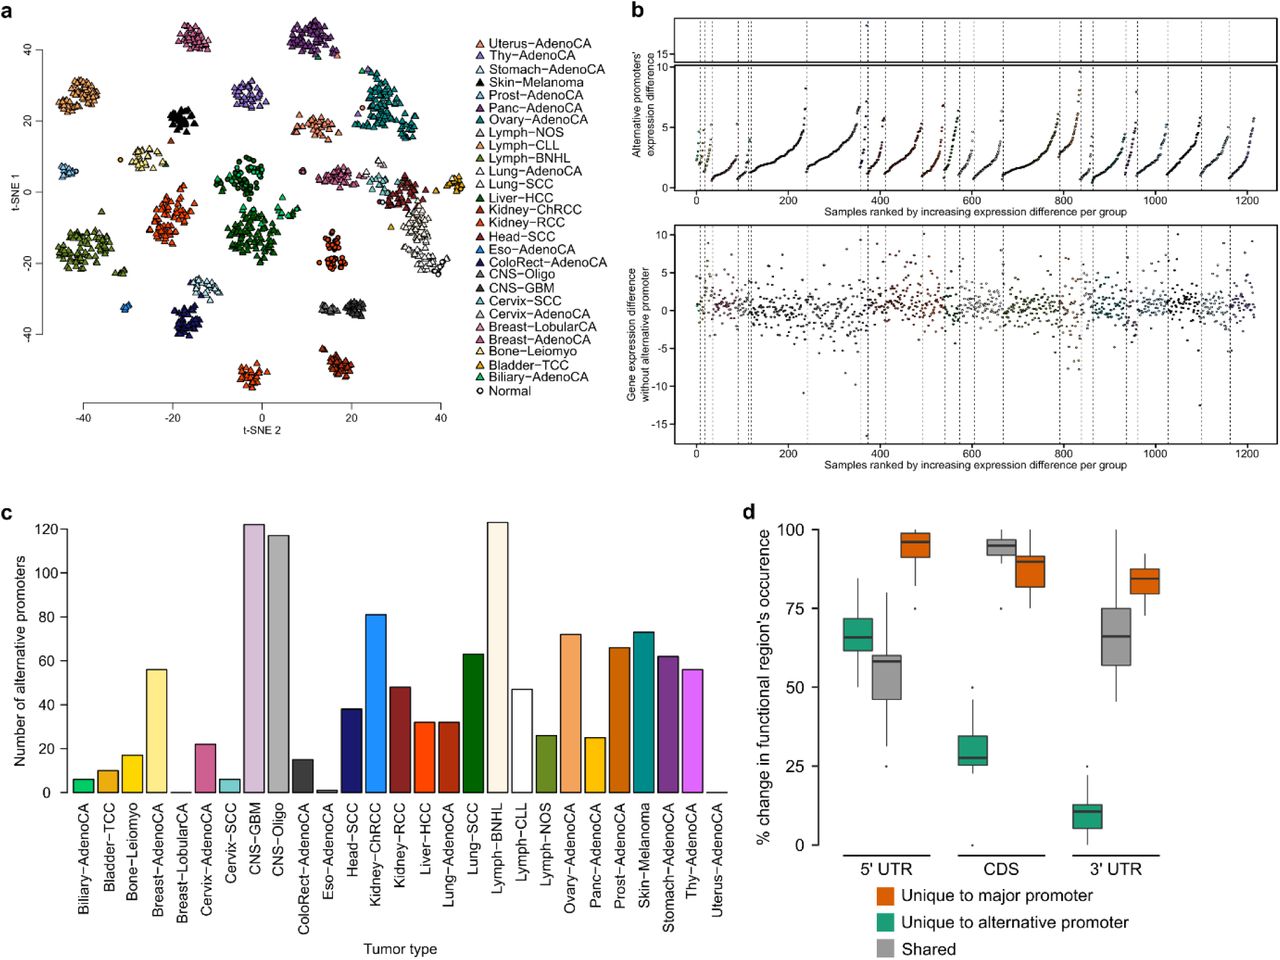
Alternative promoters are a major contributor to isoform diversity. (a) t-SNE plot using the top 1,500 promoters with the highest variance in promoter activity. (b) Comparison of major promoter activity and gene expression (sum of all promoters). A single promoter often does not fully explain gene expression, minor promoters contain additional information. (c) Most active promoters are observed at genes with multiple promoters. (d) Heatmap showing the normalized mean promoter activity for tissue-specific alternative promoters of genes which do not change in overall expression. (e) Shown is the mean read count at the GJB1 gene locus for samples from the central nervous system (CNS) and from all other tissues. The light blue and red regions highlight the two alternative promoters. (f) The second GJB1 promoter (prmtr.51019) is more active in CNS compared to all other tissues, whereas the first promoter (prmtr.51018) is inactive in CNS samples. (g) Comparison of gene expression levels for GJB1.
(h) Number of isoforms that can be transcribed from tissue-specific alternative promoters. (i) Alternative promoters are most often minor promoters. (j) Shown is the fraction of isoform switching events across tissues that involve a change in promoter. (k) Schematic representation for the analysis of 5’UTR, CDS, and 3’ UTR regions and their association with alternative promoter usage. Regions unique to the major and alternative promoter, and regions shared among them are quantified for each tissue-specific alternative promoter. (l) Shown is the percentage of the 5’UTR, 3’UTR, and CDS sequence that is unique to the alternative promoter gene isoforms (green), unique to the major promoter gene isoforms (blue), and that is shared (gray). Tissue-specific promoters shorten the coding sequence by 30% on average.
To approximate the prevalence of alternative promoters as context-specific regulators of transcription, we searched for promoters that show significantly changed activity across tissues at genes that do not show an overall change in expression (Fig. 2d, Supplementary Fig. 2b, c). Strikingly, our data demonstrates that even genes that do not show any tissue-specificity at the gene expression level can be under control of 2 independent, highly tissue-specific alternative promoters which regulate distinct gene isoforms (Fig. 2e, f, g). The majority of tissue-specific alternative promoters activate single isoforms, providing a direct link between transcriptional regulation and isoform expression without any change in regulation of alternative splicing (Fig. 2h). Alternative promoters often correspond to minor promoters that are expressed at lower levels compared to the constitutively active major promoter (Fig. 2i). However, for 18% of genes we observe that the major promoter is switched, causing a switch in major isoforms (Fig. 2i). Interestingly, on a global level, 60% of all isoform switching events involve a switch in promoters (Fig. 2j), demonstrating that alternative promoters are a major contributor to tissue-specific transcriptional diversity.
To understand the consequence of alternative promoter usage on the gene product, we examined how the functional regions (5’ UTR, CDS, 3’UTR) differ compared to the major promoter (Fig. 2k). As expected, use of an alternative promoter is almost always associated with a change in the 5’ UTR region (Fig. 2l). A change in promoters also dramatically effects the coding part of RNAs, often involving a change of more than 50% of the protein coding sequence (Fig. 2l). Surprisingly 89% of alternative promoters encode for isoforms which have a distinct 3’ UTR sequence (Supplementary Fig. 2d). This suggests that promoters not only regulate transcription initiation, but that they specifically regulate alternative isoforms that are marked by distinct sequences, possibly influencing post transcriptional regulation, translation, and protein structure in a context-specific manner.
Cancer-associated promoters regulate isoform switching of oncogenes and tumor suppressors
Many cancer-associated genes and pathways have been discovered by comparing the expression profile of cancer with the expression profile of normal tissues (Fay et al., 2003; Gross, Kreisberg, & Ideker, 2015; Hippo et al., 2002; Rapin et al., 2014). The large number of context-specific alternative promoters found in this study suggests that promoters might be among the unknown driving forces behind the transcriptional changes in cancer. To investigate this hypothesis, we searched for promoters that show a change in activity in cancer compared to normal tissue using adjacent samples from the PCAWG data set and additionally 1,727 samples from GTEx (G. T. Consortium, 2013) (Fig. 3a). For the majority of tumor types the most similar tissue is indeed the tumor tissue (Fig. 3b, Supplementary Fig. 3a). Interestingly, lung squamous cell carcinomas and bladder carcinomas are most similar to normal skin tissue, reflecting the cell or origin for these tumors (Cancer Genome Atlas Research, 2014). Using these matched tissue groups, we then identified cancer-associated alternative promoters. For each tissue we find between 93 and 226 promoters that are differentially regulated in cancer compared to normal (Fig. 3c, Supplementary Fig. 3b, d). The change in expression due to cancer-associated promoters is largely independent from the other promoters for each gene, confirming that alternative promoters indeed act as independent regulatory units which can specifically be deregulated in cancer (Fig. 3d, Supplementary Fig. 3c, e). Our analysis recapitulates promoter switching events that have been associated with cancer, amongst others for MEST (Fig. 3e, f) (Nakanishi et al., 2004) and MET (Gherardi et al., 2012). However, the vast majority of events are novel and have not been described before. Among the genes that show alternative promoter activation in cancer are known cancer biomarkers such as SEPT9 (deVos et al., 2009) or TNFRSF19 (TROY) (Paulino et al., 2010), oncogenes and tumor suppressors such as IKZF1 (Boer et al., 2016) which has been reported to be involved in human B-cell acute lymphoblastic leukemia, the well described proto-oncogene CTNNB1 (β-catenin) (Lazar et al., 2008), BID (Supplementary Fig. 3f) (Lee et al., 2004), a pro-apoptotic target gene of p53, or MLLT1 (Perlman et al., 2015), which has been associated with childhood kidney cancer (Supplementary Fig. 3g). Interestingly, alternative promoters also differ between closely related tumor types from the same tissue. For the 2 different kidney tumor types we find a large number of genes that only show minor changes in overall gene expression, but where alternative promoter usage causes a significant, tumor-type-specific change in isoform expression (Fig. 3g, 3h, Supplementary Fig. 3h, i). While some promoters were specifically deregulated in single tumor types, we observed that a number of alternative promoters were deregulated in multiple tumor types from different tissues compared to their matched normal counterpart. Overall, we find 204 such promoters, several of which belong to known oncogenes and tumor suppressors (Futreal et al., 2004) (Fig. 3i). Among the known cancer-associated genes for which we find differentially activated promoters are the previously described MET gene (Fig. 3j), and genes for which usage of an alternative promoter in cancer has not been described such as LSP1, or SPOP (Fig. 3k). Again, we find that the choice of promoters changes the 5’UTR, CDS, and 3’UTR sequences, indicating that transcriptional changes in cancer are translated into functional differences in the gene product (Supplementary Fig. 3j, k). Together, our analysis highlights that alternative promoter usage provides a major source of transcript diversity affecting known cancer genes and new candidates, demonstrating that promoters are a key contributor to the deregulated cancer transcriptome, often independently from an overall change in gene expression.
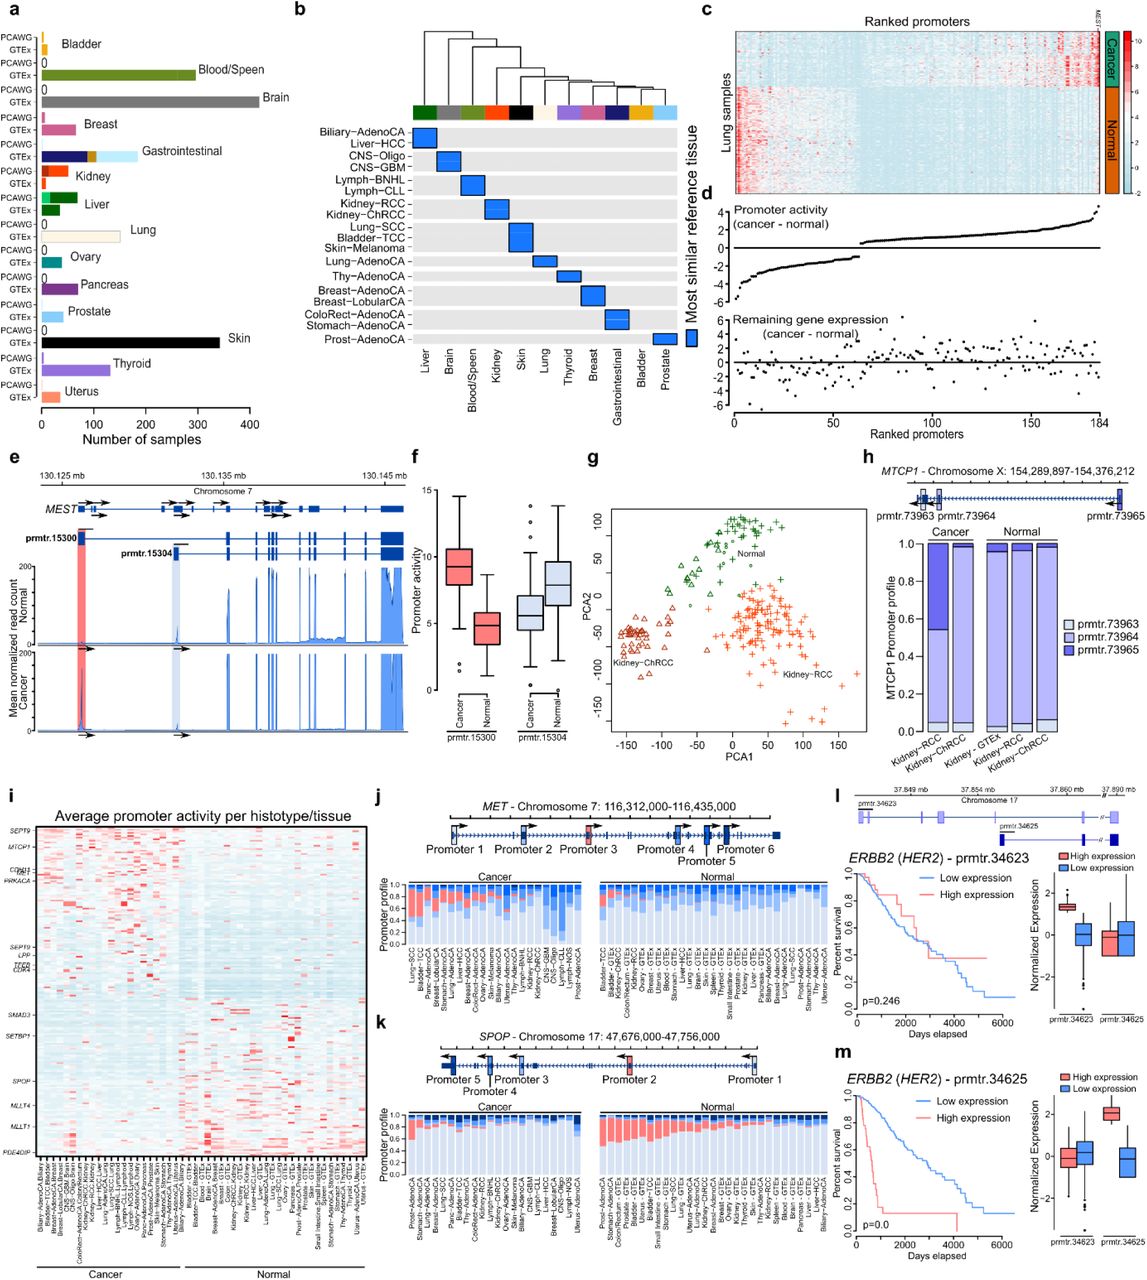
Cancer-associated alternative promoters regulate oncogenes and tumor suppressors both for individual tissue types and across cancers. (a) Overview of cancer and normal data obtained by combining PCAWG and GTEx samples. (b) Cancer samples are most similar (highest average correlation of promoter activity) to the normal samples from the same tissue type. Tumor types with less than 15 normal and cancer samples are excluded from this analysis, normal samples are batch corrected to account for different data sources (PCAWG and GTEx).
(c) Heatmap showing the normalized promoter activity estimates for lung cancer and normal samples, ranked by mean difference. (d) Difference in cancer-associated promoter activities (upper panel) and gene expression excluding alternative promoters (lower panel) for lung cancer and normal samples, ranking is similar to heatmap in (c). (e) Shown is the mean read count at the MEST gene locus for lung cancer and lung normal samples (left panel). The light blue and red regions highlight the cancer-associated promoters. First promoter is the major promoter in cancer samples whereas second promoter is the major promoter in the normal samples. (f) The promoter activity for the first (red) and second (light blue) promoters of MEST in cancer and normal samples show the switch of promoters between cancer and normal samples. (g) PCA plot using the top 1,000 promoters with the highest variance in promoter activity in kidney samples. (h) Shown is the MTCP1 locus (top) and mean relative activity across different kidney cancer and normal samples (bottom). The first promoter of MTCP1 (prmtr.73965, dark blue) displays Kidney-RCC tumor subtype specific activation. (i) Heatmap showing the average activity of promoters that significantly differ between cancer and normal samples across multiple cancer types (pan-cancer associated promoters). Promoters of known cancer-associated genes are highlighted (Futreal et al., 2004). (j, k) Relative activity profile of pan-cancer-associated promoters. Shown is the MET gene locus which shows activation of an alternative promoter in cancer (j); and the SPOP gene locus which shows lower activity of an alternative promoter across multiple cancer types (k). (l, m) Shown is the ERBB2 gene locus (top). Increased activity of the second (minor) promoter (prmtr.34625) is associated with decreased survival in lower grade glioma patients (m), whereas increased expression of the first (major) promoter (prmtr.34623) is not associated with survival (l). The boxplots on the right panels show the activity of each promoter in their respective high (red) and low (blue) activity sample groups i.e. the same sample groups as the survival plots on the left panels.
Alternative promoters are associated with survival
Gene expression has been used as a biomarker to predict cancer patient survival (Director’s Challenge Consortium for the Molecular Classification of Lung et al., 2008; Finak et al., 2008; Salazar et al., 2011). As our data suggests that alternative promoters are often independently regulated, we hypothesized that promoter activity might provide a more accurate predictor for genes that use multiple promoters. To test this hypothesis, we investigated the association of promoter activity with survival estimates. Indeed, we find a number of genes that show a significant association with survival for a specific promoter. Amongst others, we find that a minor promoter of ERBB2 (also known as HER2) in lower grade glioma patients is predictive of poor outcome, whereas the major promoter shows no significant association with patient survival (Fig. 3l, m). High gene expression levels of ERBB2 have been associated with aggressive tumor types (Slamon et al., 1987). Our data suggests that such associations can be promoter specific, indicating that survival is either associated with the underlying regulatory changes or with the differential usage of gene isoforms determined through the choice of promoters. Thus, the level of promoter activity can potentially be more specific as a biomarker compared to gene expression, demonstrating the promise to further explore their role in cancer.
Patterns of noncoding promoter mutations in cancer
One of the key properties of cancer is an increase in mutation rates that can affect gene products, but also gene regulation (Kandoth et al., 2013; Rheinbay, Parasuraman, et al., 2017; Weinhold, Jacobsen, Schultz, Sander, & Lee, 2014). In order to understand mutational patterns at promoters, we therefore investigated the mutational burden across all annotated promoters (Fig. 4a). The overall numbers of noncoding mutations in promoters reflect the number of mutations observed genome-wide, with melanoma showing the highest numbers of mutations (Fig. 4b). Only very few promoters show mutations in more than 4 samples, reflecting limitations due to small sample size for certain tumor types, but also confirming that the majority of mutations at promoters are likely to be non-functional, non-recurrent ‘passenger’ mutations (Fig. 4c). The only gene that showed highly recurrent noncoding promoter mutations is the TERT gene, which has been well characterized (Fig. 4d) (Bojesen et al., 2013; Rafnar et al., 2009; Vinagre et al., 2013). TERT has 3 annotated promoters, the most frequent mutation occurs at the first promoter, and the mutations are associated with a change in promoter activity (Fig. 4e, f). While TERT mutations occurred in multiple cancer types, other mutations where tissue specific. Among these tissue-specific mutations that are most recurrent are several known cancer genes in Lymphoma (Supplementary Fig. 4a). Enrichment in cancer genes was increased after filtering out inactive promoters, suggesting that promoter activity can be used to reduce the number of candidate promoters, thereby increasing the power to detect recurrent mutations (Supplementary Fig. 4b, c). While the data supports a role of promoter mutations in cancer, we find that they in general are rare compared to the most recurrent protein coding mutations.

Overview of noncoding promoter mutations across different cancer types and their association with expression. (a) Schematic representation of noncoding promoter mutation burden calculation. (b) Overview of noncoding promoter mutations per sample. (c) Overview of the number of mutated promoters per tumor type for promoters with at least 3 mutated samples. (d) Promoters ranked by the number of mutated samples across all cancer types. Promoters with recurrent noncoding mutations reveal cancer census genes such as TERT, CXCR4, PAX5 and CIITA. (e) Shown is the TERT locus and the number of mutations observed at each position. The first promoter shows a highly recurrent noncoding mutation reported previously (Bojesen et al., 2013; Rafnar et al., 2009). (f) Comparison of promoter activity for mutated and non-mutated samples. (g) Proportion of single and multi TSS genes for different numbers of mutations at promoters. Single TSS genes are more frequently mutated than genes with multiple promoters (multiple TSS genes). (h) lncRNAs are more frequently mutated at the promoter than protein coding genes. (i) Boxplot comparing the replication timing across samples with different number of mutations, a higher number of mutations is associated with later replication timing. (j) The rate of mutations across the promoters of the same gene is independent from the promoter position. (k) Boxplot comparing the promoter activity for promoters at different TSS positions. (l) Replication timing is similar across promoters of the same gene. (m) Association of promoter activity with noncoding promoter mutations across all samples. The orange denotes the significant associations whereas * marks promoters of genes that have driver mutations. (n) Recurrently mutated promoters have higher activity compared to other promoters from the same genes. Driver events used here are from TERT, PAX5, WDR74, HES1, IFI44L, RFTN1, and POLR3E.
It has been reported that mutational heterogeneity leads to distinct mutational patterns across the genome depending on transcriptional activity, sequence content, or replication timing (Lawrence et al., 2013). As promoters themselves are highly heterogeneous, we asked whether mutational heterogeneity systematically influences the observed mutation burden at promoters. We find that promoters of genes with a less complex promoter architecture show significantly higher numbers of mutations (Fig. 4g). Such genes are more often non-coding (Fig. 4h), and associated with late replication timing (Fig. 4i), indicating that mutational burden indeed differs between different categories of promoters. However, within a gene, the mutation burden is evenly distributed across promoters that do not overlap with protein coding sequences (Fig. 4j, k, l).
Next we combined the promoter activity estimates with the mutation burden to identify somatic variants that are associated with a change in promoter activity. Even though the sample number for each cancer type appears to be a limiting factor in the PCAWG cohort, we find several candidate promoter QTLs indicating an association of somatic variants and promoter activity (Fig 4m, Supplementary Fig. 4d).
A small set of driver promoter mutations can be found across the PCAWG cohort. Among the genes that show recurrent promoter mutations are TERT, WDR74, and PAX5 (Rheinbay, Getz, & PCAWG-2-5-9-14, 2017). Interestingly, the highly mutated promoter is often the major promoter, suggesting that promoter activity estimates provide a way to filter, and possibly interpret recurrent mutations in cancer (Fig. 4n). As RNA-Seq data is among the most widely generated data, our approach will provide a powerful extension to better understand the interplay of somatic mutations and transcriptional deregulation in cancer.
DISCUSSION
Promoters are the key elements that link gene regulation with expression, yet their contribution to cancer has not been studied on large scale patient cohorts. By analyzing more than 1,200 RNA-Seq samples, we find that genes frequently use multiple promoters to express tissue-specific transcripts and that promoters are commonly deregulated in cancer. Our analysis suggests that the choice of promoter is tightly regulated, has a significant influence on the cancer transcriptome, and indicates that promoters possibly contribute to the cellular transformation of cancer.
By using RNA-Seq data, our approach enables the analysis of promoter activity in the PCAWG cohort without the need for additional experiments. Overall these estimates are highly accurate although we observe an increased uncertainty for some promoters due to use of short read sequencing data. In particular, we find that transcription start sites that lie within internal exons or that overlap with splice acceptor sites are difficult to accurately identify. Information from the 3’ end of transcripts can be used to predict their activity, however this approach heavily depends on accurate annotations and high quality isoform abundance estimates, and a high level of uncertainty remains. Both CAGE tag data and ChIP-Seq data suggest that these “internal” TSSs are much less used compared to the remaining TSSs, therefore our analysis still captures an accurate and comprehensive view of the promoter landscape in cancer, enabling the analysis of promoter activity on a much larger scale compared to other genomic assays.
Strikingly, we find that promoters contribute to a majority of changes in major isoform expression. Our results suggest that transcriptional regulation, possibly involving sequence specific transcription factors and epigenetic modifiers, provide a robust way to alter isoform expression pre-transcriptionally. The choice of promoter often has an impact on the coding sequence suggesting that a switch in promoters will alter protein isoforms or result in noncoding transcription. Interestingly, we also observe a frequent change in the 3’ UTR sequence that contains regulatory elements such as miRNA binding sites, indicating a possible relation between pre- and post-transcriptional regulation. Alternative promoters often show lower levels of activity, and the functional consequence of such transcripts remains to be validated. However, we also find a number of promoter switching events that dramatically change the gene product. Such alternative promoters are frequently found in cancer, demonstrating that this aspect has a large potential to be further explored.
In summary, our study demonstrates the pervasive role of alternative promoters in context-specific isoform expression, regulation of isoform diversity, and highlights aberrant promoter activation in cancer. We provide a comprehensive catalog of active promoters and their expression pattern across 27 cancer types that will be a highly useful resource to understanding the roles of gene regulation and noncoding mutations in cancer. As the vast majority of alternative promoters in cancer has not been described before, our study open numerous possibilities to explore their contribution to tumor formation, diagnosis, or treatment.
METHODS
Promoter activity quantification
In this study, we used Ensembl v75 annotation to determine the set of promoters. We examined the first exon of each TSS and combined the TSS’s with overlapping first exons to obtain the set of promoters. We used these promoters in the downstream analysis to quantify promoter activities. Since a single promoter can be composed of multiple TSSs, we choose the TSS with the highest activity in majority of the samples as the TSS of the promoter. In case of a tie, the 5’ most TSS is chosen as the TSS of the promoter considered.
To quantify the activity of each promoter, we used the split reads aligning into the first intron of each promoter. Reads that connect the first exon with downstream exons were first normalized by reads of splice acceptor sites (indicative of usage of this exon as internal exon, not as first exon). We then standardized the read counts by the observed mean read count in each sample (further referred to as promoter activity estimates). To obtain gene expression estimates, we summed up the activities of each promoter belonging to each gene. We normalized each promoter’s activity by the gene expression to obtain relative promoter activities.
After quantifying the promoter activities for each sample, we divided the promoter set into 3 different categories depending on their activity, namely, major, minor and inactive promoters. We mark the promoters with the highest average activity for each gene across the sample cohort as major promoters. Promoters with average activities smaller or less than 0.5 constitute inactive promoters whereas the other promoters of the gene constitute minor promoters.
ChIP-Seq analysis
To assess the performance of our promoter activity quantification approach, we compared estimated promoter activities from RNA-Seq data with ChIP-seq data obtained from ENCODE project cell lines. We examined the region spanning 2000 bps upstream and downstream of each promoter for H3K4me3 histone modification signals. We used 59 cell lines from different tissue types that have H3K4me3 data available.
Alternative promoter analysis
We selected the 1500 promoters and genes with the largest variance across the PCAWG data cohort to demonstrate the tissue specific behavior of promoters and genes alike with a T-SNE plot. The “tsne” R package was used to generate T-SNE plots.
We removed transcription starts of exons that overlapped splice acceptors sites from this analysis as we found that their activity is less reproducibly quantified compared to first exons that do not contain splice acceptor sites. We identified promoters with context dependent activity by comparing the relative activity profiles across different conditions using a t-test. We selected the top 5000 promoters with Benjamini-Hochberg adjusted p-values of less than 0.005 as candidates. We further required each promoter to have at least 2 fold change in promoter activity and less than 1.5 fold change in gene expression across different conditions. To filter for inactive genes, we forced a gene expression threshold of 3 and promoter activity threshold of 2 in both conditions. Finally, we required each candidate gene to have at least 2 active promoters in both conditions. We used this approach to identify the tissue specific alternative promoters by comparing samples for each tumor type against all other samples.
Identification of isoform switch events
We find the major transcript of each gene in each tumor type using the mean activity across all tumor samples (tumor-specific major transcript). Additionally, we find the major transcript based on the pan-cancer mean activity (pan-cancer major transcript). For each tumor type, we identify the changes in major transcript by comparing tumor specific and pan-cancer major transcripts. A change in major transcript can occur via 2 different mechanisms: either the new tumor specific major transcript is regulated by a different promoter than the pan-cancer major transcript (i.e. a promoter switch event), or the promoter is still the same as the pan-cancer major transcript’s promoter but only the major transcript of this promoter is changed (i.e. a splicing event). For each tumor type, we count the number of major transcript changes for both of these mechanisms. Finally, we sum up the number of times the major transcript change has occurred due to splicing for all tumor types. Similarly, we sum up the number of times major transcript change has occurred due to promoter switch for all tumor types.
5’UTR, CDS, and 3’UTR analysis
To understand the functional effect of alternative promoters, we compared the major and alternative promoters for the samples of each tumor type. We determined the major promoters by the mean promoter activity across the samples of the corresponding tumor type. Then, we identify the regions unique to the major promoter, alternative promoter and the regions that are common in both. For each of these regions, we looked at the Ensembl annotations to determine the functional composition, i.e. 5’ untranslated region (5’UTR), exon, coding sequence (CDS) and 3’ untranslated region (3’UTR). We determined for each region not only whether we observe these functional regions, but also how much of total region is observed. We merge the results from all the tumor types to obtain the pan-cancer overview.
Identification of tumor specific and pan-cancer cancer-associated promoters
In order to identify cancer associated promoters, we downloaded normal samples from the GTEx project in addition to the normal samples from PCAWG. In total, we obtained 3233 normal samples from GTEx across a wide variety of tissue types and processed the same way as PCAWG samples to obtain promoter activities. We removed the batch effect that might originate from using 2 different data sets by using the “removeBatchEffect” function from ‘limma’ R package. We clustered the combined normal samples by hierarchical clustering where the distance measure was 1 – correlation of non-internal promoter activity. For downstream analysis, we removed internal promoters (see above) and used tumor types with at least 15 normal and tumor samples each for tumor type specific analysis.
For the tumor type specific analysis, we used a generalized linear model to obtain p-values for each promoter based on the relative promoter activity. We adjusted the p-values using the Benjamini-Hochberg method and selected the top 5000 promoters with adjusted p-values less than the background p-value. The background p-value is calculated by using all the promoters without any expression filtering (relative, absolute or fold change). For candidate promoters, we enforced at least 2 fold promoter activity change and at most 1.5 fold gene expression change. Additionally, we required each gene to have at least 2 active promoters (absolute promoter activity greater than 0.5 and relative activity greater than 0.1) and at least a gene expression of 3.
Similar to the tumor specific analysis, we examined the promoters that show context dependent activity pan-cancer wide. We used a generalized linear model with cancer/normal states as explanatory variables and used the same expression based filters to remove false candidates. The generalized linear model analysis is performed by using the ‘limma’ R package
Mutation burden analysis
To calculate the noncoding mutation burden at each promoters, we considered only the single nucleotide variants (SNVs) for donors with available RNA-Seq data and removed the SNVs located at exons of each gene (Synapse ID: syn7364923). Then, for each sample, we counted the number of noncoding SNVs falling in the 200bp window upstream the TSS of each promoter as the mutation burden.
Promoter QTL analysis
To determine the associations between promoter activity levels and noncoding promoter mutations, we used a generalized linear model to obtain the p-values for each recurrently mutated (at least 3 samples) active promoter and adjusted the p-values using the Benjamini-Hochberg method.
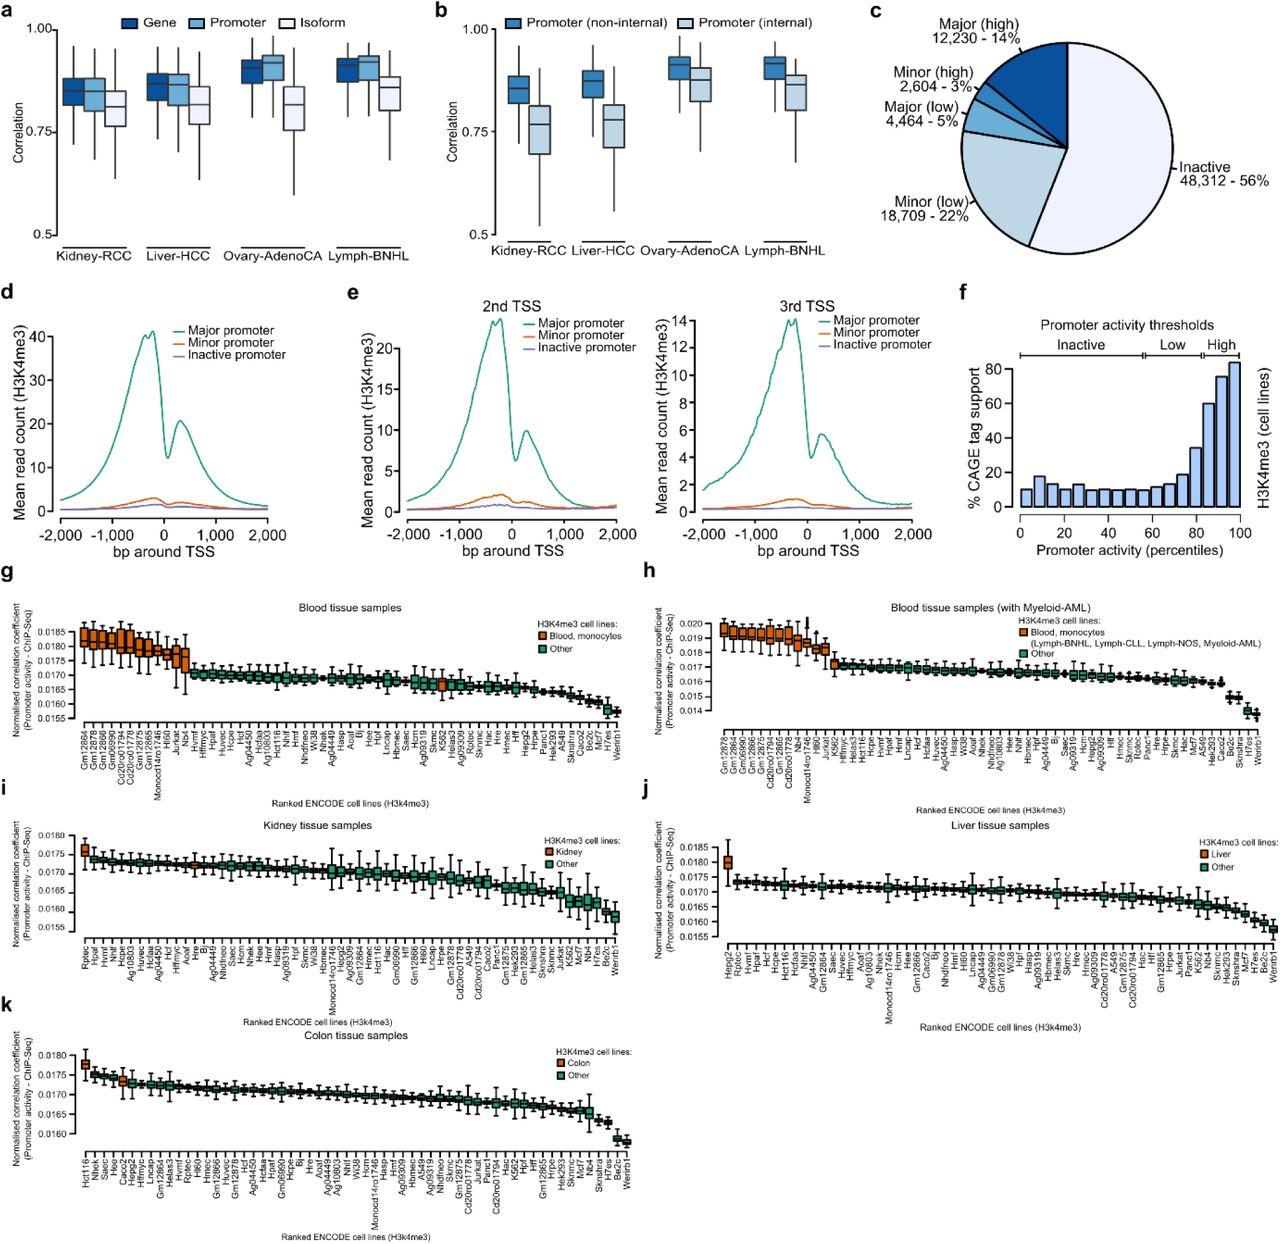
RNA-Seq data can be used to identify active promoters. (a) Correlation of expression estimates across samples of the same tumor type for genes (dark blue), active promoters (blue), and isoforms of multi isoform genes (light blue). The correlations are shown for the tumor types with more than 100 samples. A higher correlation of promoter activity estimates suggest a higher level of robustness compared to isoform estimates. (b) Correlation of activity for promoters that overlap internal exons (light blue), and promoters that do not overlap internal exons (blue) across the sample pairs of the same tumor type. (c) Overview of major (highly expressed), major (lowly expressed), minor (highly expressed), minor (lowly expressed) and inactive promoters across the PCAWG data cohort, using a threshold of 0.5 for low expression, and a threshold of 2.5 to define high expression. (d, e) Mean H3K4me3 ChIP-Seq read count across 59 ENCODE cell lines for the pan-cancer major, minor, and inactive promoters. (d) All promoters. (e) Promoters at the 2nd and 3rd TSS positions. (f) Percentage CAGE tag support for inactive, low, and high activity promoters, shown are only promoters that overlap with internal exons. The CAGE tag support is lower compared to non-internal promoters. (g - k) Correlation of promoter activity estimations with H3K4me3 ChIP-Seq read counts from ENCODE cell lines for blood (g, h), kidney (i), liver (j), colon (k) tissues. Orange color denotes the matching cell lines in terms of tissue origin. Inclusion of the gray-listed Myeloid-AML samples into promoter activity estimates increases the similarity to the K562 cell line, which otherwise is different from the other cancers.

Alternative promoters display context specific regulation independent from the gene expression. (a) t-SNE plot using the top 1,500 genes with the highest variance in gene expression. (b) Difference in alternative promoter activities (upper panel) and gene expression excluding alternative promoters (lower panel) across pan-cancer. Alternative promoters’ contribution to tissue specificity is independent from gene expression. (c) Number of alternative promoters for each tumor type. (d) Shown is the percentage of times a change has occurred in the 5’UTR, 3’UTR, and CDS sequence that is unique to the alternative promoter (green), unique to the major promoter (orange), and that is shared (gray).

Identification of cancer-associated promoters. (a) Cancer samples from PCAWG match to normal samples from the same tissue (blue) regardless of data source (PCAWG or GTEx). Squamous cell carcinoma of the lung (Lung-SCC), and bladder cancer (Bladder-TCC) are assigned to skin reflecting the origin of cancer cell not the tissue. (b) Heatmap showing the normalized promoter activity estimates for liver cancer and normal samples, ranked by mean difference. (c) Difference in cancer-associated promoter activities (upper panel) and gene expression excluding alternative promoters (lower panel) for liver cancer and normal samples, ranking is similar to heatmap in (b). (d) Heatmap showing the normalized promoter activity estimates for blood cancer and normal samples, ranked by mean difference. (e) Difference in cancer-associated promoter activities (upper panel) and gene expression excluding alternative promoters (lower panel) for blood cancer and normal samples, ranking is similar to heatmap in (d). (f) Promoter activity and gene expression plots for the BID gene’s cancer associated promoter across liver cancer and normal samples. (g) Shown is the mean read count at the MLLT1 gene locus for kidney tumor samples and normal samples (bottom-left). The light blue regions highlight the cancer-associated promoters in kidney cancer samples. The cancer associated deactivation of prmtr.26519 can be seen in relative (bottom-middle) and absolute (bottom right) promoter activities across normal and cancer samples. (h) Kidney cancer associated promoters display tumor type specific. (i) Shown is the mean read count for the MTCP1 gene’s promoter that displays kidney cancer tumor type specific regulation. The first promoter (prmtr.73965) is only active in Kidney-RCC but not in Kidney-ChRCC tumors. (j, k) Shown is the percentage change in occurrence (j) and length (k) of the 5’UTR, 3’UTR, and CDS sequence that is unique to the cancer associated promoter (green), unique to the major promoter (blue), and that is shared (gray).

Overview of noncoding promoter mutations across different tumor types. (a) Genes ranked by the enrichment of noncoding mutations at promoters in lymphoma (Lymph-BNHL) compared to other cancer types. (b) Genes ranked by the enrichment of noncoding mutations at active promoters in lymphoma (Lymph-BNHL) compared to other cancer types. (c) Filtering out promoters with low activity increases the enrichment of cancer census genes identified by ranking promoters based on occurrence of mutations. (d) Association of relative promoter activity with noncoding promoter mutations across Lymph-BNHL tumor samples. The orange denotes the significant associations whereas * marks promoters of genes that have driver mutations.
ACKNOWLEDGEMENT
This work is funded by the Agency for Science, Technology and Research (A*STAR), Singapore. The Genotype-Tissue Expression (GTEx) Project was supported by the Common Fund of the Office of the Director of the National Institutes of Health, and by NCI, NHGRI, NHLBI, NIDA, NIMH, and NINDS. The data used for the analyses described in this manuscript were obtained from the dbGaP accession number phs000424.v6.p1 on 04/09/2015.
Footnotes
Contact: tanbop{at}gis.a-star.edu.sg, gokej{at}gis.a-star.edu.sg
REFERENCES


