

Abstract
Selection alters human genetic variation, but the evolutionary mechanisms shaping complex traits and the extent of selection’s impact on polygenic trait evolution remain largely unknown. Here, we develop a novel polygenic selection inference method (Polygenic Ancestral Selection Test Encompassing Linkage, or PASTEL) relying on GWAS summary data from a single population. We use model-based simulations of complex traits that incorporate human demography, stabilizing selection, and polygenic adaptation to show how shifts in the fitness landscape generate distinct signals in GWAS summary data. Our test retains power for relatively ancient selection events and controls for potential confounding from linkage disequilibrium. We apply PASTEL to nine complex traits, and find evidence for selection acting on five of them (height, BMI, schizophrenia, Crohn’s disease, and educational attainment). This study provides evidence that selection modulates the relationship between frequency and effect size of trait-altering alleles for a wide range of traits, and provides a flexible framework for future investigations of selection on complex traits using GWAS data.
Introduction
Natural selection shapes patterns of genetic variation within and between human populations, but the phenotypic targets of selection and the evolutionary mechanisms shaping causal variation for selected traits remain largely unknown. Most studies of selection in humans have focused on classic selective sweeps [1–5], but other selection mechanisms such as stabilizing selection [6], polygenic adaptation [7, 8], and soft sweeps [9] may also play an important role in shaping human diversity. Methods to detect selection under these more complex models are needed if we are to fulfill the promise of genomics to explain the evolutionary mechanisms driving the distribution of heritable traits in human populations [10].
With the recent proliferation of paired genotype and phenotype data from large human cohorts, it is now feasible to develop and implement statistical tests for polygenic selection in humans. Recently, studies have proposed methods to detect polygenic selection that capitalize on these rich datasets, and have begun to uncover evidence that selection acts on complex traits. Two studies proposed empirical methods that test for an excess of allele frequency differentiation at trait-associated loci [7,11], and showed that selection may have driven increases in the height of northern Europeans. This approach was later extended to a model-based framework that also incorporated environmental variables and was applied to several phenotypes in diverse human populations, providing additional evidence for selection on height and identifying a strong selection signal for skin pigmentation [8]. Recently, a novel haplotype-length-based statistic was introduced [12], and used to provide evidence that selection has acted on several complex traits on very recent timescales, and another study measured the correlation between effect sizes and allele frequencies to provide evidence for selection acting on height and body mass index (BMI) [13].
While these studies provide strong evidence that polygenic selection is an important determinant of human genetic and phenotypic variation for some traits, important questions remain about the evolutionary mechanisms that drive complex trait variation. In particular, most previous studies of selection on human complex traits have focused either on polygenic adaptation [7, 8, 12, 14, 15] or stabilizing selection [13, 16, 17], and have ignored the interplay between the two. In stabilizing selection models, all trait-altering alleles are deleterious [6, 18], regardless of their direction of effect, while a common assumption of polygenic adaptation models is that a selection pressure towards increased trait values will induce all trait-increasing alleles to be advantageous [7, 8]. A more natural way to model polygenic adaptation is to view stabilizing selection as a null process, with punctuated changes in the fittest trait value (herein called the “optimal trait value” or “trait optimum”) driving brief periods of adaptation [19]. This modeling framework leads to different predictions about the dynamics of polygenic selection after a subtle change in the trait value, because trait-increasing are not generically fitness-increasing after a shift to a higher optimal phenotype value. While models that jointly consider stabilizing and adaptive evolution have received theoretical attention [19, 20], there have been few attempts to use the predictions of these models in empirical research. Hence, we posited that improved integration of our understanding of stabilizing selection and polygenic adaptation may provide new insights into the action of selection on complex traits, and perhaps generate evidence for more subtle evolutionary shifts in the fitness landscapes of complex traits.
In addition to these potential avenues for new conceptual insights, existing methods for polygenic selection detection have some technical limitations. Methods that use the correlation between effect sizes and allele frequencies achieve their greatest power to detect selection when including rare alleles, but accounting for cryptic confounders is often most difficult for low frequency variants [21]. Moreover, a fundamental assumption of fitting a linear model that relates frequencies to effect sizes is that each observed effect size is independent. Since linkage disequilibrium (LD) drives correlations in effect size between alleles of varying frequencies, this assumption is violated in human genetic data, which is likely to elevate the false positive rate for this test. Methods relying on a signal of differentiation between populations [7, 8, 11] can only be applied when multiple populations are available and are useful for detecting recent selection that has occurred post-divergence. When the populations of interest are very recently diverged or data from only a few populations are available, methods of this style may suffer from decreases in statistical power [22]. A state-of-the-art haplotype-based method [12] can be applied within a single population, but requires whole-genome sequencing data and is tuned to detect even more recent selection events. The constraints of these methods may have restricted our understanding of selection on complex traits to very recent time-scales, and perhaps limited our ability to detect subtle selection signals.
Here, we develop a novel and efficient statistical test for the action of selection on complex traits that uses only GWAS summary data and LD information as input. Our method requires estimated effect sizes from only a single population, maintains power when considering only common alleles, and relies on effect size differentiation at derived as compared to ancestral alleles. We use model-based simulations that account for human demography, stabilizing selection, polygenic adaptation, and asymmetric mutation rates for trait-increasing and -decreasing alleles to motivate our method and show that signals of weak polygenic adaptation can persist over relatively long evolutionary times. We then develop empirical tools to control for possible confounding by LD. We apply our method to GWAS summary data for nine phenotypes, and find strong evidence for selection acting on five of them (height, BMI, Crohn’s disease, schizophrenia, and educational attainment), and show that four of these signals are suggestive of evolutionary shifts in the fitness landscapes of the traits. We discuss the implications of our findings for human evolutionary history and GWAS of biomedically relevant traits.
Results
Quantitative trait model
We develop a polygenic selection quantitative trait model that maps selection coefficients s to effect sizes β. We suppose that stabilizing selection acts on a trait, and that the fittest value of the trait is ϕo (also referred to as the “trait optimum”), such that the fitness f of an individual with trait value ϕ is given by
 where w is the standard deviation of the fitness function. We additionally suppose that the trait ϕ has a normal distribution such that
 where σ is the breadth of the fitness distribution and ϕ̅ is the mean trait value in the population. Under these conditions, it is possible to solve for the per-generation, per-individual selection coefficient s as a function of the above model parameters for causal alleles of effect size β. We calculate s by marginalizing the fitness effect of a new mutation of effect size β across all fitness backgrounds. While the full expression for s is provided in the Supplementary Materials, we note that when the trait is at equilibrium such that ϕo = ϕ̅,
 which implies that β ∝ |s|1/2. Hence, our model can be directly related to the widely used model of Eyre-Walker [6], which maps selection coefficients to effect sizes β as β ∝ |s|τ. Our model is approximately equivalent when τ = 1/2. In both models, when the trait distribution is at equilibrium, the magnitude of effect sizes is a monotonic increasing function of selection coefficient. However, unlike Eyre-Walker’s model, our model naturally accommodates shifts the trait optimum because the full expression for s is written as a function of the current optimal value of the trait and the current distribution of the phenotype in the population, which makes it straightforward to link the action of stabilizing selection (which dominates the selection process when the trait distribution is centered at the optimum ϕo) to that of transient polygenic adaptation (which dominates when the trait distribution is not centered at ϕo). Moreover, our model provides a mechanistic link between β and s by explicitly stating the shape of the fitness function that acts on ϕ, given by f(ϕ).
In addition to our selection model, we impose a mutation model in which the rates of trait-increasing and -decreasing alleles are not necessarily equal. This aspect of our model captures the biological reality that there may not be exactly equal proportions of fixed sites in the human genome that can either increase or decrease a phenotype. For example, if selection has persistently driven a particular phenotype to larger values, we might expect that fixed sites tend to confer larger phenotype values, and recurrent mutations at these sites will then tend to be trait-decreasing.
Under our model, immediately after a shift in optimum, a portion of the causal sites will increase fitness (specifically, the sites that are on average fitness-increasing when marginalizing across all phenotype backgrounds), while the remainder of causal alleles will be fitness-decreasing. The population mean will evolve to move closer to the optimum and eventually equilibrate to the new optimal phenotype value, at which point all trait-altering variable sites will again be fitness-decreasing. Fig. 1A&B provide an illustration of effect of a causal allele on fitness and the impact of a shift in the fitness optimum on the distribution of fitness effects, while a mathematical description of the model is provided in the Supplementary Materials.

Panels A-B are schematics of our trait model, while C-E show simulation results. A: fitness impact of a β = 1 mutation. At equilibrium, the trait distribution P (ϕ) is symmetric about the optimal value of the phenotype, ϕ = 0. Individuals with ϕ < –1/2 would increase in fitness (f(ϕ + 1) > f(ϕ), shaded dark gray) given a mutation with β = 1, while all others decrease in fitness. B: schematic of the relationship between effect size and selection coefficient. At time t = ts the optimal trait value ϕo increases, and trait-decreasing alleles have decreased fitness while trait-increasing alleles have increased fitness. Still, only trait-increasing alleles of small effect are on average fitness-increasing (inset). C: ϕo is plotted as a dashed line in black, magenta, blue, and green. ϕo changes by 20% relative to the standard deviation (σ) of ϕ coincident with out-of-Africa (green, ts = –97000) and founding of Europe (blue, ts = –22000), in the ancestral African population (magenta, ts = –322000), or remains unchanged (black, ts = –∞). The demographic model is in gray (not to scale). The solid black, magenta, green, and blue curves correspond to the observed mean of ϕ, which rapidly approaches ϕo. D: β̅ as a function of derived allele frequency (DAF). E: Sβ (0, x) as a function of DAF. D and E are on a log scale on the x-axis.
A novel polygenic selection statistic
Stabilizing selection on a quantitative trait constrains large effect alleles to low frequencies [6, 23, 24]. Polygenic adaptation, which drives shifts in causal allele frequency depending on both frequency and effect size [8], will also induce mean effect size to vary as a function of allele frequency. Here, we propose a test statistic that captures signals of both relatively ancient polygenic adaptation and long-term stabilizing selection. Our statistic, Sβ, detects mismatches in mean effect size (denoted β̅) between ancestral (i.e., the allele that was present in the ancestral population) and derived alleles (i.e., the mutant allele) of equal minor allele frequency (MAF). Ancestral and derived alleles of the same MAF have dramatically different mean ages [25, 26] – since selection purges large effect alleles rapidly, it will drive the mean effect size of ancestral and derived alleles of equal MAF to be different. Under a neutral model of trait evolution, we expect no such relationship between effect size and frequency. Sβ also lends itself to a natural permutation test for significance, and can differentiate between stabilizing selection and polygenic adaptation.
Sβ is defined as the sum of the mean difference in effect size between derived and ancestral alleles of equal frequency.
 where β̅D (x) is the mean effect size of derived alleles with minor allele frequency x and β̅A(x) is the mean effect size for ancestral alleles. We group alleles into 1% frequency bins such that xi and xf are elements of (0, 0.01, 0.02, …, 1.0). Selection drives β̅D (x) – β̅A(x) to differ from 0, and the sum Sβ (xi, xf) then captures the cumulative deviation from 0. Herein, we refer to this statistic as Sβ unless we are specifically indicating the frequency cutoff for a particular calculation. In the next section, we use simulations to show that stabilizing selection and polygenic adaptation can be captured with Sβ, and subsequently we develop a permutation-based method that accounts for LD to calculate the significance of the deviation of Sβ from 0.
Sβ is sensitive to recent and ancient selection
We performed forward simulations of genotypes and phenotypes under a model of European demographic history [27] while incorporating selection on complex traits [6]. We used a weak selection coefficient distribution that was inferred for human conserved noncoding sequences [28], such that the selection coefficients are consistent with patterns of diversity observed in human functional regions. The demographic model is shown in gray in Fig. 1C. We set σ = .02 (the standard deviation of the trait) and w = 0.06 (the breadth of the fitness function), such that the fitness function is much broader than the trait (i.e., fitness declines only gradually in distance from the trait optimum ϕo). In addition to population genetic parameters, our simulations include ancestral misassignment. We supposed that 10% of sites were assigned incorrect ancestral/derived status for these simulations, and include a thorough investigation of the impact of ancestral state uncertainty and a more detailed description of our simulations in the Supplementary Materials.
We considered four models of selection, first a stabilizing selection model in which the optimal value of the phenotype is unchanged throughout human evolutionary history predating the out-of-Africa event (black line, Fig. 1C), second a polygenic adaptation model in which the optimal trait value ϕo increases by 20% relative to the standard deviation of the trait (σ) in the African ancestral population (magenta line, Fig. 1C), third a polygenic adaptation model in which the optimal value increases by 20% at the out-of-Africa event (green line, Fig. 1C), and lastly a model in which a 20% increase in the optimal value occurs at the time of the second bottleneck in the European population (blue line, Fig. 1C). Throughout this section, simulation results represent the mean across 3,000 independent simulations of selection on a polygenic trait. The dashed lines show the optimal value as a function of time, while the solid lines show the mean observed phenotype value in the population. For this set of simulations, we choose the mutation rate of trait-decreasing alleles to be greater than that of trait-increasing alleles (51.5% of mutations are trait-decreasing) because this set of parameters produces patterns that are qualitatively similar to human height data, but note that the value of Sβ depends on the full suite of population genetic parameters (including mutation rate bias, selection strength, and polygenicity) and can be positive or negative. In the Supplementary Materials, we additionally consider a model with equal trait-increasing and -decreasing mutation rates and show that the results are similar. After a change in the optimal value, the population rapidly adapts to the new environmental conditions (magenta, blue, and green curves, Fig. 1C), similar to the predictions made by other models of quantitative trait evolution [19].
In Fig. 1D, we plot the mean value of the effect size β̅ as a function of derived allele frequency at the end of the simulation time-course (i.e., t = 0) for each of the selection models. When the trait evolves neutrally, or there is long-term stabilizing selection but no difference in the mutation rates of trait-increasing and trait-decreasing alleles, β̅ is expected to be 0 in all allele frequency bins (dashed black line). Note that differences in the mutation rate of trait-increasing and -decreasing alleles in the absence of selection will translate the null either upwards (if trait-increasing alleles are more common) or downwards (if trait-decreasing alleles are more common), but will not induce effect size to vary with frequency.
If stabilizing selection acts on the trait and mutation rate differs between trait-decreasing and trait-increasing alleles, β̅ is negative or very near 0, and increases towards 0 with increasing allele frequency (black lines and points). Shifts in the phenotype optimum to a larger value drive β̅ to be positive for all but the rarest alleles (magenta, green, and blue lines and points). A recent shift in optimum (in blue) drives a sharp departure from the no-shift model (in black), while a more ancient shift will slowly relax back to the no-shift model (green, magenta) and hence is less differentiated from the no-shift case. Still, with this human-relevant distribution of selection coefficients, even a relatively ancient and modest 20% shift in the optimal phenotype value induces a departure from the stabilizing selection model.
In Fig. 1E, we calculate the value of Sβ (0, x), i.e. the cumulative value of the test statistic as a function of allele frequency x. When no shift in phenotype optimum occurs, mutation rate is biased towards trait-decreasing alleles, and stabilizing selection acts on the trait, Sβ (0, x) is always negative and departs from the null (i.e., 0 – note that if the mutation rates are not biased then stabilizing selection does not depart from the null as in Fig. S4). When there is an ancient change in phenotype optimum to a larger value, the value of Sβ (0, x) is strongly positive for all but the lowest allele frequencies. Note that the direction of the departure of Sβ (0, x) from 0 under models of selection depends on both the mutation and phenotype optimum parameters – if selection is stabilizing and there is a bias in mutation rate towards trait-decreasing alleles, mean Sβ (0, x) will be negative or very close to 0 at all frequencies, whereas the opposite is true for a bias towards trait-increasing alleles. A shift towards a larger optimum value of the trait will cause trait-increasing alleles of weak effect to transiently increase in frequency and hence will generally increase the value of Sβ, whereas a shift towards a lower optimum will decrease the value of Sβ.
We further investigated Sβ by comparing it to the correlation coefficient ρ between MAF and β, which was previously used to infer the action of selection [13], and is among the very few published methods used to infer selection on complex traits using only GWAS summary data from a single population (Fig. 2). For this set of simulations, in which we supposed no mutational bias and a 50% shift in ϕo relative to σ, ρ is centered near zero and broadly distributed for all but the most recent selection events, and hence has little power to capture relatively ancient polygenic adaptation, while Sβ is strongly differentiated from the null even when polygenic adaptation is relatively ancient and relatively modest in magnitude. In Fig. S4, we show that these results hold qualitatively for a more modest 20% shift in ϕo.

A comparison between the correlation coefficient (ρ) and our selection summary statistic (Sβ), computed on all variants (A & C) or only common variants with frequencies greater than 5% (B & D). The points represent the mean over 1,000 simulations, while the bars represent the standard deviation. For each data point, a shift of 50% in the optimal phenotype value occurs at the corresponding time on the x-axis. The neutral null is plotted as a horizontal dashed line.
PASTEL: A permutation-based test for selection
Under the neutral null model, Sβ is expected to be 0. If every site in the genome were independent, then we could additionally model the variance of Sβ by supposing that causal alleles are drawn from some distribution of known form and summing across the variance induced by each individual marker. Unfortunately, the variance is not straightforward to calculate because it depends on both the distribution of frequencies of putatively causal GWAS alleles (which depends on SNP ascertainment and evolutionary forces such as selection and demography), as well as LD between sites. To test for a significant departure of Sβ from 0, we therefore develop a permutation-based method that accounts for LD and uneven sampling of allele frequencies. Since causal alleles are linked to non-causal alleles in the human genome, a test that does not account for LD will under-estimate the variance in Sβ under the neutral null, and will be anti-conservative.
To account for LD, we divide the genome into 1,703 LD blocks, which were previously identified as being approximately independent [29]. For each LD block, we then select a random sign (positive or negative with equal probability), and multiply all the effect sizes in the LD block by this sign. We then recompute Sβ on the randomized data. By repeating this procedure, we generate a null distribution for our test statistic Sβ. This method maintains the correlations between effect sizes generated by LD, the site frequency spectrum of the sampled alleles, and the joint distribution of the absolute value of effect size and allele frequency, while breaking any relationship between β̅ and allele frequency. Note that this is a conservative permutation, because many of the alleles within an LD block are not linked or only weakly linked. We further consider the robustness of our method to population stratification in a subsequent section, which is a persistent potential source of false positives for studies of selection.
To assess significance, we perform a two-tailed test comparing the observed value of Sβ to the permutation-based null distribution. We name this test PASTEL, or the Polygenic Ancestral Selection Test Encompassing Linkage.
Signals of selection on human height
Human height has been the focus of numerous selection studies from both anthropological [30–33] and genetic [7,8,34] perspectives, and evidence from both of these fields strongly supports the hypothesis that height is a selected trait. Hence, we begin our data analysis by applying our method to human height GWAS summary data from the GIANT consortium [35], which we take as a positive control to validate our method.
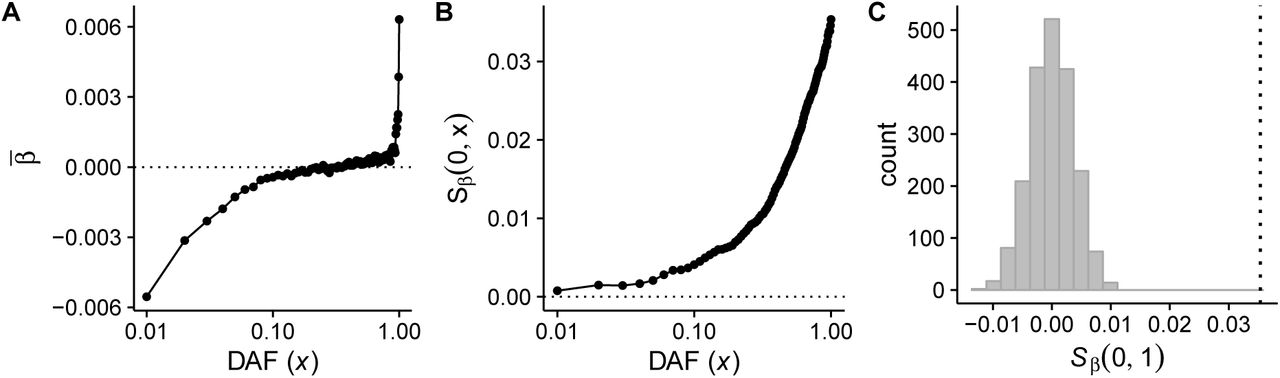
In Fig. 3A, we plot the mean value of β as a function of allele count x in the GIANT data. Note that we have binned alleles by frequency into 100 distinct bins, and the GWAS sample size is much larger than 100. β̅ is strongly negative for low frequency alleles and increases steadily to a positive value for moderate and high frequency alleles. In the Supplementary Materials, we show that the sharp upward trend in β̅ at very high derived allele counts is likely to be driven by ancestral state uncertainty, and show that this decreases our power but otherwise does not affect our test.

In A, we plot the mean value of β as a function of derived allele frequency x for GWAS summary data from the GIANT project for the height phenotype. In B, we plot Sβ (0, x) for the same data. C is the neutral null distribution of Sβ (0, 1) obtained by permutations, and the vertical dashed line indicates the observed value of Sβ (0, 1) in the GIANT height data.
In Fig. 3B, we plot Sβ (0, x) for all alleles with effect size estimates in the study [35]. We observe that Sβ (0, x) is an increasing function of x, in qualitative agreement with the simulation data in Fig. 1D. Lastly, in Fig. 3C, we present the results of LD-preserving permutations of derived and ancestral states with PASTEL. For each of our 2 × 10³ permutations of derived/ancestral states, we calculated Sβ (0, 1) to generate a null distribution for our test statistic. We plot a histogram of this null distribution, while the dashed vertical line represents the observed value of Sβ (0, 1) in the height summary data. This observed value falls outside the histogram, indicating that the p-value for the test is < 0.0005.
Evidence for selection on human complex traits
We selected 8 additional phenotypes with GWAS summary data available on which to perform our statistical test for selection on complex traits. We prioritized phenotypes with large sample sizes and a large number of GWAS hits, while additionally selecting a wide variety of traits that include body size [35–37], psychiatric conditions [38], immune-related traits [39], reproductive traits [40], cardiovascular traits [41], and correlates of intelligence [42].
Tab. 1 lists the test statistic value and PASTEL-based p-value for each of the phenotypes. We calculated Sβ both for all variants and for common variants only (MAF > 1% and MAF > 5%). We include the common variant test because ancestral mispolarization has a stronger effect on rare alleles (Fig. S6), and as we show in the Supplementary Materials, incorrect ancestral assignment can decrease the power of our test. Moreover, population structure could potentially confound selection signals at very low frequency (see next section). The full data that correspond to the summary statistics and permutations are plotted in Figs. S7-S15.
Test-statistics and p-values corresponding to GWAS for nine phenotypes that we hypothesized may be under selection. The first and second columns include all alleles, while the third and fourth columns include only alleles that have MAF > 1%, and the final two columns include only alleles with MAF > 5%. Tests that pass a multiple testing correction are bolded. BMI: body mass index, WHR-BMI: waist-hip ration adjusted for body mass index, GLL: global lipid levels
After correcting for multiple testing for nine tests (one for each phenotype), we reject the neutral null for Crohn’s disease, educational attainment, BMI, height, and schizophrenia, but not BMI-adjusted waist-hip-ratio, global lipid levels, depression, or menopause onset. Three of the statistically significant test statistics are negative (BMI, Crohn’s disease, and schizophrenia), which is consistent with models of stabilizing selection where the mutation rate of trait-decreasing alleles exceeds that of trait-increasing alleles, but is also consistent with models in which the trait optimum has moved to a lower value in the species’ evolutionary past. However, for both Crohn’s disease (Fig. S10) and BMI (Fig. S8), β̅ is positive at low frequency and negative at high frequency, a pattern which we only observed in simulations that included a decrease in the optimal phenotype value. Similarly, height (Fig. S7) and educational attainment (Fig. S9) have positive values of Sβ, and negative β̅ at low frequency and positive β̅ at high frequency, a pattern that we only observed in simulations including an evolutionary shift to higher optimal phenotype values.
Potential confounding by population structure
As with nearly all tests for polygenic selection (e.g., [7, 8]), population structure could confound our results. In particular, if a GWAS sample is composed of individuals from two or more populations, and derived alleles have systematically higher frequencies in some populations than others, we might expect that β̅ is systematically biased and correlated with allele frequency.
While it is very challenging to control for population structure at low frequencies [21], population structure in high frequency alleles has been studied very widely and is very well-controlled with PCA-based methods, which use the PCs as covariates. Each of the GWAS for which we obtained summary data included such a control, and we therefore expect that population structure is very well-controlled for high frequency alleles in each of these studies. We therefore ran our test excluding rare alleles with MAF under 1%, and we additionally perform a very conservative test excluding all alleles below 5% (see Tab. 1). We find that the selection signals are very robust when including only common alleles for three of the phenotypes (height, BMI, and educational attainment). The signal for schizophrenia is slightly stronger when excluding rare alleles (MAF < 1%), but is somewhat diminished when considering only alleles above 5%. The signal for Crohn’s disease becomes somewhat weaker as we increase the allele frequency threshold, indicating that rare alleles at least partially drive the signal for Crohn’s – however, all p-values for Crohn’s were nominally significant at the p < 0.05 level. We conclude that our test retains power even when excluding rare alleles for sufficiently strongly selected phenotypes, and that the putative selection signals discovered herein are unlikely to be driven by population structure.
Discussion
Many studies have suggested that selection shapes human genetic variation [5], and it has long been theorized that it drives the variance in a broad range of human complex phenotypes [4]. Here, we developed a novel test (PASTEL) for polygenic selection that can be applied to GWAS summary data for a single population, can capture relatively ancient selection events, and retains power when applied only to common alleles, for which it is more straightforward to correct for population stratification. We applied our test to GWAS summary data for nine phenotypes, and showed that five of them (educational attainment, height, Crohn’s disease, BMI, and schizophrenia) strongly suggest a role for selection in shaping trait variation. It has been previously suggested that height [7, 8, 11, 13] and BMI are under selection [13], but studies have reported both polygenic adaptation and widespread negative selection as possible selection mechanisms. Our results are consistent with a shift towards higher optimal fitness values of educational attainment and height, but lower optimal fitness values for BMI and Crohn’s disease risk, suggesting that long-term stabilizing selection on these traits has been punctuated with periods of polygenic adaptation.
If selection acts on biomedically relevant complex traits in humans such as Crohn’s disease and schizophrenia, there are strong implications for the future of both medical and evolutionary genomics. In medical genomics, an ongoing debate about the genomic architecture of complex diseases is at the forefront of the field [43]. When strong selection acts on complex traits, it can elevate the role of rare alleles in driving trait variance [44]. If rare alleles contribute a larger fraction of the genetic variance than is expected under neutral models, then very large GWAS that use only array-based genotyping information are very unlikely to be able to capture these signals, and sequence-based studies and powerful rare variant approaches that are robust to evolutionary forces (including those not investigated here, such as partial recessivity) will be needed [23, 24]. Moreover, recent work has suggested that the over-representation of Europeans in GWAS has limited the effectiveness of estimating polygenic risk scores in other human populations [45]. This is a serious problem for the transfer of genomic research into the clinic, where precision medicine initiatives relying on personal genetic information will only be successful if genetic risk can be accurately inferred in diverse populations. While this effect has been attributed to neutral demographic forces, if selection has driven numerous phenotypes to acclimate to local environmental conditions in ancestral human populations worldwide it could exacerbate this problem dramatically.
In the field of evolutionary genomics, most studies have agreed that the impact of selection is widespread on the human genome, but the evolutionary mechanisms that drive genetic and phenotypic diversity have been widely debated [4, 5]. In our study, we showed that the selection signals for BMI and Crohn’s disease are consistent with a bias in mutation rate towards trait-increasing alleles, and a shift to a lower optimal value of the trait, while height and educational attainment are consistent with a mutational bias towards trait-increasing alleles and a shift towards higher values of the trait optimum. The signal for schizophrenia is consistent with both models of an ancestral shift towards a lower optimum and a stabilizing selection only model in which there is a mutational bias towards trait-decreasing alleles. In general, we propose that it is likely for most selected traits that there are unequal numbers of trait-increasing and trait-decreasing sites that can be mutated genome-wide. If past selection events have pushed a selected trait (e.g., height) to ever higher values, then we expect a majority of fixed height-altering sites to be height-increasing. Recurrent mutations at these sites would then tend to be height-decreasing. Incorporating mutational bias into our model allowed us to then distinguish between signals of stabilizing selection alone, or evolutionary shifts in trait optima. However, we note that other models, for example those with no mutational bias and multiple evolutionary shifts in the trait optimum, could also generate qualitatively similar signals.
Among the nine traits that we tested, we found that five had strong signals of polygenic selection. However, this does not imply that the other four are not under selection. The power of our test depends on the strength of selection, the polygenicity of the trait, the heritability of the trait, and the mutational bias. If a trait is under strong stabilizing selection, but the mutation rate of trait-increasing and -decreasing alleles is exactly equal, then our test has no power. Moreover, if selection is weak, a small number of causal alleles drive variance in the trait, or the trait is only weakly heritable, power is greatly diminished. However, increased sample sizes in GWAS will always increase our power, because the variance on effect size estimates for even weak effect causal alleles decreases dramatically with sample size. When the standard error on β̅ decreases, the power of our test will increase. Although we showed that population structure is unlikely to bias our results, uncorrected population structure is always a concern for tests of polygenic selection, and cannot be completely ruled out. An uncorrected bias in the inferred β values due to population structure will make our test anti-conservative. LD score regression on some of our phenotypes is consistent with a small amount of residual uncorrected population structure [46]. However, LD score regression assumes a specific relationship between allele frequencies and effect sizes, and inflation in the relevant test statistic can be driven by either selection or population structure [46].
One strength of our permutation-based approach is that other summary statistics, such as the absolute value of the deviation between ancestral and derived effect sizes, could also easily be applied. Since stabilizing selection strongly increases 𝔼[β2] at low frequency [23], it may prove fruitful to investigate this statistic. In future studies, it will be advantageous to apply other types of summary statistics and compare their relative power, and to use the information in such summary statistics to infer the evolutionary parameters of complex trait selection models such as the timing of shifts in the trait optima and the strength of selection.
Acknowledgments
The authors acknowledge the support of NIGMS grant K12GM088033 and the Stanford IRACDA program (LHU) and thank Noah Rosenberg for helpful comments on an early draft.
References


