

ABSTRACT
Background and aims DNA barcoding is emerging as a useful tool not only for species identification but for studying evolutionary and ecological processes. Although plant DNA barcodes do not always provide species-level resolution, the generation of large DNA barcode datasets can provide insights into the mechanisms underlying the generation of species diversity. Here, we use DNA barcoding to study evolutionary processes in taxonomically complex British Euphrasia, a group with multiple ploidy levels, frequent self- fertilization, young species divergence and widespread hybridisation.
Methods We sequenced the core plant barcoding loci, supplemented with additional nuclear and plastid loci, in representatives of all 19 British Euphrasia species. We analyse these data in a population genetic and phylogenetic framework. We then date the divergence of haplotypes in a global Euphrasia dataset using a time-calibrated Bayesian approach implemented in BEAST.
Key results No Euphrasia species has a consistent diagnostic haplotype. Instead, haplotypes are either widespread across species, or are population specific. Nuclear genetic variation is strongly partitioned by ploidy levels, with diploid and tetraploid British Euphrasia possessing deeply divergent ITS haplotypes (DXY = 5.1%), with haplotype divergence corresponding to the late Miocene. In contrast, plastid data show no clear division by ploidy, and instead reveal weakly supported geographic patterns.
Conclusions Using standard DNA barcoding loci for species identification in Euphrasia will be unsuccessful. However, these loci provide key insights into the maintenance of genetic variation, with divergence of diploids and tetraploids suggesting that ploidy differences act as a barrier to gene exchange in British Euphrasia, with rampant hybridisation within ploidy levels. The scarcity of shared diploid-tetraploid ITS haplotypes supports the polyploids being allotetraploid in origin. Overall, these results show that even when lacking species-level resolution, DNA barcoding can reveal insightful evolutionary patterns in taxonomically complex genera.
INTRODUCTION
DNA barcoding is a valuable tool for discriminating among species, and these data often give insights into identity that are overlooked based on morphology alone (Hebert and Gregory, 2005). Plant DNA barcoding has been used for species discovery, reconstructing historical vegetation types from frozen sediments, surveying environmental variation, and many other research topics (reviewed in Hollingsworth et al., 2016). Despite the extensive uptake of DNA barcoding, there are numerous reports of taxon groups where DNA barcodes do not provide exact plant species identification, and where DNA barcode sequences are shared among related species (Percy et al., 2014, Yan et al., 2015a, Yan et al., 2015b, Spooner, 2009). Identifying the causes of why DNA barcoding ‘fails’ is essential to help guide the development of future DNA barcoding systems. If species discrimination is usually limited by information content of the core barcoding loci, then improvements can be made by extending the DNA barcode to harness variation across the whole plastid genome. In contrast, if limits to species discrimination are caused by hybridisation, incomplete lineage sorting, and polyploidy, then we may see no improvement with more plastid data, and future barcoding systems will need to target the nuclear genome, as well as use new analytical methods to cope with many independent loci (Coissac et al., 2016, Hollingsworth et al., 2016). As such, more genetic studies of complex taxa groups are required in order to identify the underlying evolutionary processes that can cause DNA barcoding to fail. In addition, the generation of large data sets of DNA sequence data from multiple individuals of multiple species in such groups also provide datasets that can shed light onto evolutionary relationships and evolutionary divergence, without a need for the barcode markers to track species boundaries.Postglacial species radiations of taxonomically complex groups in Northern Europe are a case where we may not expect a clear cut-off between intraspecific variation and interspecific divergence and thus DNA barcoding may provide limited discriminatory power. Despite this, DNA barcoding may still be valuable if used to identify evolutionary and ecological processes that result in shared sequence variation. For example, many postglacial taxa are characterised by a combination of: (1) recent postglacial speciation, (2) extensive hybridisation, (3) frequent self-fertilization, (4) divergence involving polyploidy. Our expectation is that factors 1 + 2 will cause DNA barcode sequences to be shared among geographically proximate taxa, while 3 will cause barcodes to be population rather than species-specific (Hollingsworth et al., 2011). Factor 4, polyploidy, will manifest as shared haplotypes between recent polyploids and their parental progenitors, or deep haplotype divergence in older polyploid groups, where ploidy act as a reproductive isolating barrier and allows congeneric taxa to accumulate genetic differences. Many of these interacting factors are common across taxonomically complex postglacial groups (Ennos, 2005), which include the Arabidopsis arenosa complex (Schmickl et al., 2012), Cerastium (Brysting et al., 2007), Epipactis (Squirrell et al., 2002) and Galium (Kolář et al., 2015). As such, the application of DNA barcoding to such groups will not only reveal the prevalence of haplotype sharing and the potential for species discrimination, but improve our understanding of processes underlying shared variation.
One example of a taxonomically challenging group showing postglacial divergence is British Euphrasia species. This group of 19 taxa are renowned for their difficult species identification, and at present only a handful of experts can identify these species in the field. Morphological species identification is difficult due to their small stature, combined with species being defined by a complex suite of overlapping characters (Yeo, 1978). They are also generalist hemiparasites and thus phenotypes are plastic and depend upon host quality (Svensson and Carlsson, 2004). DNA barcode-based identification could partly resolve these identification issues, and lead to a greater understanding of species diversity and distributions in this under-recorded group. This is particularly important as a number of Euphrasia species are critically rare and of conservation concern, while others are ecological specialists that are useful indicators of habitat type (French et al., 2008). More generally, DNA barcoding data could reveal the processes structuring genetic diversity and those that are responsible for recent speciation.
Previous broad-scale surveys of Euphrasia using AFLP and microsatellites have shown a significant proportion of genetic variation is partitioned by ploidy groups and by species, despite extensive hybridisation (French et al., 2008). Here, we follow-on from previous population genetic studies by testing the utility of DNA barcoding across British Euphrasia. Our first aim is to assess whether DNA barcoding is informative for species recognition in this young postglacial group. Our second aim is to understand the evolutionary factors that may explain patterns of shared DNA sequences. We first sequence British populations for the standard DNA barcoding loci, and analyse the distribution of haplotypes across populations and species. To better understand the historical context of haplotype sharing we sequence additional loci and use dated phylogenetic analyses to infer divergence ages. Overall, these results are used to understand the efficacy of genetic tools for studying species-level variation in a taxonomically complex group.
MATERIALS AND METHODS
Specimen sampling
The 19 currently recognised British Euphrasia species are all annuals, selfers or mixed- mating small herbaceous plants, which occur in a range of habitats including coastal turf, chalk downland, mountain ridges and heather moorland. The species can be divided into two groups, glabrous or short-eglandular hairy tetraploids (15 species, Fig 1A), or long glandular hairy diploids (4 species, Fig. 1B). Our sampling included representatives of all British species, with samples collected from across widespread populations (Fig. 1c, Table S1, [Supplementary Information]). Samples were collected in South West England and Wales to allow us to include mixed populations of diploids and tetraploids, early generation diploid x tetraploid hybrids, and two diploid hybrid species hypothesised to be derived from diploid x tetraploid crosses (E. vigursii, parentage: E. rostkoviana x E. micrantha), E. rivularis (parentage: E. anglica x E. micrantha; Yeo, 1956). Samples from Scotland allowed us to sample complex tetraploid taxa and tetraploid hybrids, plus scarcer Scottish diploids. Our sampling scheme investigated range-wide variation by targeting many taxa and populations, but without intrapopulation sampling. This is because prior work has shown low intrapopulation diversity, with populations frequently fixed for single haplotypes (French et al., 2008). All samples were identified by Euphrasia experts Alan Silverside or Chris Metherell.
Voucher information and population details of Euphrasia samples used in the study. Columns headed cpDNA and ITS 2 refer to the number of individuals sequenced for these regions.

Euphrasia samples used in this study. (A) Tetraploid British Euphrasia (here E. arctica) have glabrous leaves sometimes with sparse short eglandular hairs or bristles. (B) Diploid British Euphrasia have long glandular hairs. (C) Collection sites of Euphrasia DNA samples. Diploids are shown in red, tetraploids in blue. Orange boxes correspond to the three broad sampling areas.
For our population-level DNA barcoding study, we analysed a total of 133 individuals, with 106 samples representing 19 species, as well as 27 samples from 14 putative hybrids. We sequenced samples for the core plant DNA barcoding loci, matK and rbcL (Hollingsworth et al., 2009), as well as ITS2 (China Plant BOL Group, 2011), and supplemented these loci with rpl32-trnLUAG, which has been informative in prior population studies of Euphrasia (Stone, 2013).
For our broader molecular phylogenetic and molecular dating analysis, we expanded the sampling in the molecular phylogeny of the genus by Gussarova et al. (2008), to include a detailed sample of British taxa. The previous analysis included 40 taxa for the nuclear ribosomal internal transcribed spacer (ITS), and 50 taxa for plastid DNA (Gussarova et al., 2008). We sequenced samples to match the previous data matrix, which included: the trnL intron (Taberlet et al., 1991), intergenic spacers atpB-rbcL (Hodges and Arnold, 1994) and trnL-trnF (Taberlet et al., 1991), and ITS (White et al. 1990).
DNA extraction, PCR amplification, and sequencing
DNA was extracted from silica dried tissue using the DNeasy Plant Mini kit (Qiagen, Hilden, Germany) following the manufacturer's protocol, but with an extended incubation of 1 hour at 65 °C. These DNA samples were added to existing DNA extractions from 68 individuals from French et al. (2008).
PCRs were done in two laboratories following separate protocols. We applied the following conditions for most taxa. We performed PCRs in 10 μL reactions, with DNA amplification and PCR conditions for each primer given in Table S2 [Supplementary Information]. We visualised PCR products on a 1% agarose gel, with 5 μL of PCR product purified for sequencing with ExoSAP-IT (USB Corporation, Cleveland, OH, USA) using standard protocols. Sequencing was performed in 10 μL reactions containing 1.5 μL 5 × BigDye buffer (Life Technologies, Carlsbad, CA, USA), 0.88 μL BigDye enhancing buffer BD × 64 (MCLAB, San Francisco, CA, USA), 0.125 μL BigDye v3.1 (Life Technologies), 0.32 μM primer and 1 μM of purified PCR product. We sequenced PCR products on the ABI 3730 DNA Analyser (Applied Biosystems, Foster City, CA, USA) at Edinburgh Genomics. A subset of sequences were generated as part of the effort to DNA barcode the UK Flora, and followed a different set of protocols, detailed in de Vere et al. (2012). We assembled, edited and aligned sequences using Geneious v. 8 (Biomatters, Auckland, New Zealand), with manual editing. Indels were coded as unordered binary characters and appended to the matrices. We used gap coding as implemented in Gapcoder (Young and Healy, 2003), with indels treated as point mutations and equally weighted with other mutations.
PCR conditions and primer sequences for regions sequenced in this study.
Population genetic analyses of British samples
We examined patterns of sequence variation using a range of population genetic methods. We investigated the amount of sequence diversity in these recently diverging species using descriptive statistics, and then tested the cohesiveness of taxa using analysis of molecular variance (AMOVA) and related methods. Analyses were performed separately on ITS2 and a concatenated matrix of plastid data. For plastid data, haplotypes were determined from nucleotide substitutions and indels of the aligned sequences. Basic population genetic statistics were performed in Arlequin Version 3.0 (Excoffier and Lischer, 2010), and this included the number of haplotypes, as well as hierarchical AMOVA in groups according to:(1) ploidy levels (diploid vs tetraploid); (2) geographic regions (Wales, England, Scotland);(3) species. AMOVAs were performed on all taxa, and repeated for ploidy levels and geographic regions on a dataset only including confirmed species (i.e. excluding hybrids). Sequence diversity and divergence statistics were estimated with DnaSP (Librado and Rozas, 2009), which included: average nucleotide diversity across taxa (Pi), Watterson’s theta (per site), Tajima’s D and divergence between ploidy levels (DXY).
Genetic divergence among sampling localities were explored with Spatial Analysis of Molecular Variance (SAMOVA; Dupanloup et al., 2002), implemented in SPADS v.1.0 (Dellicour and Mardulyn, 2014). SAMOVA maximises the proportion of genetic variance due to differences among populations (FCT) for a given number of genetic clusters (K-value). We considered the best grouping to have the highest FCT value after 100 repetitions. This analysis investigated interspecific differentiation, thus only used species samples, excluding hybrids.
The relationships between haplotypes was inferred by constructing median-joining networks (MJM; Bandelt et al., 1999) with the program NETWORK v.4.6.1.1 (available at http://www.fluxus-engineering.com/), treating gaps as single evolutionary events.
Phylogenetic analyses and molecular dating
We used Bayesian phylogenetic analyses in MrBayes v. 3.1.2 (Huelesenbeck & Ronquist 2001) to infer species relationships and broad-scale patterns of colonisation. Our analyses used a sequence matrix that included our newly sampled British taxa in addition to previous global Euphrasia samples from Gussarova et al. (2008). We selected the best fitting model of nucleotide substitution using the Akaike Information Criterion (AIC) with an empirical correction for small sample sizes implemented in MrAIC (Nylander, 2004). Using GTR +G as the best model for the plastid dataset and SYM + G for the ITS dataset we ran two sets of four Markov Chain Monte Carlo (MCMC) runs for 5,000,000 generations. Indels were included as a separate partition with a restriction site (binary) model. We sampled every 1000th generation and used a burnin of 2,500,000, and default priors. We confirmed chain convergence by observing the average standard deviation of split frequencies and by plotting parameter values in Tracer v. 1.6 (Rambaut & Drummond 2013).
We used BEAST v. 1.8.2 (Drummond et al. 2012) to estimate the divergence ages of major Euphrasia lineages occurring in Britain. This analysis used our British samples in conjunction with the full global dataset of Euphrasia (Gussarova et al., 2008). Our analysis gives crude dates due to the lack of available fossils for calibration, but these estimates allow us to compare between very recent (postglacial) divergence, and much older divergence events. We only analysed ITS sequences, due to the lack of support obtained for the plastid phylogeny (see results). The analysis included two partitions: one containing all ITS sequences (638 bp) and the other containing 38 gap-coded indels. We applied the same substitution models as those used in the MrBayes analyses. For the binary characters, we used a stochastic Dollo model. Separate analyses were run testing for the strict vs the uncorrelated lognormal (UCLN) molecular clock. The branching was modelled using the Yule tree prior, which assumes a constant speciation rate per lineage. The root age was set with a normal prior of mean = 2.65×10⁷ and SD = 5×10⁵, according to the results obtained based on a calibrated phylogeny of Euphrasia by Gussarova et al. (2008). This prior analysis used geological dating of volcanic islands to set priors as maximum ages for colonization of endemic Euphrasia species. Substitution rate priors were based on Key et al. (2006), ranging from 0.38 ×10⁻⁹ to 8.34 ×10⁻⁹ substitutions/site/year. Data analyses were run for 50,000,000 generations, logging every 50,000th generation. We compared the fit of the clock models using AICM criterion implemented in Tracer. The AICM values obtained were very similar between the two models: 8723.681+/-0.685 vs. 8882.911+/-1.582. The strict clock was chosen as it is a simpler model and with lower AICM. These phylogenetic results were compared with those from an empty alignment using the same values for priors.
RESULTS
ITS haplotype diversity in British populations
The final ITS2 alignment contained 130 individuals representative of all British taxa, and was 380 bp in length. Only two samples (of E. scottica) presented double peaks, and were excluded from analysis. Overall diversity across taxa was modest, with a nucleotide diversity (Pi) of 2.3%, and theta (per site) of 0.01781. There were 33 nucleotide substitutions and one indel, from which we called 23 haplotypes. All sequences have been deposited in GenBank (Accession numbers given on acceptance).
The ITS haplotypes revealed strong partitioning by ploidy. Of the 23 haplotypes, three (H1, H20 and H21) were restricted to diploids, and 19 to tetraploids, with only one haplotype (H2) shared across ploidy levels (Table 1). Haplotype H2 was not only shared across ploidy levels but was also the most widespread haplotype, found in 67 samples across 34 populations. This included geographically distinct species such as the Scottish endemic E. marshallii and the predominantly English and Welsh E. anglica, and ecologically contrasting taxa such as the dry heathland specialist E. micrantha and the (currently unpublished) obligate coastal “E. fharaidensis” Overall, 86% of taxa had one of six widespread haplotypes. There were also a large number of rare haplotypes, with over two thirds restricted to a single population (17 haplotypes: H4, H7-H10, H12-H21 and H23; Table 1). The remaining haplotypes found in multiple populations (H1, H2, H3, H5, H6, H11) showed no clear pattern of geography, with three found in all geographic regions (England, Scotland, Wales) and the remaining three shared between two geographic regions. Similarly, patterns of haplotype sharing do not follow species boundaries. Of the eight species with multiple populations (excluding hybrids), none of them had diagnostic ITS haplotypes. Despite haplotype sharing across taxa,there was no evidence for this being due to non-neutral processes, as the value of Tajima’s D (-0.17) was not significantly different from zero.
The distribution of ITS2 haplotypes between species and geographic regions in British Euphrasia. Haplotype numbers correspond to the haplotype network Figure 2. Population specific haplotypes are aggregated under one column. n = number of samples.
The putative hybrid species, E. vigursii and E. rivularis, possessed ITS haplotype H1, which is common to other diploid taxa, or population specific haplotypes (H20, H21), but no tetraploid haplotypes. The two sampled diploid-tetraploid hybrids (E. arctica x rostkoviana,E. tetraquetra x vigursii) possessed the full range of haplotypes: haplotype H2, which is common across ploidy levels, tetraploid specific haplotype H3, and diploid specific haplotype H1. Most (9/12) tetraploid hybrid populations had haplotypes shared with their putative parents, while the other populations had unique haplotypes.
The highest FCT values in the SAMOVA were when K = 2 (Table S3 [Supplementary Information]), and this corresponded to the diploid-tetraploid divide described above. At K= 3, SAMOVA distinguished clusters corresponding to the two ploidy groups, and a third group of hybrid species derived from inter-ploidy level mating. AMOVA also supported the strong division by ploidy, with 88.2% of variation attributed to ploidy differences (Table 2; P< 0.001). A high proportion of variation was also partitioned by taxa (63.2%), and regions (25%), though this may be inflated by limited sampling within species.
Spatial analysis of molecular variation (SAMOVA) of ITS sequence data across British Euphrasia populations.
Hierarchical analysis of molecular variance (AMOVA) of British Euphrasia populations. Analyses performed between (A) species, (B) 3 geographic locations (Wales, South-West England, Scotland, (C) diploids and tetraploids. Number in parentheses are the results only including species (excluding hybrids). d.f. = Degrees of freedom. **P < 0.001;*P < 0.05.
Summary statistics and haplotype networks revealed substantial divergence between diploid and tetraploid haplotypes. An average of 18.3 site differences were found between diploids and tetraploids, with divergence measured as DXY = 0.051 (5.1%). The haplotype network revealed clusters corresponding to diploid and tetraploid haplotypes, separated by many mutations (Figure 2). The diploid cluster centres round haplotype H1, found in 15 individuals from 5 diploid species and one diploid-tetraploid hybrid. The only haplotype from this part of the network present in tetraploids is haplotype H18, found in a single sample of E. ostenfeldii. Within the tetraploid cluster, widespread haplotype H2 is at the centre, surrounded by other widespread haplotypes (H3, 8 populations, 12 samples; H6, 7 populations, 11 samples), and singleton haplotypes.
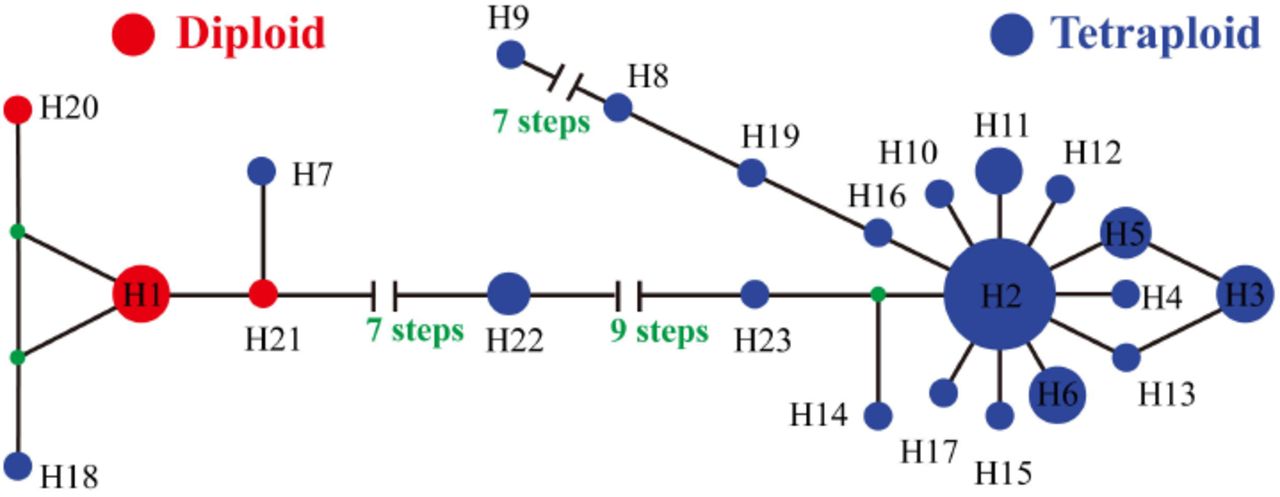
Median-joining network of ITS haplotype relationships in British Euphrasia. Numbers correspond to the ITS haplotypes in Table 1. Haplotypes are coloured by ploidy, with diploids in red and tetraploids in blue. Hypothetical (unsampled) haplotypes are represented by filled black circles.
ITS phylogeny and molecular dating
Our broad-scale global Euphrasia phylogenetic analyses performed using MrBayes gave meaningful clusters of species, though the tree topology was generally poorly supported with many polytomies (Fig. 3). Haplotypes occurring in Britain were predominantly found in two main clusters: a tetraploid clade of Holarctic taxa from Sect. Euphrasia (posterior probability support, pp = 1.00, Clade A, Fig. 3), and a well-supported geographically restricted Palearctic diploid lineage (pp = 1.0, Clade B, Fig. 3). The tetraploid clade included a mix of British and European taxa, and is sister to a mixed clade of alpine diploid species and tetraploid E. minima (Clade IVc, Fig. 3). The diploid clade includes British diploids E. anglica, E. rivularis, E. rostkoviana, E. vigursii and European relatives (diploids or taxa without chromosome counts). The only non-diploid in the clade is one individual of tetraploid British E. ostenfeldii, which appears to be correctly identified and thus may have captured the diploid ITS haplotype through historical hybridisation. Overall, terminal branches of the tree are short, indicative of limited variation between related haplotypes. The only exception was the long branch of E. disperma from New Zealand, a result seen in previous Bayesian analyses (cf. Gussarova et al., 2008, fig 2) but not in Parsimony analyses, where it clusters together with the other southern hemisphere species on a shorter branch (Gussarova et al., 2008).Molecular dating with BEAST yielded a similar tree topology to MrBayes (results not shown), with many nodes having a low posterior support values. The clade of tetraploids and alpine relatives had an estimated crown age of 2.2 Ma (95% HPD = 2.0 - 2.4 Ma, Fig. 3, Node 1). The median crown age of the major group of diploids (also including Nearctic endemics E. oakesii and E. randii) was estimated as 1.0 Ma (95% HPD = 0.7 – 1.4 Ma; pp = 1.00, Fig. 3, Node 2). Due to low support of internal branches, the age of the most recent common ancestor of the diploid and tetraploid lineages could not be inferred directly. The nearest dated node gaining support is the broader clade of Euphrasia, which includes the diploid and tetraploid groups, in addition to two additional clades that include divergent species of unknown ploidy such as E. insignis (Japan), which has a crown age of 8.0 Ma, 95% HPD = 6.5 – 9.8 Ma (Fig. 3, Node 3).

Majority rule consensus phylogeny of Euphrasia inferred from the ITS region using MrBayes. Posterior probabilities greater than 0.85 are indicated. Individuals are coloured by ploidy and geography: British diploids (red), British tetraploid (blue), other geographic areas (black). Green circled nodes have divergence dates estimated with BEAST, as given in the text. Clade A and Clade B correspond to the main study groups, with additional clades corresponding to Gussarova et al. (2008) also marked: II northern tetraploids; III Taiwan; IVa South American/Tasmanian; IVb complex (S. American, N. Zealand, Japan); IVc Alpine European.
Plastid haplotype diversity
Initial sequencing of rbcL in 48 samples revealed no polymorphism, and so no further sequencing was performed for this region and it was excluded from further analyses.The final matK alignment was 844 bp with one indel, and the rpl32-trnL region was 630 bp with nine indels. The final concatenated plastid alignment was 1474 bp for 130 samples, with 2.7% segregating sites (40 sites) across 38 haplotypes. Nucleotide diversity was exceptionally low with Pi = 0.3%, and theta (per site) was similarly low at 0.00381. Tajima’s D was not significantly different from zero (-0.27).
Similar to ITS, most plastid haplotypes were individual or population specific (63%, 24/38 haplotypes found in one population only), with only 4 haplotypes being widespread (H4: 15 populations, 24 samples; H5: 13 populations, 18 samples; H2: 11 populations, 16 samples;H1, 10 populations, 14 samples, Table S4 [Supplementary Information]). However, unlike ITS, plastid haplotypes revealed complex patterns unrelated to ploidy. Most widespread haplotypes were shared across ploidy levels. An AMOVA found a moderate degree of genetic diversity was partitioned by ploidy (18.7%) and species (26.5%), with these values being reduced when hybrids were included (Table 2 [Supplementary Information]).Despite geography explaining little of the variation across the total dataset (4.9%), or being evident in the SAMOVA (Table S5), localised haplotype sharing was apparent in Scottish tetraploids. For example, haplotype H7 is shared across Scottish populations of E. arctica (and its hybrids), E. foulaensis and E. micrantha (and its hybrids), while H10 is also shared across three species in Scotland.
Plastid haplotype frequencies across British Euphrasia species. The column cpDNA indicates the number of individuals sampled.
Spatial analysis of molecular variation (SAMOVA) of plastid sequence data across British Euphrasia populations.
Relationship among plastid haplotypes
The final concatenated plastid alignment was 1692 bp in length, for a total of 82 Euphrasia samples, including those from Gussarova et al. (2008). This alignment included the trnL intron (517 bp, 73 variable sites), trnL-trnF (420 bp, 85 variable sites) and atpB-rbcL (754 bp, 89 variable sites). The plastid tree (Fig. 4) successfully recovered the geographic clades reported in Gussarova et al. (2008). All diploid and tetraploid British samples possessed plastid haplotypes from the broad Palearctic taxa clade, which also includes E. borneensis (Borneo) and E. fedtschenkoana (Tian Shan). This clade received moderate support in our analysis (pp = 0.85). While informative of broad-scale relationships, most terminal branches were extremely short, and gave no information on interspecific relationships.

Majority rule consensus phylogeny of Euphrasia inferred from a concatenation of plastid trnL intron, trnL-trnF and atpB-rbcL using MrBayes. Posterior probabilities greater than 0.85 are indicated, and British diploids (red) and British tetraploid (blue) are coloured.
DISCUSSION
We have investigated the utility of DNA barcoding data for the study of taxonomically complex Euphrasia in Britain. We find that Euphrasia species do not possess diagnostic ITS and plastid sequence profiles, and instead haplotypes are either widespread across taxa, or are individual or population specific. While DNA barcoding is of limited value as a molecular tool for identifying Euphrasia species, we show these data to be informative of the evolutionary processes underlying the generation and maintenance of diversity. Most notably, deep divergence of ITS haplotypes between ploidy groups (Pi = 5.1%, >2 Ma divergence), support British Euphrasia being assembled from diverse pre-glacial continental taxa, and with ploidy differences acting as an important reproductive barrier partitioning genetic variation. Overall our results shed light on the maintenance of genetic variation in one of the most renowned taxonomically challenging plant groups.
DNA barcoding in taxonomically complex genera
Taxonomically complex Euphrasia have many characteristics that would make a DNA-based identification system desirable. In particular, molecular identification tools could be used to confirm species identities and subsequently revise the distribution of these under-recorded taxa. More generally, genetic data could be used to investigate which British species are genetically cohesive ‘good’ taxa. Our data show, however, that barcode sequences do not correlate with species boundaries as defined by morphology. Instead, haplotypes are often individual or population specific (for both ITS and plastid DNA), and where widespread are either shared across species within a ploidy level (for ITS) or across ploidy levels and species (plastid DNA). Patterns of haplotype sharing are often surprising, including between geographically disparate populations 100+ km apart, and between ecologically specialised taxa that seldom co-occur in the wild.
One possibility is that the species are not discrete genetic entities, and that the current taxonomy reflects a blend of discrete lineages, polytopic taxa, and morphotypes determined by a small number of genes. Alternatively, the species may represent meaningful biological entities, but with boundaries permeable to gene flow. In either case, the lack of species- specific or morphotype-specific barcodes may be affected by numerous evolutionary processes. Low sequence diversity associated with recent diversification is the first important factor. While elevated plastid diversity is a hallmark of some parasitic taxa, this is not the case for facultative hemiparasites like Euphrasia, which generally show similar patterns of mutation to autotrophic taxa (Wicke et al., 2016). Despite observing low plastid diversity (<0.5%) across taxa, we still detected 38 plastid haplotypes. This is sufficient variation for population genetic analysis, but lack of nucleotide diversity could explain the poor performance of our phylogenetic analyses. A second factor that reduces the ability of DNA data to distinguish species is selective sweeps, which can act on any genomic region including the plastid (Twyford, 2014, Muir and Filatov, 2007). While our data collection was not designed to measure the strength of selection, values for Tajima’s D were not significantly different from zero thus do not point to a strong selective regime.
In contrast to the factors above, it seems that self-fertilization, hybridity and incomplete lineage sorting are dominant factors shaping haplotype distributions across British Euphrasia species and populations. We observed many haplotypes that are restricted to individual samples or populations, consistent with French et al. (2008), who used extensive intrapopulation sampling to show most Euphrasia populations are fixed for a single plastid haplotype. This pattern of local fixation of haplotypes, and scarcity of widespread haplotypes, is likely due to many Euphrasia species being (at least partly) self-fertilising (Fis >0.4,French et al., 2004), and localised gravity-mediated seed dispersal. Where widespread haplotypes are present, these are shared amongst taxa and geographic areas. In these cases, dispersal of haplotypes has clearly occurred and their sharing among species may be due to hybridisation and incomplete lineage sorting. The large number of reported hybrids and hybrid species based on morphology (Preston and Pearman, 2015, Stace et al., 2015), as well as the prevalence of hybridisation in genetic data (Stone, 2013, Liebst, 2008), point to hybridisation being a key factor shaping genetic diversity in Euphrasia. Future genomic surveys will estimate the proportion of loci introgressing across species barrier in models that explicitly account for incomplete lineage sorting (Twyford and Ennos, 2012).
The sharing of DNA barcodes among Euphrasia species parallels a number of other studies where DNA barcoding has failed to provide species-level information. A notable example is willows, where hybridisation and selective sweeps have caused a single haplotype to spread across highly divergent taxa and between geographic regions (Percy et al., 2014). Poor species discrimination from DNA barcoding is also seen in the rapid radiation of Chinese Primula (Yan et al., 2015a) and Rhododendron (Yan et al., 2015b), which is likely a product of hybridisation and recent species divergence. In each of these groups, future DNA barcoding systems that target large quantities of nuclear sequence variation may provide resolution (Coissac et al., 2016, Hollingsworth et al., 2016). These data have the joint benefit of providing many nucleotide characters from unlinked loci, while also moving away from genomic regions that have atypical inheritance and patterns of evolution (i.e. plastids).Analyses of many nuclear genes (or entire genomes) would be particularly valuable for Euphrasia, where it may be possible to identify adaptive variants maintained in the face of hybridisation. These adaptive genes may underlie differences between species or ecotypes (Twyford and Friedman, 2015), and these loci could then potentially be used for future species identification.
Polyploidy and the maintenance of genetic variation
The deep divergence of ITS haplotypes between diploid and tetraploid Euphrasia suggest strong reproductive barriers between ploidy levels, a result consistent with previous population surveys with AFLPs (French et al., 2008). The lack of support of internal nodes in our phylogeny make the divergence between ploidy groups difficult to date, but it must predate the origin of the tetraploid clade (2.2 Ma) and the diploid clade (1 Ma), with a date likely to be closer to 8 Ma (similar to a previous global Euphrasia phylogeny, Gussarova et al., 2008). Our divergence age estimate suggests that genetic diversity in British Euphrasia long pre-dates recent glacial divergence and the origin of young British endemic taxa. As such, British Euphrasia diversity has been assembled from a diverse pool of genetic diversity from European and Amphi-Atlantic taxa. The presence of distinct ITS haplotypes in each ploidy group may also be a consequence of concerted evolution of this multi-copy region (Sang et al., 1995), rather than absolute reproductive isolation. Further work will be required to test the extent of gene flow across ploidy levels, which is now emerging as a common feature of other plant groups (Pinheiro et al., 2010, Slotte et al., 2008).
The divergence between diploid and tetraploid ITS sequences adds further weight to the British tetraploids not being young autopolyploids, and instead being allopolyploids. While it is difficult to decipher the parentage of British tetraploids from our data, our phylogenetic analysis place these British taxa in a clade composed exclusively of tetraploids (Clade IVd, Gusarova et al., 2008), and thus these species may have originated elsewhere before dispersal to the UK. Alternatively, plastid haplotypes shared between diploids and tetraploids could point to a British diploid parent to the tetraploids, with this parent not contributing an ITS haplotype. An allotetraploid origin is further supported by the high number of tetraploid- specific AFLP bands (French et al., 2008), fixed microsatellite heterozygosity indicative of disomic inheritance (Stone, 2013), and tetraploid genome assemblies of double the size of diploids (Twyford and Ness, Unpublished data). Future genomic and cytogenetic studies will clarify the origin of British tetraploids.
Conclusions
This study highlights how DNA barcoding data may fail to distinguish between species in taxonomically complex groups such as Euphrasia. No species in our study possessed a consistent diagnostic haplotype. Widespread haplotype sharing among species, in conjunction with high levels of intraspecific variation, make Euphrasia a particular challenge for DNA barcoding. However, our results are able to help us understand the maintenance of diversity, and in particular allow us to comment on the origins of British tetraploid species.
ACKNOWLEDGEMENTS
Thanks to Richard Ennos for his assistance with this research. This study formed part of an international exchange programme for XW, funded by a Chinese Scholarship Council (CSC). The Royal Botanic Garden Edinburgh (RBGE) is supported by the Scottish Government’s Rural and Environmental Science and Analytical Services Division. Research by ADT is supported by NERC Fellowship NE/L011336/1.
LITERATURE CITED


