

Abstract
Dogs (Canis lupus familiaris) were domesticated from gray wolves between 20-40kya in Eurasia, yet details surrounding the process of domestication remain unclear. The vast array of phenotypes exhibited by dogs mirror numerous other domesticated animal species, a phenomenon known as the Domestication Syndrome. Here, we use signatures persisting in the dog genome to identify genes and pathways altered by the intensive selective pressures of domestication. We identified 37 candidate domestication regions containing 17.5Mb of genome sequence and 172 genes through whole-genome SNP analysis of 43 globally distributed village dogs and 10 wolves. Comparisons with three ancient dog genomes indicate that these regions reflect signatures of domestication rather than breed formation. Analysis of genes within these regions revealed a significant enrichment of gene functions linked to neural crest cell migration, differentiation and development. Genome copy number analysis identified regions of localized sequence and structural diversity, and discovered additional copy number variation at the amylase-2b locus. Overall, these results indicate that primary selection pressures targeted genes in the neural crest as well as components of the minor spliceosome, rather than genes involved in starch metabolism. Smaller jaw sizes, hairlessness, floppy ears, tameness, and diminished craniofacial development distinguish wolves from domesticated dogs, phenotypes of the Domestication Syndrome that can result from decreased neural crest cells at these sites. We propose that initial selection acted on key genes in the neural crest and minor splicing pathways during early dog domestication, giving rise to the phenotypes of modern dogs.
Background
Spanning thousands of years, the process of animal domestication by humans was complex, and multi-staged, resulting in disparate appearances and behaviors of domesticates relative to their wild ancestors [1–3]. In 1868, Darwin noted that numerous traits are shared among domesticated animal species, an observation that has since been classified as the “Domestication Syndrome” (DS) [4]. DS is a phenomenon where diverse phenotypes are shared among phylogenetically distinct domesticated species but absent in their wild ancestors. Such traits include increased tameness, shorter muzzles/snouts, smaller teeth, more frequent estrous cycles, floppy ears, reduced brain size, depigmentation of skin or fur, and loss of hair.
Due to the selection in favor of specific desired traits by humans during the domestication process, genetic signatures exist that distinguish domesticated and wild animals of the same species, such as alterations in allele frequencies [5–10], signals of relaxed and/or positive selection [11-13], and linkage disequilibrium patterns [14,15]. Though numerous genome selection scans have been performed within a variety of domesticated animal taxa [5-10], no single “domestication gene” either shared across domesticates or unique to a single species has been identified [16,17]. However, this is not unexpected given the diverse behavioral and complex physical traits that fall under DS. Rather, numerous genes with pleiotropic effects likely contribute to DS traits through mechanisms which act early in organismal development [16,17]. One potential explanation was presented in Wilkins et al. 2014, that highlighted the parallel between DS phenotypes (e.g. craniofacial abnormalities, ear malformations, etc.) and those exhibited in neurocristopathies, disorders caused by aberrant development of tissues that derive from the embryonic neural crest. This hypothesis states that deficits during the development, proliferation, and migration of neural crest cells (NCCs) can explain the phenotypic patterns shared across domesticated animals [16].
To further explore the genetic underpinnings of DS phenotypes, we have searched for genomic signatures of early domestication in the domestic dog (Canis lupus familiaris), a species that represents the first known domesticated animal and that also starkly contrasts with its ancient ancestor the gray wolf (Canis lupus) in numerous DS traits. Putative signals of domestication have been identified through comparisons of dog and wolf genomes, with breed dogs either fully or partially representing dog genetic diversity in these studies [5,8,18,19]. However, most modern breed dogs arose ~300 years ago [20] and thus contain only a small portion of the genetic diversity found among the vast majority of extant dogs. Instead, semi-feral village dogs are the most abundant and genetically diverse modern dog group, and have undergone limited targeted selection by humans since initial domestication [21,22]. These two dog groups represent products of the two severe bottlenecks in the evolution of the domestic dog, the first resulting from the initial domestication of gray wolves, and the second from modern breed formation [23,24]. To distinguish signatures of early domestication from breed formation we have limited our analyses to genomic comparisons between village dogs and wolves. Village dogs are more genetically similar to ancient dogs [25,26], and have been used to discriminate between breed and domestication sweeps. We recently showed [26] that modern village dogs do not exhibit selective sweep haplotypes at 18 of 30 swept loci previously identified using breed dogs [5]. Furthermore, swept haplotypes were not found at many previously identified loci in two ancient Neolithic German dog genomes, suggesting that rather than candidate domestication regions (CDRs), Axelsson et al. 2013 largely identified regions associated with breed formation or other post-domestication selection [26].
In conjunction with traditional SNP-based selection scans based on extreme differences in allele frequency, we implement copy number (CN) scans to ascertain regions of the dog genome that have undergone intensive selection during domestication. To accomplish this, we survey differences in variants from a diverse panel of globally-distributed village dogs compared to gray wolves, and subsequently assess whether the swept alleles are present in the genomes of three ancient European dogs that are at least ~5,000 years old. With this approach, we identify CDRs that exhibit unusual divergence between village dogs and wolves at both the single nucleotide and copy-number level. Gene annotations and enrichment results indicate that numerous CDRs harbor genes integral in the initiation, differentiation, and migration of neural crest cells (NCCs) including the Wnt, FGF, and TGF-β pathways that are integral to the neural crest (NC). Additionally, we have isolated selective sweeps that contain three of the seven subunits of the minor (U11/U12) spliceosome, highlighting a possible role of alterations in minor splicing in establishing the domestic dog phenotype. More specifically, patterns of allele divergence suggest that ancient selective pressures may have first targeted the 65KDa minor spliceosomal subunit gene, RNPC3, which is positioned adjacent to the more recently duplicated [26-28] starch metabolizing gene, amylase-2b (AMY2B). Altogether, we argue that the dog domestication process altered the activity of genes associated with the embryological NC pathway and minor splicing, contributing to the array of DS phenotypes found in the modern dog including reduced aggression, craniofacial alterations, floppy ears, and decreased tooth sizes.
Results
Sample selection and sequence variant identification
We used ADMIXTURE and identity-by-state (IBS) analysis to identify a collection of 43 village dog and 10 gray wolf whole genomes that excludes closely related samples and that shows less than 5% admixed ancestry (Additional File 1: Note 1). Principal component analysis illustrates the genetic separation between village dogs and wolves and largely reflects the geographic distribution of the wolf and village dog populations (Figure 1B and 1C). We created two SNP call sets to identify regions with unusually large allele frequency differences between village dogs and wolves. First, we identified a total of 7,315,882 SNPs (including 53,164 on the non-PAR region of the X chromosome) that are variable among the 53 analyzed samples. This total SNP call set represents the densest set of identified variation and underlies the bulk of the subsequent analysis. Since differences in sequencing coverage and uneven sample sizes may lead to biased variant discovery, we additionally created a second SNP call set of 2,761,165 SNPs (including 17,851 on the non-PAR region of the X chromosome) limited to sites ascertained as being variable among three New World wolf samples [26]. Subsequent analyses utilizing this NWW-ascertained set were based on only the 5 Eurasian wolves and 43 village dogs.

(A) The approximate geographic origin of the village dog (circles) and gray wolf (triangles) genome samples included in our analysis. Results of a Principal Component Analysis of the filtered village dog (N=43) and gray wolf set (N=11) are shown. Results are projected on (B) PC1 and PC2 and (C) PC3 and PC4. Colors in in all figures correspond to sample origins and are explained in the PCA legends.
FST scans identify regions of differentiation between village dogs and wolves
We performed several scans to localize genomic intervals with unusual levels of allele frequency differentiation between the village dog and wolf populations. Following previous studies [5,8], we first calculated average FST values in disjoint 200kb windows along the genome and Z-transformed the resulting mean FST estimates. Due to differences in the effective population size and corresponding expected levels of genetic drift, Z-transformations were performed separately for the non-PAR region of the X chromosome. Setting Z-score cutoffs of 5 for the autosomes and 3 for the X, we identified 24 regions of extreme genetic differentiation, spanning a total of 7.8 Mb of sequence. Since this approach may fail to detect differentiated regions near window boundaries, we additionally performed an FST scan with greater resolution, utilizing 200 kb windows that slid along the genome in 50 kb increments. As expected, the sliding window approach identified a greater number of candidate regions: 30 regions encompassing 12.3 Mb of sequence. A 350kb region on chromosome 6 (chr6: 46,800,001-47,350,000) that contains the pancreatic amylase 2B (AMY2B) and RNA Binding Region Containing 3 (RNPC3) genes had the highest observed ZFST score using the total SNP call set (ZFST = 9.97). We completed analogous scans using the NWW SNP set, identifying 26 outlier regions (6.6 Mb) using non-overlapping windows and 34 regions (12.1 Mb) using sliding windows. A region on chromosome 16 that contains numerous genes including Taste Receptor 2 Member 38 (TAS2R38), Maltase-Glucoamylase 1 and 2 (MGAM and MGAM2), and a serine protease (PRSS37) is the most significant region identified using the NWW call set (ZFST = 7.53). Interestingly, the AMY2B region only achieved the thirteenth highest ZFST score within the NWW SNP set.
Identifying 37 candidate domestication regions
The union of the outlier regions from the total and NWW SNP sets yields 37 regions showing unusual levels of allele frequency differences among village dogs and wolves, 19 of which were outliers from analysis of both SNP sets (Table 1; Additional File 2: Table S1). Of these 37 candidate domestication regions (CDRs) only 17 intersect with previously reported dog CDRs (Figure 2A). Within our sample and SNP set, we assessed whether the dog or wolf haplotype is present at the 36 and 18 domestication sweeps reported in [5] and [8], respectively, in 46 additional canine samples, including three ancient dogs ranging in age from 5,000-7000 years old (see Methods; [25,26]). Likely due to the absence of sampled village dogs in their study, some Axelsson CDRs [5] appear to contain selective sweeps associated with breed formation, as evidenced by the lack of ancient and village dogs with the breed (reference) haplotype (example in Figure 2B). Although all autosomal sweeps identified by [8] intersected with CDRs from our study, six X chromosome Cagan and Blass windows did not meet the thresholds of significance from our SNP sets (example in Figure 2C). The authors of this study performed FST scans and Z transformations for windows on autosomes and X chromosome together, which may falsely inflate FST values on the X. We additionally compared the SNPs identified in [29] that exhibit diversifying selection signals shared between modern village dogs (or free-breeding dogs) and breed dogs with the locations of our CDRs. None of these sites were located within any of our CDR boundaries, suggesting that our approach may have identified sites resulting from early selection pressures of domestication rather than from subsequent selection events.

(A) Venn diagram of intersecting Pendleton, Axelsson et al. 2013 (AX), and Cagan and Blass 2016 (CB) CDRs. (B) Genotype matrix for the 130 SNPs within chr7: 24,632,211-25,033,464 in AX_14 for 99 canine samples. Sites homozygous for the reference (0/0; blue) and alternate alleles (1/1; orange) are indicated along with heterozygous sites (0/1; white). (C) ZFST scores from the sliding window (bars) and per site (dots) FST analyses of SNPs belonging to the total SNP set for CB_14 on chromosome X. Significant per site SNPs (ZFST > 3) are red. The span of CB_14 relative to these SNPs is indicated. Gene models are situated along the bottom.
Final Candidate Domestication Regions (CDRs) identified from the union of significant windows from the overlapping, and non-overlapping approaches of FST analysis of the Total and New World Wolf (NWW) SNP sets. The coordinates, unique identifier, length (bp), maximum ZFST score from both SNP sets, and whether or not a previously published CDR from Axelsson et al. 2013 (AX) or Cagan and Blass 2016 (CB) intersects with our CDR.
The genotypes of ancient dogs at these CDRs can aid in determining the age of these putative selective sweeps, thus discriminating domestication loci from breed sweeps. Visual genotype matrices (Additional File 3: Dataset 1) and non-reference (or “wild”) allele proportions (Additional File 4: Dataset 2) identified thirteen selective sweeps where three ancient dogs were outliers, or did not share modern village dog haplotypes (see Methods). More specifically, HXH (~7,000 year old German dog) and NGD (~5,000 year old Irish dog) were outliers at five CDRs each, while a known wolf-admixed sample, CTC (~5,000 year old German dog [26]), was wild-like at nine windows. Interestingly, all three dogs are homozygous for the wild haplotype at only one putatively swept region (CDR15), which contains only a single gene, Transmembrane Protein 131 (TMEM131). A human homolog of the gene, TMEM131L, is a regulator of the differentiation and proliferation of thymocytes and is an antagonist of the Wnt signalling pathway [30].
To pinpoint functional sequence variants that may be driving the patterns at each CDR we calculated per-SNP FST values and annotated SNP effects on coding sequence using Variant Effect Predictor (VEP; [31]) and SNPEff [32]. Although we did not observe any sites with significant ZFST scores within the CDRs that confer nonsense or frameshift mutations, we identified four missense variants with high FST values including a a V/I change in MGAM (chr16:7156695; ZFST = 6.18), a T/A mutation in CCNB3 (chrX:42982379; ZFST = 3.46), a K/E mutation in ENSCAFG00000016002 (chrX:43018605; ZFST = 3.46), and a H/R mutation in SNX19 (chr5:4046840; ZFST = 6.72). Given these limited results, we further searched for nonsense mutations at sites with FST > 0.35 (similar to [17]). No nonsense variants were identified from this SNP set, but three SNPs with elevated FST values were annotated as conferring a stop gain. These include a site in ENSCAFG00000024996 (chr25:10257734; FST = 0.684; Z FST = 4.65), SPICE1 (chr33:17770461; FST 0.482; Z FST = 3.10), and TRIM38 (chr35:23931336; FST = 0.406; ZFST = 2.52).
Pathway enrichment analysis highlights morphological development and the neural crest
We searched for gene functions that are overrepresented in the 172 genes found in the 37 CDRs using the BLAST2GO [33] and topGO ([34]) pipelines. A subset of the 41 categories with P < 0.05 using the Parent-Child (Fisher’s) enrichment test in topGO are listed in Table 2. Analysis using alternative enrichment tests (e.g. Classic Fisher’s) yields similar results (see Additional File 1: Note 3 and Additional File 5: Table S2). Though many of these categories detail enrichments of pathways or functions at the subcellular level (e.g. secretion and establishment of polarity), additional top enriched pathways include those linked to skeletal and craniofacial development, brain and nervous system function, and metabolism.
A subset of enriched GO categories with P-values less than or equal to 0.05 from Parent-Child topGO analysis of CDR genes versus the total genome. The GO ID and term annotation, gene count in this category in the genome versus in CDRs (in parentheses), the P-value, CDR gene IDs, and the CDRs that the genes are located in are provided for each significant category.
Bone development and ossification is a strongly overrepresented process (GO:0001649; p = 0.004), with six of the 207 genes in the dog genome ascribed to this GO category located in a CDR. Additional multi-gene enriched categories involved in skeletal development include osteoblast proliferation (GO:0033687; p = 0.001), palate development (GO:0060021; p = 0.018), as well as the differentiation (GO:002062; p = 0.03) and development regulation (GO:0061181; p = 0.032) of chondrocytes (cells required for cartilaginous tissues such as the external ear) were also enriched. Altogether, genes associated with these five GO categories are located within nine unique CDRs and include key genes involved in embryonic cranial development including Axin 2 [35], Protein Kinase C Alpha (PRKCA; [36]), and both members (WNT9B and WNT3; [37]) and regulators (WFKINN1; [38]) of neural crest associated signaling pathways.
Determination of polarity and both the anteroposterior and dorsoventral axes is critical for proper neural tube and crest development, as well as supplying positional identity to neural crest cells along these axes [39,40]. We observe an overrepresentation of CDR genes that establish cellular polarity and symmetry (Table 2), belonging to GO categories including determination of dorsal/ventral axis specification (GO:0009950; p = 0.037), establishment of planar polarity involved in nephron morphogenesis (GO:0072046; p = 0.011), and determination of left/right pancreatic asymmetry (GO:0035469; p = 0.045). A gene with wide-reaching associations is Smoothened (SMO; CDR19), which has roles in determination of the ventral midline (GO:0007371; p = 0.016) and specification of anterior/posterior patterns (GO:0009952; Classic Fisher’s p = 0.021), a multi-gene GO category with four other genes (Table 2). SMO also regulates the hedgehog transcription factor pathway (GO:0007228; p = 0.025), and the transition of epithelial cells to mesenchymal cells in metanephric renal vesicle formation (GO:0072285; Classic Fisher’s p = 0.008), a complex process closely linked to apical/basolateral polarity [41]. Finally, SMO is also a negative regulator of hair follicle development (GO:0051799; p = 0.035) and osteoblast differentiation.
We also observe an overrepresentation of genes involved in brain and nervous system development within the CDRs. Fibroblast growth factor 13 (FGF13R; CD37) is linked to the establishment of polarity in neuroblasts (GO:0045200; p = 0.032), while SMO (CDR19), TLN1 (CDR16), and PRKCA (CDR13) are linked to the activation of astrocytes (GO:0048143; Classic Fisher’s P = 0.024), which, as glial cells, are derivatives of the neural crest [42]. WNT3 (CDR11) has been linked to axonogenesis, as it positively regulates collateral sprouting in absence of injury (GO:0048697; Classic Fisher’s P = 0.016). Finally, three CDR genes are involved in the development of the substantia nigra in the midbrain (GO:0021762; Classic Fisher’s P = 0.017), which include proteolipid protein 1 (PLP1; CDR34), ATP5F1 (an ATP synthase; CDR7), and myelin basic protein (MBP; CDR1), a protein that is the major constituent of the myelin sheath of Schwann cells and oligodendrocytes.
Congruent with previous work (Axelsson et al. 2013), we found a significant enrichment of genes relating to metabolism, though no overrepresentation of categories related to digestion was observed. Two genes with roles in one-carbon metabolism (GO:0006730; p = 0.034), Adenosylhomocysteinase Like 2 (AHCYL2) and Carbonic Anhydrase 9 (CA9) are located in CDRs 19 and 16, respectively. Also, PLP (CDR34) is involved in long-chain fatty acid biosynthesis (GO:0042759; Fisher’s Classic p = 0.04). The region harboring MGAM (CDR20), which encodes an enzyme responsible for the second step of starch metabolism, is a previously identified sweep region [5,8]. MGAM belongs to many enriched categories including starch catabolic process (GO:0005983; p = 0.042), polysaccharide catabolic process (GO:000272; p = 0.028), and maltose metabolism (GO:0000023; Classic Fisher’s p = 0.008), and is situated within a region of elevated per SNP FST that distally extends over two additional genes in this locus, the bitter taste receptor TAS2R38 and CLEC5A (C-type lectin domain family 5 member A) (Figure 3A). Closer analysis of the CDR20 region highlights the challenge in identifying the underlying targets of selection from variation data. Although ZFST scores sharply decrease just downstream of MGAM, near its directly adjacent paralog, MGAM2, a pattern of highly differentiated SNPs extends upstream across multiple genes including CLEC5A, which belongs to multiple highly enriched ontologies representing broadly acting processes that may contribute to the domestication syndrome including osteoblast development (GO:0002076), negative regulation of myeloid cell apoptotic process (GO:0033033), and positive regulation of cytokine secretion (GO:0050715). At another starch digestion gene locus, a strong signal of SNP differentiation is observed at the AMY2B region on chromosome 6, overlapping a previously reported expansion of the AMY2B gene found in modern dogs [5,43]. As in CDR20, however, interpretation of underlying causal genes at this region is made more complicated by the observation that ancient dog samples contain the selected haplotype without the amylase expansion (Additional File 6: Figure S1; [26]), and that the region of high FST extends >4.5 Mb distally, thereby encompassing the adjacent RNPC3 (Figure 3B), the 65 KDa subunit of the U11/U12 minor spliceosome, as is visible in the genotype matrix for the region (Additional File 6: Figure S1A).
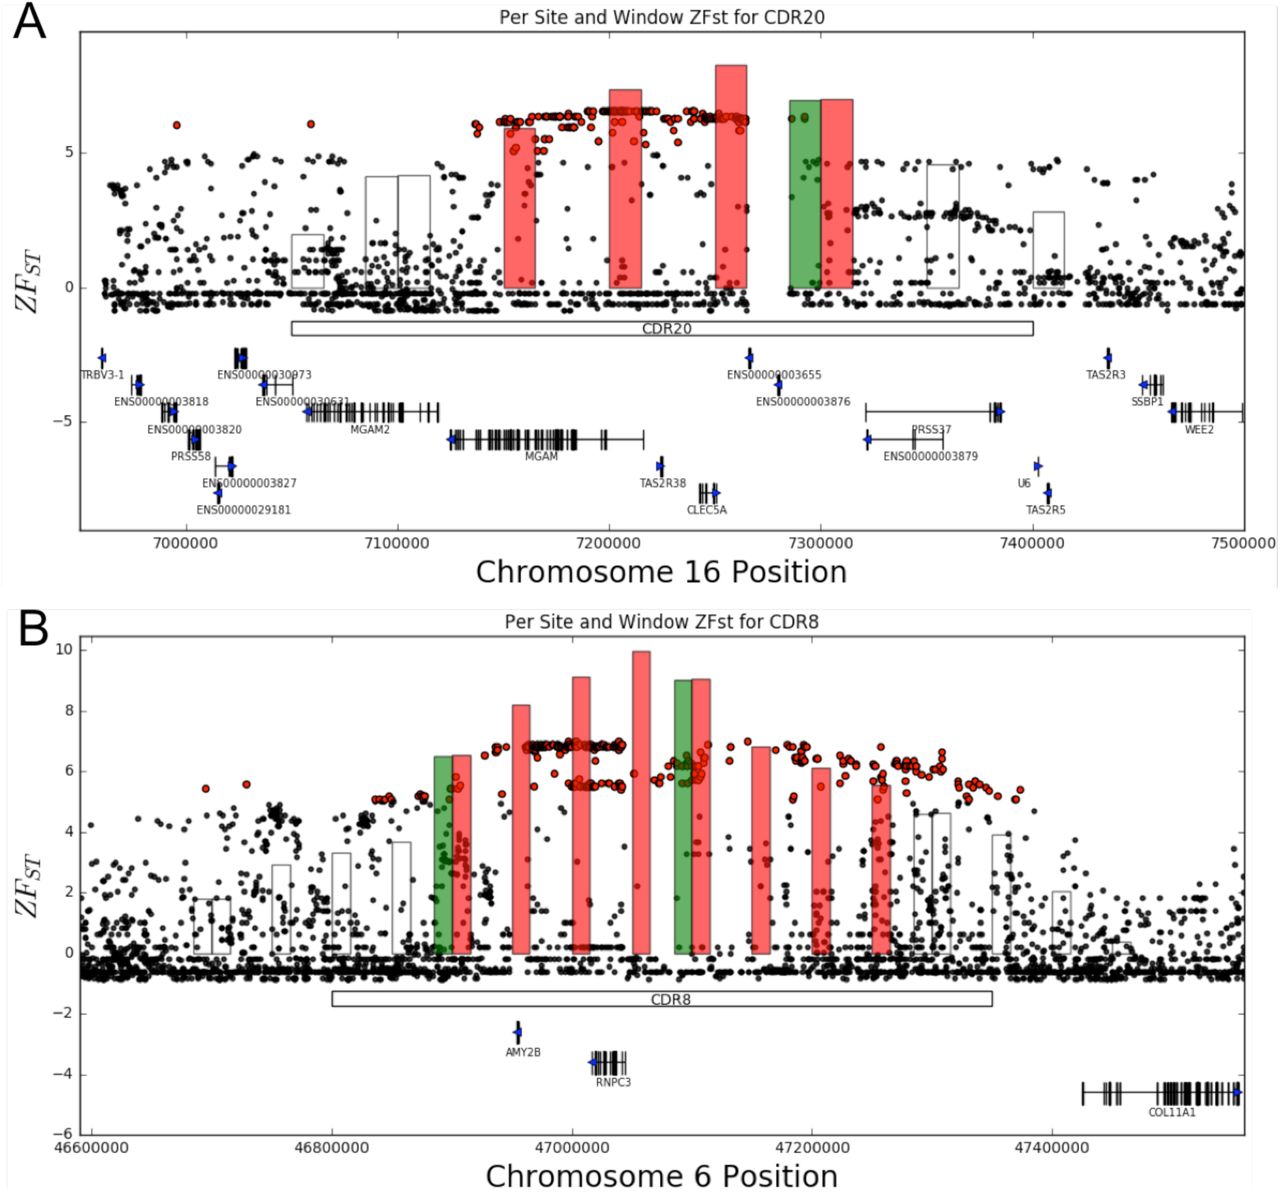
ZFST scores from the sliding window (bars) and per site (dots) analyses of SNPs belonging to the total SNP set for (A) CDR20 and (B) CDR8. Sliding, overlapping windows meeting significant ZFST threshold (ZFST > 5) are red. The span of each CDR relative to these SNPs indicated (white box). Gene models are situated along the bottom with blue arrows indicate transcriptional direction.
Selection scans for CN variation between dogs and wolves
Copy-number variants have also been associated with population-specific selection and domestication in a number of species [5,44,45]. Since regions showing extensive copy-number variation may not be uniquely localized in the genome reference and may have a deficit of SNPs passing our coverage thresholds, we directly estimated genome copy number along the reference assembly and searched for regions of unusual copy number differences using two approaches: fastCN, a method based on depth of sequencing reads which tolerates mismatches and combines copy-number estimates across related paralogs, and QuicK-mer, a mapping-free approach that resolves paralog-specific copy-number estimates.
Both fastCN and QuicK-mer estimation pipelines were applied to the 53 village dog and wolf samples analyzed in the FST analysis. We assessed the quality of our CN estimations by calculating the signal-to-noise ratio (SNR) in genomic intervals that are not CNV, finding a higher SNR in wolf samples that have higher sequencing depth. Importantly, many village dogs with considerably lower depth (~4-10x) still achieve similar SNRs to these higher coverage wolves (Additional File 6: Figure S2). Next, we validated the accuracy of our CN estimates through comparison with probe intensity data from a previous Comparative Genome Hybridization Array (aCGH) study that analyzed 23 wolf-like canids [46], seven of which have genome sequence data analyzed in our FST sample set. After accounting for the noisy sequence data from the sample used as the reference in the aCGH experiments (Additional File 1: Note 6.3), we find strong correlation between in silico aCGH and actual probe data, with R2 values ranging from 0.43-0.84 and 0.34-0.70 for fastCN and QuicK-mer (Additional File 6: Figure S3; Additional File 7: Dataset 3), and mean R2 values at 0.71 and 0.55, respectively. The higher correlation with fastCN copy-number likely reflects this method’s tolerance of mismatches, which is analogous to aCGH probe hybridization. The accuracy of our CN estimates is further supported by targeted validation at the AMY2B locus described below.
VST scans, a modified FST approach that calculates deviations of copy-number between populations [44], were completed using CN estimates within 380,731 and 642,203 windows from fastCN and QuicK-mer, respectively, for the 53 canine set (Additional File 1: Note 7). Following Z transformation, 597 fastCN windows obtained significant ZVST values ZVST > 5 on autosomes and chrX-PAR, ZVST > 3 on chrX-NonPAR) while 250 QuicK-mer windows were significant outliers (Additional File 1: Note 7.3). The outlier regions from both pipelines were merged based on overlapping coordinates using methods analogous to FST CDRs to generate 202 outlier regions (Additional File 8: Table S3). Due to low genome coverage of some dog samples, confident detection of small CNVs using read depth is difficult. Therefore, the 202 outlier regions were further filtered to require at least two adjacent CN windows from either fastCN or QuicK-mer, or combined, resulting in 67 filtered VCDRs (Additional File 9: Table S4) containing 39 genes. Once this filtration was applied, VCDRs were either supported by both pipelines (N=35) or fastCN only (N=32), but no region was identified by QuicK-mer alone. Of these filtered VCDRs, five intersected with a FST CDR including VCDR20 which is contained within FST CDR (CDR8), a previously published sweep locus [5,8], which encompasses the well-documented copy number variable AMY2B locus. VCDRs 27, 28 and 31 intersect with two FST CDRs 10 and 11 on chromosome 9, while VCDR 126 and CDR 32 co-localize on chromosome X. Additionally, previously identified SNPs under putative diversifying selection shared between breed dogs and village dogs [29] were not located in any VCDR. Finally, likely due to the sparsity of genes in the VCDRs, no prominent gene enrichment patterns were observed (Additional File 10: Table S5).
Characterization of a large-scale structural variant located at the AMY2B locus
Outliers from both the FST (chr6: 46800001-47350000) and VST (chr6: 46945638-46957719) selection scans encompass the AMY2B gene, which at increased CN confers greater starch metabolism efficiency due to higher pancreatic amylase enzyme levels [5,43]. As stated previously, examination of per SNP FST results suggest that RNPC3 may be an additional (or alternative) target of selection at this locus (Figure 3B). Furthermore, read-depth CN analysis has illustrated that the AMY2B tandem expansion was absent in three analyzed ancient dog samples [26]. Instead, large-scale segmental duplication at the locus accounts for some detected AMY2B CN increases [26].
Using methods implemented previously [26], we recapitulated the elevated CN estimates across the locus for some samples (including the ancient Newgrange dog; Additional File 1: Figure S4). Fine-scale CN estimates reveal the presence of two duplications with unique breakpoints (Figure 4C). Read-depth based CN patterns show a proximal extension of ~55kb (Figure 4A) and a distal extension of ~20kb (Figure 4B) that differentiate the two large duplications (designated the 1.9 Mb and 2.0 Mb duplications based on approximate lengths).
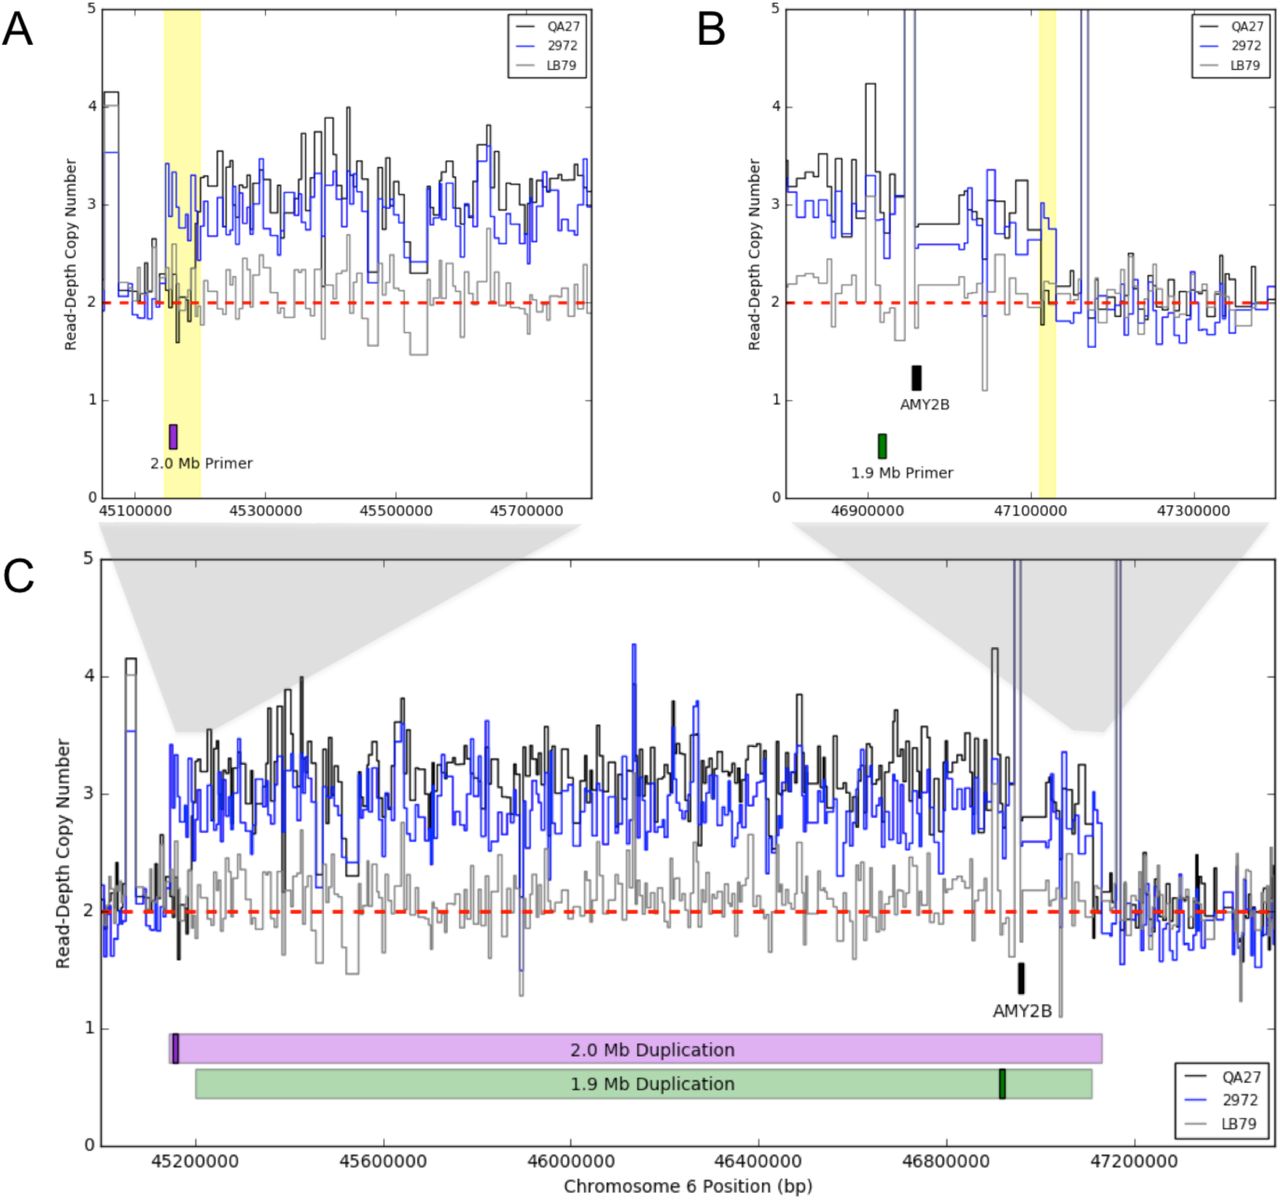
Read-depth based CN estimations for the (A) full chromosome 6 region of interest, as well as the (B) proximal and (C) distal margins of large-scale duplications surrounding the AMY2B locus. Estimates for three dogs with differential duplication genotypes are displayed in this figure including those with either the 1.9Mb (QA27; black) or 2.0Mb (2972; blue) duplication, compared to a dog without a large-scale duplication (LB79; gray). Relative positions of the 1.9Mb (green bar) and 2.0Mb (purple bar) duplications are indicated along with their respective primers (darker boxes within duplications). Extensions of the 2.0Mb duplication relative to the 1.9Mb duplication are highlighted in yellow.
We utilized droplet digital PCR (ddPCR) to survey CN across this region in 90 dogs to determine the validity of read-depth based copy number estimations and ascertain whether the large-scale duplications can account for observed differences in AMY2B copy-number. Primers were designed to target a region unique to the proximal end of the 2.0 Mb duplication, within the 1.9 Mb duplication and shared with the 2.0 Mb duplication, and targeting the AMY2B gene (see Figure 5). The ddPCR results (Additional File 11: Table S6 and Additional File 12: Table S7) were found to be strongly correlated with the AMY2B (Additional File 6: Figure S5A) and large-scale duplication (Additional File 6: Figure S5B) CN estimates for 42 of the 90 ddPCR-sampled dogs for which we had sequence data. The ddPCR results confirm the standing variation of AMY2B copy-number across dogs, and distinguish the two large-scale duplications that encompass this location (Additional File 6: Figure S6). Per ddPCR, total AMY2B copy number ranged from 2-18 copies per dog (average 2nAMY2B= 11), relative to a diploid control region on chromosome 18 (see Methods). Furthermore, the AMY2B CN expansion appears to be independent of the large-scale duplications, as ddPCR results show that some dogs without the large duplications still maintain very high AMY2B CN. Both ancient dog samples from Germany (5 and 7kya) did not indicate CN increases for either the duplication or the tandem AMY2B expansions [26]. However, based on read-depth patterns at the duplication breakpoints, the Newgrange Irish dog (5kya; [25]) harbored the 2.0 Mb duplication while 2nAMY2B = 3, indicating no tandem AMY2B expansion, but rather CN increases due to the presence of the large duplication.

(A) Relative to Ensembl gene models and reference assembly gaps (top two tracks), the co-localization of VCDRs (dark blue) with regions of copy number expansion can be observed. Tracks 3 and 4 display the average copy number states of wolf (orange) and village dog (blue) populations as determined by fastCN and QuicK-mer, with regions of consistent CN between the populations as green. Putative inversions (purple bars), FST CDRs (red bars), and per site ZFST values from the total SNP set (red = ZFST > 5), are also provided in tracks 5-7.
A region of extreme CNV on chromosome 9 co-localizes with FST selective sweeps
Co-localization analysis indicated a clustering of VCDR and CDR windows within the first 25Mb of chromosome 9. Upon closer inspection of the copy-number and FST data at this region, we observed anomalous patterns not found elsewhere in the genome for our datasets. Average CN values from fastCN and QuicK-mer both indicate significantly higher CN in wolves within 19 VCDR windows here (Additional File 9: Table S4). Notably, boundaries of the VCDRs are directly adjacent to regions undergoing significant allele frequency differentiation, as highlighted in per site ZFST peaks in Figure 5A. Such a pattern of extended divergence is reminiscent of inverted haplotypes which have been characterized in several species [47-49]. To further characterize this locus, we identified candidate inversions in the dogs and wolves separately using inveRsion [50] which relies on SNP genotypes to locally phase alleles and determine haplotype blocks for inversion breakpoint estimations (see Methods). Although no inversions were detected in the wolves on chromosome 9, five potential inversions were identified in village dogs clustered within this region of interest. Interestingly, predicted breakpoints of two inversions are situated at the transition point between the elevated FST region (chr9: ~9.0-16.7 Mb) and major copy-number peaks. Correlations between copy number states of VCDRs (per fastCN and QuicK-mer) and SNP genotypes of the 53 samples on chromosome 9 indicates two loci 8 Mb apart in the reference genome share elevated R2 value, patterns consistent with genome rearrangements at this region (Figure 5B; Additional File 13: Dataset 4 and Additional File 14: Dataset 5). More specifically, the copy number states of VCDR 31 and VCDR 48 (Additional File 6: Figure S7) share similar correlation even though the location are separated by 8 Mb.
Discussion
Genetic and archaeological data indicate that the dog was first domesticated from Eurasian gray wolves by hunter-gatherers between 20-40 kya [25,26,51,52]. Though the exact events associated with domestication will likely never be unearthed, evidence suggests that the process was complex, and may have spanned thousands of years [3,25]. Through genome analysis of unrelated modern village dog and wolf samples with low dog-wolf admixture, we have identified 37 CDRs and 67 VCDRs that are strongly deviated between dogs and wolves in allele frequency and estimated CN. Our sampling strategy, which utilized only village dogs, and comparisons with ancient dog genome data indicate that these selection events likely reflect early domestication selection pressures.
FST interpretation
Most regions detected from sequence selection scans (CDRs) highlighted in this study are unique, and no earlier works have identified genomic loci exhibiting copy-number selection signals (VCDRs) in dogs with a comparable method of analysis. Though 43% of our CDRs corresponded with at least one previously determined swept region [5,8], our overall gene enrichment patterns are not consistent with these earlier studies, and we emphasize this is most likely due to differences in the studied samples. Previous selection scans have either solely relied on comparisons of breed dogs to gray wolves [5,19], or a mixture of village and breed dogs [8,18]. By avoiding spurious signals resulting from breed formation, we argue that our sweeps identified in modern village dogs are more likely signals of ancient selection events that arose thousands of years ago, and we emphasize the strength of sampling village dogs with high genetic diversity from broad geographic distributions in order to avoid capturing local selection events present in populations from limited geographic locations.
A further strength in our methodology was the analysis of sites under two distinct ascertainment schemes. More specifically, variants from the NWW SNP set were either present in the ancestral population of New and Old World wolves or are private to modern New World wolves, which permitted SNP analysis at sites with an unbiased ascertainment with regard to Eurasian dog and wolf populations [26]. For this reason, detection of significant windows from analysis of both total and NWW SNP sets is likely robust to any potential ascertainment bias.
However, we acknowledge limitations in the experimental design of this study, and attribute some uncertainty in our inference as a result of the current dog reference genome, as well as sample size and availability. The current dog assembly (CanFam3.1) remains substantially incomplete (>23,000 gaps), which can impair accurate copy-number estimation and lead to the misidentification of selection signals in duplicated regions. A higher quality reference genome may overcome such limitations in selection scans, allowing direct examination of variation among gene paralogs.
Altogether, our methods defined 37 distinct genomic regions (CDRs) containing 172 genes that display significant sequence deviation in dogs relative to wolves (Table 1), of which 54 genes belong to significantly enriched gene ontology categories including developmental, metabolism, and reproductive pathways (Table 2). It is important to note that the genomic position of most enriched CDR genes are not co-localized, which implies that the observed enrichment is not an artifact of a selective sweep containing a cluster of paralogous genes. Rather, we observe enrichment of genes belonging to the same pathway (e.g. skeletal development, polarity determination, or brain development) that localize to distinct regions of differentiated allele frequencies. Such distributions suggest that parallel selective pressures occurred at numerous genomic positions for genes involved in a shared biological function, reflecting selective sweeps that likely arose from differential pressures that have acted on village dogs and wolves, possibly occurring as early as initial domestication. Additionally, similar to selection scans in chickens [6], pigs [9], and rabbits [17], the scarcity of significantly deviating protein sequence altering SNPs in the CDRs indicates that gene loss did not have a significant role in the domestication of dogs, possibly implicating alterations in gene regulation instead during domestication, as has also been hypothesized for artificial selection during breed formation [53].
VST interpretation
In conjunction with surveys of SNP deviation, VST selection scans were used to identify 202 windows with significant copy-number deviation (VCDRs) between dogs and wolves, and the resulting discrepancy in the number of windows discovered by fastCN and QuicK-mer is intriguing. Although QuicK-mer interrogates a higher percentage of the genome in terms of the number of base pairs, this pipeline discovers fewer VCDRs. A possible source of this disparity is the incomplete nature of the current canine assembly. During QuicK-mer’s 30-mer generation process, all chromosomes are considered, including the 3,329 unplaced contigs, some of which may be redundant. Thus, any regions that appear duplicated due to assembly error will lose 30- mer coverage. Secondly, QuicK-mer is sensitive to single base pair changes due to the usage of unique k-mers (Additional File 1: Note 5). Without the resource of a wolf genome assembly, generation of unique 30-mers based on the genome of an inbred dog decreases the likelihood for discovering regions with divergence in wolves. However, QuicK-mer complements the fastCN pipeline by only considering unique regions. For example, QuicK-mer clearly distinguishes two regions of major structural variation on chromosome 9 that show related copy number states, while fastCN suggests more complicated substructures (Additional File 6: Figure S8).
The role of the neural crest in dog domestication
The collective traits displayed by dogs and other domestic animals that constitute the domestication syndrome (DS) are diverse, can be manifested in vastly different anatomical zones, and appear seemingly disconnected. However, regardless of the sampling or methodologies implemented, no survey of selection sweeps in the dog genome have isolated a singular genomic region as the sole contributor of the complex domestic dog phenotypes that can explain the DS [5,8,18,19]. Instead, the results of these previous studies mirror those presented here, with numerous swept regions distributed about the genome, possibly arising from selection that occurred independently at multiple loci, which gave rise to each of the observed DS traits. Alternatively, selection could have acted on considerably fewer genes that are members of an early-acting developmental pathway.
For these reasons, the pivotal role of the neural crest cells (NCCs) in animal domestication has gained support from researchers over recent years [16,54]. In 2014, Wilkins et al. (2014) established that the vast array of phenotypes displayed in the animal DS mirror those exhibited in mild human neurocristopathies, whose pathology stems from aberrant differentiation, division, survival, and altered migration of NCCs [55]. NCCs are multipotent, transient, embryonic stem cells that are initially located at the crest (or dorsal border) of the neural tube. Following induction and transition from epithelial to mesenchymal cell types, NCCs will migrate along defined pathways to various sites in the developing embryo. Tissues that derive from NCCs include most of the skull, the adrenal medulla, sympathetic ganglia, odontoblasts (tooth precursors), pigmentation-associated melanocytes, bone, cartilage, and many others [16,54].
Support for the role of the NCCs in the domestication process has been strengthened by results of silver fox breeding experiments. Tameness or reduced fear toward humans was likely the earliest trait selected for by humans during domestication [3,56,57]. Mirroring this, when researchers only selected for tameness in the fox breeding population, numerous physiological and morphological characteristics appeared within twenty generations, including phenotypes associated with DS such as floppy ears, fur pigmentation changes, altered craniofacial proportions, and unseasonal timing for mating [1,58]. As the progenitor for the adrenal medulla that produces hormones associated with the “fight-or-flight” response in the sympathetic nervous system, hypofunction of NCCs can lead to changes in the tameness of animals [16]. Altogether, the link between tameness and the NC indicates that changes in neural crest development could have arisen first, either through direct selection by humans for desired behaviors or via the “self-domestication” [59,60] of wolves that were more docile around humans.
The initiation and regulation of neural crest development is a multi-stage process requiring the actions of many early-expressed genes including the Fibroblast Growth Factor (Fgf), Bone Morphogenic Protein (Bmp), Wingless (Wnt), and Zic gene families [61]. Members of both the Fgf (Fgf13 in CDR37) and Wnt (Wnt9B and Wnt3 in CDR11) gene families that aid in the origination of the neural crest are found in our CDRs, along with ZIC3 (CDR37) which promotes the earliest stage of NC development [62]. Assignment of identity and determination of migration routes for NCCs relies on positional information provided by external signaling cues [39.40]. In addition to the previously described genes (Wnt9B, Wnt3, Fgf13, ZIC3), AXIN2 (CDR13) and SMO (CDR19) are essential for the determination of symmetry, polarity, and axis specification (Table 2). Since these genes are located in putative sweeps, our results suggest that early selection may have acted on genes essential to the initiation and regulation of the NC, thus altering the proper development of NCC-derived tissues linked to the DS.
Ancient dog remains indicate that body size, snout lengths, and cranial proportions of dogs considerably decreased compared to the wolf ancestral state following early domestication [63]. Further, ancient remains indicate jaw size reduction also occurred, as evidenced by tooth crowding [63]. These alterations are consistent with the DS, and implicate aberrant NCC migration since decreases in the number of NCCs in facial primordia is directly correlated with reductions in mid-face and jaw sizes [16,64]. Overall, we observed an enrichment of CDR genes associated with bone and palate development (Table 2). At critical stages of midfacial development, the Wnt pathway is activated during lip fusion and facial outgrowth, and expression of both WNT3 (CDR11) and WNT9B (CDR11) have been detected in the developing facial ectoderm, and linked to cleft palates [37]. WNT9B is also critical for Fgf signaling in the developing nasal and maxillary processes [65]. Craniofacial malformations have also been attributed to insufficient levels of NOL11 (CDR12; [66]), while decreases in AXIN2 (CDR13), a negative regulator of Wnt signaling [67], causes craniosynostosis or premature fusion of the skull [35]. We hypothesize that the altered cranial morphology of modern village dogs is linked to altered activities of NCC regulators, resulting in a decline of NCCs migrating NCCs to the developing skull.
Drooping or “floppy” ears are a hallmark feature of domesticates. Compared to the pricked ear phenotype of wolves, village and breed dogs predominantly have floppy ears [68]. In humans, insufficient cartilage in the pinna, or outer ear, results in a drooping ear [69] phenotype linked to numerous NC-associated neurocristopathies (e.g. Treacher Collins, Mowat-Wilson, etc.). Cartilage is a NCC-derived tissue [16] that solely consists of chondrocytes, and our enrichment results highlighted three genes involved in the differentiation and regulation of chondrocyte development (Table 2). This enrichment, coupled with established connections between the NC and cartilage formation, provides support to the hypothesis that the floppiness of domesticated dog ears arose due to reductions in the number of NCCs targeted to the developing ear and its cartilage, thereby lessening support of the external ear [16].
Finally, two additional DS phenotypes, depigmentation and reduction in hair (or hairlessness), are linked to pathways that regulate NC development. Excluding retinal, all pigmented cells are derived from the neural crest [70], and aberrant pigmentation has been linked to neurocristopathies such as von Recklinghausen neurofibromatosis, neurocutaneous melanosis, Waardenburg syndrome, and albinism [42]. Though no gene directly implicated in pigmentation was identified in our sweeps, some CDR genes that either belong to or interact with key NC regulation families such as Wnt (WNT3 (CDR11), WNT9B (CDR11)), Bmp (WFIKKN1 (CDR6)), or Fgf (FGF13 (CDR37)) could alter the development of or delimit the migration of NCCs, causing depigmented phenotypes. A further NC regulation network, the Hedgehog (hh) pathway, requires and is positively regulated by SMO [71,72]. Ablation of SMO prevents effective hh signalling, disrupts hair follicle development, and, along with the Wnt pathway, likely is a determining factor in epidermal cell fate [71,72]. Again, perturbation of crucial NC signaling pathways results in DS phenotypes with systemic expression.
The uncertain role of selection at starch metabolism loci during domestication
Clear distinctions in the efficiencies of starch digestion have been illustrated in dogs compared to their wild wolf ancestors, either from copy-number expansion or genic mutations in starch metabolizing genes [5,27,43]. Earlier work highlighted the importance of efficient starch digestion in early dog domestication, exhibited by selective sweeps at starch metabolizing genes [5]. Since then, recent population genetic studies have pushed back the estimated time of dog domestication to a time that predates human establishment of agriculture [23,26,52,73], the point in which human diets would have also become more starch-rich. Given these new estimates, selection for enhanced starch processing must have occurred since domestication [26,74]. Congruent with this, our selection scans suggest that two core starch metabolism genes, MGAM and AMY2B, may not have been the initial targets of selection. Though we see enrichment of starch metabolism categories in our FST analyses, this enrichment is largely driven by MGAM, which is assigned to three of the five categories associated with carbon metabolism. Per site FST patterns at the MGAM locus indicate that primary selection may have been on adjacent genes CLEC5A and TAS2R38 (Figure 3A). Similar patterns were observed at the AMY2B locus (Figure 3B), where FST peaks are shifted distally toward the 65KDa minor spliceosomal subunit, RNPC3, a gene that may have a role in early development and growth, as mutations in humans are linked to dwarfism [75]. As first noted by Cagan and Blass (2016), RNPC3 may have been the possible first driver of selection at this locus since selection scans from their study did not identify significant windows containing the AMY2B gene. A recent study has detected AMY2B copy-number greater than two in some ancient Romanian dogs (6,000-7,000 years old) using qPCR [28], but the presence of encompassing larger duplications (such as that found in the Newgrange dog) was not tested. However, the AMY2B tandem expansion was not detected in HXH, a German sample of the same age as the Romanian samples from Ollivier et al. 2016, suggesting that the tandem duplication may have been a locally-evolved mutation that was either subsequently introduced further into Europe or arose independently at a subsequent time.
A role for the minor spliceosome in altered cell differentiation and development
Intriguingly, RNPC3 is not the only minor spliceosome subunit represented in our CDRs. Of the seven experimentally validated subunits identified in the human minor (U11/U12) spliceosome [76], the 20 (ZMAT1), 25 (SNRNP25), and 65 (RNPC3) KDa subunits are located within CDRs 33, 7, and 8, respectively. Complementary to the CDR enrichment results, mutations in other minor spliceosomal subunits and components have been linked to developmental disorders and neurocristopathies, disorders arising from abnormalities in NC development. First, mutations in Sf3b1, a U12 spliceosome component [77], alters the expression of critical NC regulators such as Sox and Snail family members in zebrafish [78]. U4atac, another snRNA associated with the U12 spliceosome, has been linked to the Taybi-Lindner Syndrome (TALS) of which phenotypes include craniofacial, brain, and skeletal abnormalities [79]. Finally, mutations in a further minor spliceosome constituent, the human Zrsr2 gene, disrupts proper cell differentiation pathways, and is linked to myelodysplastic syndrome [80]. This gene is also highly conserved as mutants for the Zrsr2 plant homolog, Rough Endosperm 3, display improperly spliced U11/U12 introns and whose phenotype includes disrupted stem cell differentiation in maize, highlighting the ancient role of the minor spliceosome in cell differentiation pathways [81]. Altogether, these findings that link minor splicing to aberrations in cell differentiation, migration, and neural crest development, substantiate hypotheses that primary selection during domestication first occurred for genes involved in critical, far-reaching pathways such as splicing. It is possible that key genes in the NC pathway are spliced by the minor spliceosome.
Conclusions
Selection scans of the dog genome have yielded 37 regions of sequence deviation between village dogs and their wild ancestors, the gray wolves. We argue that timing inconsistencies with human diet shifts as well as aberrant FST patterns at loci harboring starch metabolizing genes, does not support the theory that early selection pressures were targeted to genes related to diet. Instead, we believe that the primary targets of selection are nearby genes that are associated with the complex, far-reaching neural crest development pathway. We have discovered enrichment of genes in CDRs that are linked to the early establishment of the neural crest, as well as critical for the migration and differentiation of resulting neural crest cells, that may explain many of the traits attributed to the Domestication Syndrome including the reduction in skull and jaw size, decrease in body size, loss of hair, and floppy ears. Additionally, three regions with unusual levels of allele frequency differences harbor subunits of the minor spliceosome, components of the larger minor splicing pathway associated with impaired cell differentiation across diverse taxa. Together, our results suggest that the NC and minor splicing mechanisms, two early acting pathways with extensive phenotypic effects, had a pivotal role in the early domestication process of dogs.
Methods
Sample Processing and Population Structure Analysis
Genomes of canids (Additional File 15: Table S8) were processed using the pipeline outlined in [26]. Using GATK [82], a resulting dataset of single nucleotide polymorphisms (SNPs) was produced [26]. Thirty-seven breed dogs, 45 village dogs, and 12 wolves were selected from the samples described in Botigue et al., and ADMIXTURE [83] was utilized to estimate the levels of wolf-dog admixture within this subset. The data was thinned with PLINK v1.07 (--indep-pairwise 50 10 0.1; Additional File 1: Note 1.2; [84]) to leave 1,030,234 SNPs for admixture analysis. Based on five replicates, three clusters (K=3) was determined to best explain the data (average cross validation error = 0.3073). Two dogs and one wolf were eliminated from the sample set because they exhibited over 5% admixture (Additional File 1: Note 1.3).
Following elimination of admixed samples, we called SNPs in 43 village dogs and 11 gray wolves using GATK which resulted in 7,657,272 sites (Additional File 1: Note 1.4). Using these SNPs, we calculated relatedness and subsequently removed samples that exhibited over 30% relatedness following identity by state (IBS) analysis with PLINK v1.90 (--min 0.05; Additional File 1: Note 1.5; [84]). Only one sample, a mexican wolf, was removed from the sample set as it was highly related to another mexican wolf in the dataset. Principle component analyses were completed on the remaining 53 samples (43 dogs and 10 wolves) using smartpca, a component of Eigensoft package version 3.0 [85] after randomly thinning the total SNP set to 500,000 sites using PLINK v.1.90 [86]. Once PCA confirmed clear genetic distinctions between the dogs and wolves, this final sample set was used for subsequent FST selection scans. To ensure that SNP choice did not bias the detection of selective sweeps, we generated a second SNP set under a particular ascertainment scheme, which only sampled sites variable in New World wolves (NWWs; a Great Lakes wolf, Mexican wolves (N=2), and Yellowstone wolves (N=2)), generating a SNP set containing 2,761,165 sites.
FST Selection Scans
To ensure that our inferences were robust to SNP choice, FST pipelines were completed on the two differentially called SNP sets described above. Allele frequencies were identified for dogs and wolves separately using VCFtools (--min-alleles 2 --max-alleles 2 -- recode; [87]) for both the total and NWW SNP sets. To minimize biases associated with the SNP filtration of the NWW SNP set, the allele frequencies of the NWWs were not included in the FST calculations for this SNP set.
Dog and wolf allele counts were used to calculate the fixation index (FST) using the estimator developed in [88]. For all FST selection scans, the autosomes and the pseudoautosomal region (X-PAR) of the X chromosome (chrX: 1-6650000) were analyzed separately from the nonpseudoautosomal region (X-NonPAR) of the X (chrX: 6650001-123869142). The Hudson FST value was calculated in 200kb sliding windows that either did not overlap or were in tiled with 50kb spacing across the genome. Each window was required to contain at least 10 SNPs. Additionally, a per site FST was calculated for each SNP that did not have missing data in any sample. For all three FST approaches, Z-scores were obtained for each window or site. Z-scores greater than or equal to 5 standard deviations was deemed significant for autosomal and X-PAR loci, and 3 for the X-NonPAR. For additional methods and results, see Additional File 1: Note 2.
Genotyping additional canines at CDRs
Forty-six additional canines (e.g. breeds, jackals, coyotes, etc.) were genotyped at CDRs identified in this study, Axelsson et al. 2013, and Cagan and Blass 2016, using autosomal SNPs previously called in [26] (Additional File 15: Table S8). These samples include ancient German dogs, HXH and CTC, that are approximately 7 and 5ky old, respectively [89]. An ancient dog from Newgrange, Ireland (~5ky old; [25]) was also used. SNPs within CDRs of interest were extracted from the [26] dataset using the PLINK make-bed tool with no missing data filter. We note that only CDR SNPs examined in our FST scans were utilized to create matrices and non-reference allele proportions, and these analyses were only completed using the SNP set (total or NWW) that achieved significance from the FST analysis (Table 1). If both sets were significant for a CDR, then the total SNP set was used since this set has higher SNP counts.
Per sample, each SNP was classified as 0/0, 0/1, or 1/1 at all CDRs (1 representing the non-reference genome allele), and this genotype data was stored in Eigenstrat genotype files, which were generated per window using convertf (EIGENSOFT package; [90]). Custom scripts then converted the Eigenstrat genotype files into matrix formats for visualization using matrix2png [91]. The full set of genotype matrices for the autosomes can be found in Additional File 3: Dataset 1.
We classified a sample as dog-like or wolf-like based on the proportion of non-reference or “wild” alleles (0/1 or 1/1) within a CDR. The threshold for determining outlier samples was calculated based on the average proportion observed in the 43 village dogs used in the FST analysis, of which the outlier threshold was determined to be greater than one standard deviation above the village dog mean. Additional File 15: Table S8 provides full results for non-reference allele proportions (Spreadsheets 1 and 2) and outlier identifiers (Spreadsheet 3) per Pendleton CDR, and all plots are within Additional File 4: Dataset 2.
Gene Enrichment and Variant Annotation
Coordinates and annotations of dog gene models were obtained from the Ensembl release 81 (ftp://ftp.ensembl.org/pub/release-81/ and http://useast.ensembl.org/Canis_familiaris/Info/Index, respectively), and a non-redundant annotation set was determined. The sequence of each Ensembl protein was BLASTed against the NCBI non-redundant database (blastp -outfmt 5 -evalue 1e-3 -word_size 3 -show_gis -max_hsps_per_subject 20 - num_threads 5 -max_target_seqs 20) and all blastp outputs were processed through BLAST2GO [92] with the following parameters: minimum annotation cut-off of 55, GO weight equal to 5, BLASTp cut-off equal to 1e-6, HSP-hit cut-off of 0, and a hit filter equal to 55. Positions of all predicted FST and VST domestication loci (CDRs) were intersected with the coordinates of the annotated Ensembl canine gene set to isolate genes within the putatively swept regions. Gene enrichment analyses were performed on these gene sets using topGO [34]. The predicted effects of SNP variants were obtained by the processing of the total variant VCF file of all canine samples by SNPEff [32] and Variant Effect Predictor (VEP; [31]). For full methods, please see Additional File 1: Note 3.
Copy Number Estimation Using QuicK-mer and fastCN
We implemented two CN estimation pipelines to assess copy-number for the 43 village dogs and 10 gray wolves using the depth of sequencing reads. The first, fastCN, is a modified version of existing pipelines that considers multi-mapping reads to calculate CN within 3kb windows. (Additional File 1: Note 4). Related pipelines based on this mapping approach have been successfully used to study CNV in diverse species [93-96]. By considering multi-mapping reads, copy-number profiles will be shared among related gene paralogs, making it difficult to identify specific sequences that are potentially variable. This limitation is addressed by the second pipeline we employed, QuicK-mer, a map-free approach based on k-mer counting which can accurately assess CN in a paralog-sensitive manner (Additional File 1: Note 5). Both pipelines analyze sequencing read-depth within pre-defined windows, apply GC-correction and other normalizations, and are able to convert read depth to a copy-number estimate for each window. The signal-to-noise ratio (SNR), defined as the mean depth in autosomal control windows divided by the standard deviation, was calculated for the 53 dogs and wolves that were used for FST analysis. The CN states called by both the QuicK-mer and fastCN pipelines are validated through comparison with aCGH data from [46]. Regions with copy number variation between samples in the aCGH or WGS data were selected for correlation analysis. (Additional File 1: Note 6.3).
VST Selection Scans
VST values [44] were calculated for genomic windows that have evidence of copy number variation using both the QuicK-mer and fastCN pipelines. A higher VST value indicates a divergent copy number state between the wolf and village dog populations. We identified outlier regions as windows exhibiting at least a 1.5 copy number range across all samples, and ZFST scores greater than 5 on the autosomes and pseudoautosomal region on the X, or greater than 3 in the X non-pseudoautosomal region. Prior to analysis, estimated copy numbers for male samples on the non-PAR region of the X were doubled. Outlier regions with more than one window were then classified as variant candidate domestication regions (VCDRs) (Additional File 9: Table S4). A similar analysis was performed for the unplaced chromosomal contigs in the CanFam3 assembly (Additional File 17: Table S10). See Additional File 1: Note 7 for additional methods and details.
Amylase Structural Variant Analysis
We estimated copy-number using short-read sequencing data from each canine listed in Additional File 15: Table S8 with the methodology described in [26]. CN estimations for the AMY2B gene using fastCN were based on a single window located at chrUn_AAEX03020568: 4873-8379. See Additional File 1: Note 8.1.1 for further methods and results.
Droplet digital PCR (ddPCR) primers were designed targeting overlapping 1.9Mb and 2.0Mb duplications, the AMY2B gene, and a CN control region (chr18: 27,529,623-27,535,395) found to have a CN of 2 in all sampled canines by QuicK-mer and fastCN. CN for each target was determined from ddPCR results from a single replication for 30 village dogs, 3 New Guinea singing dogs, and 5 breed dogs (Additional File 11: Table S6) and averaged from two replicates for 48 breed dogs (Additional File 12: Table S7). For more details on primer design, methods and results for the characterization of the AMY2B locus, see Additional File 1: Note 8.1.2.
Inversion analysis
The VCF file for the 53 samples analyzed in the FST pipeline was separated into village dog and wolf files, and further split by chromosome. We ran the inveRsion [97] program that utilizes the inversion model from [97,98] to locally phase genotype data and link haplotype blocks to positions of putative inversion breakpoints. These blocks are then used by InveRsion to distinguish samples containing each inversion. The total results for all inversions can be found in Additional File 18: Table S11.
Funding
This work was supported by R01GM103961 (AB and JMK) and T32HG00040 (AP). DNA samples and associated phenotypic data were provided by the Cornell Veterinary Biobank, a resource built with the support of NIH grant R24GM082910 and the Cornell University College of Veterinary Medicine.
Availability of data and materials
The datasets supporting the conclusions of this article are available in the article and its additional files, as well as a custom UCSC track hub (https://raw.githubusercontent.com/KiddLab/Pendleton_2017_Selection_Scan/master/Selection_t_rack_hub.txt). Software (fastCN and QuicK-mer) implemented in this article are available for download in a GitHub repository (https://github.com/KiddLab/). Pre-computed 30-mers from the dog, human, mouse, and chimpanzee genomes can be downloaded from http://kiddlabshare.umms.med.umich.edu/public-data/QuicK-mer/Ref/ for QuicK-mer processing. Genome sequence data for three New Guinea singing dogs was published under project ID SRP034749 in the Short Read Archive.
Author contributions
JMK, ALP, and FS designed the study. JMK oversaw the study. Selection scans were performed by ALP, AT, and FS. AT and ALP assessed population structure. CNVs were estimated by FS and JMK. Functional annotations and enrichment analyses were performed by ALP. FS processed aCGH data. KV processed ancient dog samples. Samples and genome sequences were provided by KV, AB and JMK. SE performed the DNA extractions, library generation, and ddPCR analyses. ALP, FS, and JMK wrote the paper with input from the other authors.
Competing interests
ARB is a cofounder and officer of Embark Veterinary, Inc., a canine genetics testing company.
Materials & Correspondence
Correspondence and material requests should be addressed to Jeffrey M. Kidd (jmkidd{at}med.umich.edu).
Additional Files
Additional File 1: Supplementary methods and results. (PDF 73kb)
Additional File 2: Table S1. Coordinates and annotations of FST candidate domestication regions (CDRs). (XLSX 8.3Mb)
Additional File 3: Dataset 1. Genotype matrices of autosomal FST candidate domestication regions (CDRs) in 98 canines. (PDF Xkb)
Additional File 4: Dataset 2. Non-reference allele proportions of autosomal FST candidate domestication regions (CDRs) in 98 canines. (PDF 2.2Mb)
Additional File 5: Table S2. Gene enrichment results for FST candidate domestication regions. (XLSX 60kb)
Additional File 6: Supplementary Figures S1-S7. (PDF 1.8Mb)
Additional File 7: Dataset 3. fastCN and QuicK-mer copy number validations with Ramirez et al. 2014 aCGH probe intensities. (PDF Kb)
Additional File 8: Table S3. Total VST outlier regions. (XLSX 111Kb)
Additional File 9: Table S4. Coordinates of VST candidate domestication regions (VCDRs). (XLSX 85Kb)
Additional File 10: Table S5. Gene enrichment results for VST candidate domestication regions (VCDRs). (XLSX 64Kb)
Additional File 11: Table S6. ddPCR results from 30 village, 3 New Guinea singing, and 5 breed dog samples of AMY2B segmental duplications. (XLSX 60Kb)
Additional File 12: Table S7. ddPCR results from 48 breed dog samples of AMY2B segmental duplications. (XLSX 55Kb)
Additional File 13: Dataset 4. fastCN chr9 SNP correlation plots. (PDF 5.6Mb)
Additional File 14: Dataset 5. QuicK-mer chr9 SNP correlation plots. (PDF 2.8Mb)
Additional File 15: Table S8. Description and accession numbers for canine genomes processed in this study. (XLSX 75Kb)
Additional File 16: Table S9. Non-reference allele proportion tables for FST CDRs. (XLSX 121Kb)
Additional File 17: Table S10. Coordinates of VST candidate domestication regions on chromosome unknown. (XLSX 48Kb)
Additional File 18: Table S11. Inversions called in 43 village dogs and 10 gray wolves. (XLSX 64Kb)
Additional File 19: Dataset 6. Supplemental QuicK-mer validation figures. (PDF 1Mb)
Additional File 20: Dataset 7. Copy number plots of outlier VST regions. (PDF 6Mb)
Acknowledgements
We thank Shiya Song for advice and assistance in the processing of canid variation data and Laura Botigue for discussion of results utilizing ancient DNA.
Abbreviations
- aCGH
- array comparative genomic hybridization
- CDR
- candidate domestication region
- chrUn
- chromosome unknown
- CN
- copy number
- CNV
- copy number variation
- ddPCR
- droplet digital polymerase chain reaction
- GO
- gene ontology
- NC
- neural crest
- NCC
- neural crest cell
- qPCR
- quantitative polymerase chain reaction
- SNP
- single-nucleotide polymorphism
- SNR
- signal to noise ratio
- VCDR
- VST candidate domestication region
Works Cited
- 1.↵
- 2.
- 3.↵
- 4.↵
- 5.↵
- 6.↵
- 7.
- 8.↵
- 9.↵
- 10.↵
- 11.↵
- 12.
- 13.↵
- 14.↵
- 15.↵
- 16.↵
- 17.↵
- 18.↵
- 19.↵
- 20.↵
- 21.↵
- 22.↵
- 23.↵
- 24.↵
- 25.↵
- 26.↵
- 27.↵
- 28.↵
- 29.↵
- 30.↵
- 31.↵
- 32.↵
- 33.↵
- 34.↵
- 35.↵
- 36.↵
- 37.↵
- 38.↵
- 39.↵
- 40.↵
- 41.↵
- 42.↵
- 43.↵
- 44.↵
- 45.↵
- 46.↵
- 47.↵
- 48.
- 49.↵
- 50.↵
- 51.↵
- 52.↵
- 53.↵
- 54.↵
- 55.↵
- 56.↵
- 57.↵
- 58.↵
- 59.↵
- 60.↵
- 61.↵
- 62.↵
- 63.↵
- 64.↵
- 65.↵
- 66.↵
- 67.↵
- 68.↵
- 69.↵
- 70.↵
- 71.↵
- 72.↵
- 73.↵
- 74.↵
- 75.↵
- 76.↵
- 77.↵
- 78.↵
- 79.↵
- 80.↵
- 81.↵
- 82.↵
- 83.↵
- 84.↵
- 85.↵
- 86.↵
- 87.↵
- 88.↵
- 89.↵
- 90.↵
- 91.↵
- 92.↵
- 93.↵
- 94.
- 95.
- 96.↵
- 97.↵


