

Abstract
Myelin around axons is currently widely studied by structural analyses and large scale imaging techniques, with the goal to decipher its critical role in neuronal protection. While there is strong evidence that in myelin, lipid composition and lipid membrane morphology are affected during the progression of neurodegenerative diseases, there is no quantitative method yet to report its ultrastructure in tissues at both molecular and macroscopic levels, in conditions potentially compatible with in vivo observations. In this work, we study and quantify molecular order of lipids in myelin at sub-diffraction scales, using label-free polarization resolved Coherent Anti Stokes Raman (PR-CARS), which exploits CARS sensitivity to coupling between light polarization and oriented molecular vibrational bonds. Importantly, the method does not use any a priori parameters in the sample such as lipid type, orientational organization and composition. We show that lipid molecular order of myelin in the mouse spinal cord is significantly reduced throughout the progression of experimental autoimmune encephalomyelitis (EAE), a model for multiple sclerosis, even in myelin regions that appear morphologically unaffected. This technique permits to unravel molecular-scale perturbations of lipid layers at early stage of the demyelination progression, while the membrane architecture at the mesoscopic scale (here about 100 nm) seems much less affected. Such information cannot be brought by pure morphological observation and opens new prospectives towards molecular-scale understanding of neurodegenerative diseases.
I. INTRODUCTION
The multilamellar myelin sheath wrapped around axons plays a crucial role for efficient transmission of nerve impulses, by acting as an electrical insulator1. One of the most important features defining the functionality of myelin is the extraordinary ability of its components to self-assemble into a highly ordered and stable structure2. This self-assembly is due to lipids (≈ 70% by dry weight) and proteins (≈ 30% by dry weight) which by interacting with each other form a tightly packed multilayered membrane with complex structure and lipid phases. In neurological disorders, this compact structure is highly perturbed3,4, leading to dysfunctions of the central nervous system (CNS). Numerous studies of the sequence of the myelin sheath degradation process in the CNS have been reported5,6, mostly concentrating on a mice model of multiple sclerosis (MS), the experimental autoimmune encephalomyelitis (EAE). The reported general patterns are the enlargement of individual myelin sheaths, due to an interlamellar splitting and loss of bilayer adhesion, swelling, and finally the formation of vesiculated myelin debris7,8.
Although the large malformations of the myelin ultrastructure in the advanced stages of demyelination have been reported, its finer structural variations at early stages remain poorly characterized, preventing a complete understanding of the molecular mechanism of myelin degradation in neurodegenerative diseases. So far, imaging techniques such as Transmission Electron Microscopy (TEM)1 and small angle X-ray diffraction (XRD)9,10 are used to access finer scales, however, they are highly invasive for the sample itself and lacking of biochemical specificity is also an issue. In addition, there are growing indications that the morphological alterations occur in conjunction with molecular modifications e.g. lipid composition (charged vs. uncharged11,12, saturated vs. unsaturated11,13) or lipid phases14–17 in the myelin sheath, which may contribute to the loss of lipid membrane inter-layer adhesion, budding and vesiculation18.
Being able to image those fine structural or molecular alterations in the myelin sheath during degradation is thus of critical importance for a better understanding of the course of the demyelination progression. Among optical techniques that encompass Optical Coherent Tomography19, confocal reflectance20, nonlinear optics21,22, Coherent Anti-Stokes Raman Scattering (CARS) microscopy is particularly interesting for its label-free nature, its chemical specificity and its spatial resolution of a few hundreds of nanometers. In CARS, a pump field (frequency ωp) and a Stokes field (ωs) interact with the sample to generate an anti-Stokes field at frequency 2ωp − ωs, which is enhanced when ωp − ωs is tuned to the resonant frequency of a Raman band23–25. By addressing lipid molecules by their CH vibration bonds, which are highly abundant in the myelin sheath, CARS microscopy has been used to image myelin in the mouse brain26,27, nerves of the peripheral nervous system28,29, as well as spinal cord tissues13,14,27,30–34 including during the progression of EAE14,27,32. Using CARS images, the commonly used parameter in the assessment of the myelin health by its morphology is the g-ratio, defined as the ratio between the inner and outer diameter of myelin fibers14,28–30,33,35. This parameter however does not give any information on the possible molecular alterations. Furthermore, association of CARS with confocal Raman microspectroscopy has evidenced a higher degree of lipid unsaturation at sites of degraded pathological myelin, a feature that is associated with higher lipid-packing disorder13. These findings suggest that lipid organization is affected in EAE tissues, even before any clear morphological sign of damage13.
In this prospect, polarization-resolved CARS (PR-CARS) has been developed, which exploits the sensitivity of CARS to the coupling between incident excitation polarizations and the orientation of CH bond vibrations in lipids36. In PR-CARS, the rotation of the incident pump and possibly Stokes linear polarizations generates a CARS signal modulation, which comes from the maximization of the CARS signal when the optical polarizations lie along the direction of the excited vibration modes37. In lipids PR-CARS imaging in myelin, where CH2 vibration modes are excited, this CARS modulation has been so far translated into a molecular order quantity supposing simple ”rigid lipid” models14,29,30,34,38. While being simplified, this model allowed to reveal changes of lipid organization due to demyelination in a murin model of Krabbe disease38, or in developmental myelination in the zebrafish spinal cord34. The ”rigid lipid” model however does not reveal a quantitative and physical picture of the orientational behavior of lipids in complex environments such as myelin. First, it supposes a unique lipid symmetry, ignoring possible variations in lipids conformations and composition. Second, it limits to the interpretation of angular order while another important information lies in the phase of the CARS signal modulation, which represents the average direction of molecular bonds within the optical focus of excitation. This orientation information brings insights into possible local deformations of the membrane at mesoscopic scales (~ 100 nm below the diffraction limit size), where membrane contour rupture or loss of lipid layer adhesion can occur for instance. Such scales are particularly important in the context of demyelination processes where lipid membranes are packed into multilayer structures. In this work, we use a generic approach by analyzing the complete information accessible from PR-CARS experiments, revealing both lipid order microscopic and mesoscopic scale behaviors in demyelination processes occurring in neurodegeneration. For this we use a more general symmetry decomposition supposing unknown orientational distribution of CH bonds36,39,40. By using such approach, we quantify the molecular order of CH bonds in myelin sheaths during active demyelination processes, as well as their averaged orientations, without any a priori knowledge on the lipid type, conformation or membrane shape. We show that PR-CARS signal modulation can inform on molecular scale disorder ultrastructure within the focal spot of optical resolution ~ 200 nm, but also at mesoscopic scales, which address modifications of molecular order over a distance of the image pixels size (typically ~ 100 nm). Performing PR-CARS analysis on spinal cord tissues taken from EAE mice at different stages of the disease, we show that early alterations of the myelin sheath occur at the molecular level, while the membrane architecture at the mesoscopic scale is seen to be particularly robust and mostly preserved until the formation of myelin debris. PR-CARS associated with such generic analysis is shown to be a potential tool for label free early detection of demyelinating disease progression.
II. MATERIALS AND METHODS
A. EAE induction and sample preparation
All experimental procedures were performed in accordance with the French legislation and in compliance with the European Community Council Directive of November 24, 1986 (86/609/EEC) for the care and use of laboratory animals. The research on animals was authorized by the Direction Départementale des Services Vétérinaires des Bouches-du-Rhône (license D-13 − 055 − 21) and approved by the National Committee for Ethic in Animal Experimentation (Section N14; project 87 − 04122012). C57Bl6 mice were housed in cages with food and water ad libitum in a 12 h light/dark cycle at 22 ± 1C.
EAE was induced in seventeen C57Bl6 mice using MOG (35 − 55), a myelin oligodendrocyte peptide (75 µg in CFA, a complete Freund’s adjuvant, containing 800 µg of killed mycobacterium tuberculosis) by s.q. injection into 3 different locations (bilaterally over the femur, and at the base of the tail), and pertussis toxin (400 ng) by i.p. injection on day 0 and 2. Additionally, a total of six control C57Bl6 animals were used. Three of them received injections of an antigen-free emulsion (CFA containing 800 µg of killed mycobacterium tuberculosis), and pertussis toxin on day 0 and 2. First clinical signs typically arised 13 − 14 days post-induction and were translated into clinical scores as follows: 0, no detectable signs of EAE; 0.5, tail weakness; 1, complete tail paralysis; 2, partial hind limb paralysis; 2.5, unilateral complete hind limb paralysis; 3, complete bilateral hind limb paralysis; 3.5, complete hind limb paralysis and partial forelimb paralysis; 4, total paralysis of forelimbs and hind limbs (mice with a score above 4.5 to be killed); and 5, death.
For the ex vivo sample preparation, groups of animals were sacrificed when reaching predetermined clinical scores for subsequent imaging of the myelin content in the dorsal spinal cord. Spinal cords were dissected, post-fixed overnight at 4C and rinsed 3 times in phosphate buffer saline (PBS) prior to embedding in a 3% agarose matrix to ease handling and 3D positioning under the microscope. Care was taken to align the dorsal surface of the spinal cord with the upper surface of the agarose cube. Note that the fixation method did not affect the results presented in this work. A few measurements in fresh tissues were performed that revealed very similar data.
B. PR-CARS imaging
PR-CARS imaging (represented in Fig. 1a) was done using an OPO femtosecond laser source (80MHz 150fs, Coherent, Santa Clara, CA) with excitation wavelengths λp = 830 nm and λS = 1087 nm, temporally synchronized and spatially overlapped on the sample plane. The corresponding excited resonances correspond to lipid vibrations around 2850 cm−1 with a bandwidth 150 cm−1, dominated by the CH2 and CH3 stretching modes. The total power delivered to the sample is in the range of 10 mW, focused by a water immersion objective (40X/1.15W Nikon, Tokyo, Japan), which provides an optical resolution of about 250 nm. Imaging is performed in the epi inverted microscope geometry, using the dichroic mirror T770SPXR (Chroma Tech. Corp., Bellows Falls, VT). Scanning mirrors rate is 20 µs per pixel, over 30 µm size images (200 × 200 pixels). The nonlinear signal collected by the objective is filtered using a shortpass filter (ET750sp-2p8, Chroma Tech. Corp., Bellows Falls, VT) before being detected by a PMT (R9110, Hamamatsu, Shizuoka, Japan) in the spectral range of 650 nm using a bandpass filter 655AF50 (Omega Optical, INC.). Polarization imaging is done by rotating the linear polarization angle of the incoming beam in 10 steps over the range 0-170(Fig. 1b), using a NIR achromatic half wave plate (AHWP05M-980, Thorlabs, Newton, NJ) mounted in a motorized rotation mount (PR50CC, Newport, Irvine, CA). An image is recorded at each polarization step as explained in 41. This results in a polarimetric image stack (Fig. 1b) where each pixel contains a PR-CARS modulated response.

(a) Schematic view of the PR-CARS microscope. The vector E represents the direction of linear polarization of ωs and ωp(α angle), rotated by a half-wave plate (λ/2). DM, dichroic mirror; x/y, galvanometric mirrors; P, polarizer; PMT, photomultiplier tube; OBJ : objective. (b) Example of PR-CARS data (left panel) recorded in one pixel (right panel) of the myelin sheath region (control sample), averaged over the diffraction limit size (schematically represented by a circle). Scale bar: 5 µm. (c) Top: Schematic of the multilamellar lipid membrane in the focal spot (represented as a circle) and zoom on a lipid showing the dominant nonlinear bond dipoles (red arrows) probed by PR-CARS. Bottom: distribution function p(φ) read-out from PR-CARS (see text), as a sum of orders of symmetry. (d) Large scale CARS image (total intensity summed over 18 input polarization angles) of a spinal cord tissue (score 1.5). Scale bar: 50 µm.
C. Data processing and analysis
The quantification of molecular order from PR-CARS measurements was previously described in39,40. Briefly, both linearly polarized incident pump (Ep) and Stokes fields (Es) are rotated with a variable angle α relative to the sample plane horizontal axis X (Fig. 1a,b). The PR-CARS response is then analyzed to retrieve orientational parameters from the lipid assembly present in the focal volume of the objective. The PR-CARS signal is derived from a bond additive model where individual CH molecular bonds (represented as arrows in Fig. 1c) form the excited vibrational modes. These molecular bonds are organized into a 2D effective distribution function p(φ), that can be decomposed over its symmetry orders (Fig. 1c):
 where p0 is the isotropic contribution to the angular distribution, (p2, q2) are its second order symmetry components and (p4, q4) its fourth order symmetry components. This decomposition allows to avoid any hypothesis on the measured vibrational modes population, which could come from different types of lipids and different lipid conformation.
The molecular bonds add-up coherently to form the CARS nonlinear coherent radiation, which intensity is decomposed on a circular basis (See Supporting Material):

The (an, bn) coeffcients are directly calculated from the recorded polarization-dependent image stack, by projection on circular basis functions.
In the PR-CARS data analysis, the (pn, qn) parameters are then deduced from the (an, bn) coeffcients following the relations derived in39,40 (See Supporting Material). To define the properties of the distribution function parameters measured for each pixel of the PR-CARS image, we introduce the magnitudes (S2, S4) and orientations (φ2, φ4) of the second and fourth symmetry order contributions respectively:


The anisotropic nature of an angular distribution function is mainly quantified by its contribution S2 and main orientation φ2, while S4 and φ4 quantify the shape (smooth versus sharp) of this distribution. It is convenient to rewrite S4 as a symmetric component that is of cylindrical symmetry along φ2 (denoted  ) and an asymmetric contribution (denoted
  )42:
)42:

In particular if the distribution is of cylindrical symmetry, then φ2 = φ4 or φ2 = φ4 ± 45°, and  . Theoretical analyzes on modeled angular distribution functions show that the parameters
  permit to discriminate between different shapes of molecular angular distributions39,42.
In practice, the selection of the relevant pixels to be analyzed is performed on the basis of the total CARS intensity image obtained by summing for each pixel the signal obtained for all angles α. To perform intensity thresholding based on criteria discussed below, the PR-CARS intensity is averaged over 3 × 3 pixels and only pixels which total intensity is above 75% of the threshold are considered. Pixels corresponding to the signal from the myelin sheath and its different morphological variations are manually selected using a polygon selection tool of Matlab (The MathWorks, Natick, MA). For the estimation of the g-ratio parameter in straight myelin sheaths, the ginput function of Matlab (The MathWorks, Natick, MA) is used. We made sure that the myelin sheaths regions selected to calculate the molecular order parameters corresponds to g-ratio values within a range of 0.05 relative to the mean g-ratio of the given population. The retrieved molecular order parameters  are indicated with their mean and standard deviation values, measured over a large collection of myelin sheaths regions for each given population. Statistical significance was determined using ANOVA tests performed over those populations with (* : p ≤ 0.05) considered as statistically significant; (** : p ≤ 0.01) as highly statistically significant; (*** : p ≤ 0.001) as extremely statistically significant.
III. RESULTS
Fig. 1d shows a typical CARS image of myelin sheaths in a mouse spinal cord, imaged at about 20 − 30 µm below the spinal cord surface with linear polarization excitation along the spinal cord axis. The CARS signal is dominated by symmetric and antisymmetric CH2 stretching vibrations of hydrocarbon chains from lipids (2845 cm−1 and 2885 cm−1 respectively) which are the major components of myelin. CH3 stretching vibration of proteins (2930 cm−1) also contribute to a lesser extent, since they constitute 15 − 30% of the weight of the myelin sheath13,14. Fig. 1d and the zoomed view of Fig. 1b show longitudinal sections of lipid multilayers of about 3 − 5 µm in total diameter, wrapped around axons. The myelin morphology is seen to be strongly affected when the EAE score disease increases, from straight myelin tubular structures to swelled features (appearing at score 1) coming from vesiculated myelin, and finally to the formation of debris with spherical shapes of various sizes, coming from disrupted myelin detached from the axon (with a major proportion at scores 2.5 and 4).
A. Molecular order of lipids in the myelin sheath
A PR-CARS polarization analysis has been performed on zoomed-in regions of the myelin sheath structure, using a high sampling pixel size of 100 nm. Fig. 2 shows typical PR-CARS results in a spinal cord of a control tissue.
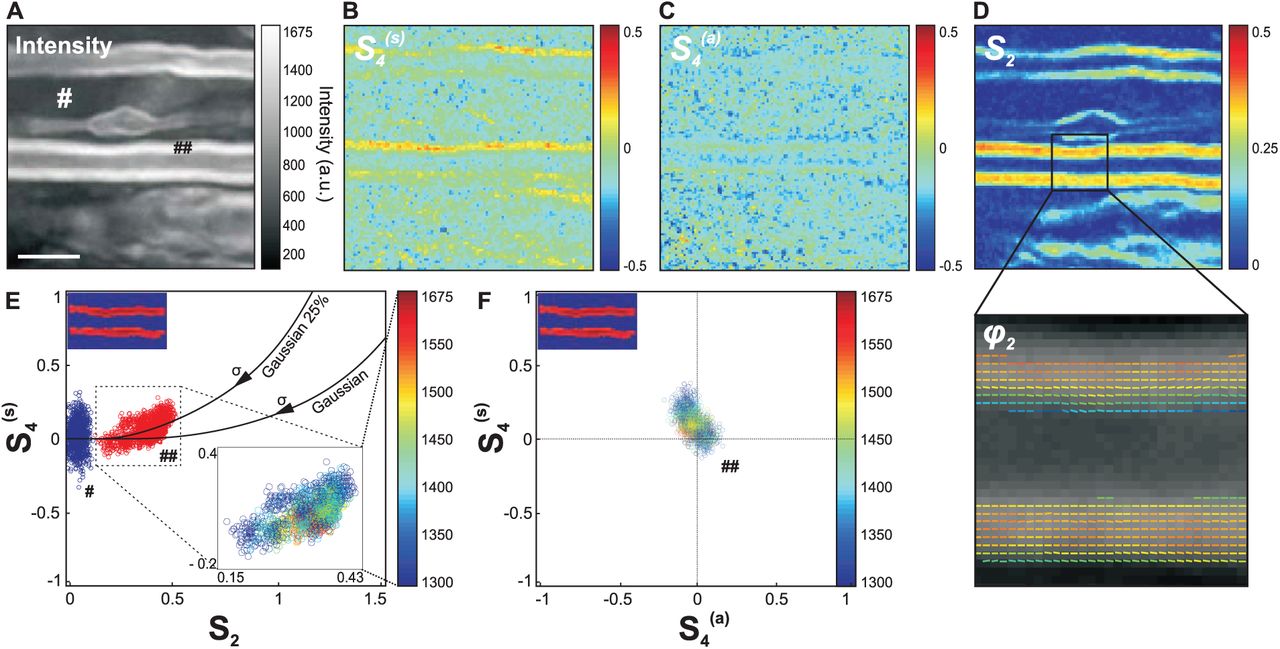
(a) PR-CARS (centered at 2845 cm−1) total intensity image (sum over 18 input polarization angles) of the myelin sheath from a spinal tissue (control sample). Scale bar: 5 µm. (b) Corresponding  map. (c)
  map. (d) S2 map. For those maps (not for data analysis) the PR-CARS intensity is averaged over 3 × 3 pixels. A region of the S2 map is zoomed-in to make more visible the complete orientational information, represented by a stick oriented with the φ2 angle with respect to the horizontal axis, and which color is S2. (e) Experimental values of S2,
  taken at intensities above threshold 1300 analog signal value in the myelin sheath (♯♯ in the intensity image (a)) and at lower intensity signals from a surrounding background (♯ in the intensity image (a)). For the myelin sheath region, the inset image is color coded in intensity. Solid lines: theoretical
  values for a Gaussian distribution of increasing width σ, and Gaussian superimposed with an isotropic distribution of proportions 25 %. (f)
  scatter plot following similar color coded intensity scale as in (e).
The interpretation of the measured  values depicted in Fig. 2b-d requires a rigorous control of measurement conditions, in order to avoid bias and error sources (see Supporting Material). Briefly, the intensity level is set above a threshold that guaranties standard deviations of S2 below 0.02, and of
  below 0.08 (see Fig.S1 in the Supporting Material). A residual but not significant intensity-dependent bias is also systematically removed (see Fig.S1 in the Supporting Material). The S2 values additionally suffer from a bias due to the presence of non-resonant background40, which can be tolerated in relative comparison studies and therefore not removed. Another source of bias can also occur due to the out-of plane orientation of the measured distributions, S2 values being at their maximum when the distribution lies in the sample plane. This effect is excluded by a control of the plane of focus at the equatorial plane of the myelin sheath (see Fig. S2 in the Supporting Material). At last, birefringence is seen to lead to negligible bias of the deduced values at the depths of measurement used in this analysis (see Fig. S3 in the Supporting Material). Note that scattering from the spinal cord tissue can be also neglected, previous studies have indeed shown that effects due to the detected multiply scattered light in epi geometry do not affect the polarization CARS signals as long as the total intensity (non-analyzed detection) is recorded43.
The S2 image is strongly contrasted (Fig. 2d), which is consistent with the tight packing of lipids in the multilamellar structure of myelin, while the background is isotropic (S2 = 0). The φ2 image (Fig. 2d) shows additionally that the general orientation of CH bond dipoles in the equatorial plane is along the myelin tubular axis, as expected from lipids chains oriented radially in a concentric axonal structure. The fourth order symmetry of the CH bonds distribution provides additional information, since  is clearly above the surrounding background (Fig. 2b,e). The
  experimental values are plotted together as a scatter graph in Fig. 2e to provide a finer interpretation of the CH bonds orientational distribution in the lipid multilamellar structure. Importantly, the measured order parameters are seen to not depend on the intensity (Fig. 2e), which excludes experimental artifact related to noise level. Continuous lines on this graph represent theoretical dependencies expected from different orientational distributions of CH bonds, that span similar regions as experimental values. For a Gaussian distribution of width σ, S2 is expected to grow with decreasing σ, without considerable increase of
  except at low widths (σ < 80°). The measured
  values are however higher than expected from a Gaussian distribution. This can be explained by the presence of an isotropic angular population superimposed to a Gaussian function42, which could occur from small disordered regions in the focal volume, such as sub-diffraction size vesicles. Fig. 2e depicts different cases of distributions composed of η % of an isotropic population superimposed with (100 − η) % of a Gaussian population, showing that the measured values correspond to η ≈ 25 % (accounting for the fact that S2 is probably slightly underestimated due to the presence of non-resonant background). At last,
  (Fig. 2c,f), confirming the cylindrical symmetry of the orientational distribution of bonds in the lipid organization. In what follows, S4 will be often used as a shortened notation for
  , and
, and  will be discarded.
Overall, the average values < S2 >= 0.33 ± 0.05 and < S4 >= 0.10 ± 0.07 obtained in the myelin sheath depicts a molecular order contained in an angular width of about σ ≈ 80°. Interestingly, this order is not far from that observed in model membranes; PR-CARS performed in multilamellar vesicles (MLVs) made of pure lipids indeed show that < S2 >≈ 0.22 in dioleoylphosphatidylcholine (DOPC) MLVs and < S2 >≈ 0.40 in dipalmitoylphosphatidylcholine (DPPC) MLVs, the latter exhibiting a higher liquid order phase transition temperature (see Fig.S4 in Supporting Material). The presence of several lipid types and proteins in the myelin sheath visibly does not enlarge considerably the CH bonds angular distributions as compared to MLVs, confirming the tight organization of lipids along the axons. Looking closer at standard deviations however, the orientational behavior of CH bonds exhibits a higher level of heterogeneity than in MLVs (see Fig.S4 in Supporting Material), which is coherent with their diversity and the complexity of the inter-lamellar interactions in myelin.
B. Relation between lipid packing orientational order and myelin morphology
During demyelination, the compact multilamellar structure of myelin undergoes swelling and degradation, until the formation of detached debris. In this section we investigate if there is a correlation between the morphology of the myelin sheath and lipid order measured by PR-CARS, regardless of the score of the EAE disease progression. A more quantitative comparison between scores will be given in the next section.
PR-CARS measurements were performed at different stages of the EAE disease progression in mice, from control to score 4. CARS imaging was first performed to localize areas on fixed spinal tissues, chosen randomly over several mm distances. Second, PR-CARS was performed in several small ROIs (typically 20 × 20 µm size) at various places. CARS images permitted to determine five categories which are considered as representative of the different characteristic morphological features observed during the demyelination process, depicted in Fig. 3a: ”normal” myelin has a compact structure, with visible straight borders forming a tubular structure around the axon; ”swollen” myelin defines more loose membrane formations; ”blebbed” denotes a later stage of swelling, which forms a more pronounced protrusion outside of the straight myelin sheath structure; ”debris” denotes a lipid multilamellar spherical structure from vesiculated myelin, that has detached from the myelin sheath. Such debris, reported in the literature7,8, are found in two categories: “non filled debris”, which show no lipid signal at their center, and filled debris that are pure lipids volumetric structures. We observed an increased amount of damaged or vesiculated myelin with the progression of the disease as previously reported13,32.

PR-CARS analysis of the different characteristic morphological features visible in the demyelination process. (a) Total intensity images taken from clinical score 1 (left) and 2 (right). Symbols (*, ♯, *♯) refer to different membrane locations. White square region of interests (ROIs) are used for statistical analysis in (b). Scale bars: 5 µm. (b) Left: S2 maps (superimposed on the intensity image) of characteristic features of myelin degradation in white ROIs of (a): ’healthy’ myelin, ’swollen’, ’blebbed’ and products of degradation: ’debris not filled (NF)’ and ’debris filled (F)’. Middle: corresponding histograms of S2 values, taken within the dashed square ROIs in (b). Right: combined images of S2 and φ2, showing S2 as a colorscale and φ2 as the orientation of sticks for each measured pixel. (c) Schematic morphological interpretation of the myelin multilayer (enlarged) in positions in (a) corresponding to (*) ’healthy’, (*♯) ’swollen’ and (♯) ’blebbed’ myelin. The circular region represents the focal spot (not to scale).
For each category we measured molecular order of CH bonds, deducing (S2, S4) from PR-CARS data. We did not observe significant changes of S4 in this study, therefore this parameter is omitted in what follows. Fig. 3b (left) depicts zoomed-in images of the S2 parameter measured on each type of category. The S2 histograms (Fig. 3b, middle) collected for each of those characteristic regions illustrate the heterogeneity of molecular order in degraded myelin. At last, the mean orientation (φ2) are represented in these regions (Fig. 3b, right) depicts the spatial properties of such molecular order in healthy and damaged regions.
A few key observations can be made: (1) the average S2 values decrease from normal (S2 ≈ 0.30) to swollen (S2 ≈ 0.25) and blebbed (S2 ≈ 0.17) myelin, indicating loss of molecular scale order. Fig. 3c depicts such situations schematically, supposing that this disorder originates purely from morphological nanometric scale perturbations; (2) in blebbed and debris structures, S2 is more heterogeneous than in normal structures, with lower molecular order at the inner edge of the membrane; (3) molecular order in debris is preserved at their edge, with only inner membranes perturbed with high disorder. Lipid order in the periphery of not-filled debris is rather high as compared to filled debris, similarly as what has been observed in DPPC MLVs in which the filled structures exhibits a lower molecular order (see Fig.S4 in Supporting Material). In not-filled debris, CH molecular order can even reach values measured in normal myelin sheaths; (4) the overall orientation of CH bonds, illustrated by (S2,φ2) images, seems to follow the membrane macroscopic direction whatever the disorder, even for low S2 regions where the molecular scale disorder is high. This indicates that at the mesoscopic scale represented by the pixel size (here 100 nm), no strong modification of the membrane structure is found, while disorder is still rather occurring at a molecular/nanometric scale, averaged within the focal sport size. Overall these observations show that the transformation of normal, compact myelin structure into the final debris results in important local nanometric rearrangements of the multilamellar membrane structure, which seem to be able to persist over mesoscopic scale distances.
The values of molecular order measured here for a given region, stay valid over a large population of regions. Measurements performed on 359 regions (on average 70 regions per category) are summarized in global histograms in Fig. 4a. Independently of the stage of the EAE disease, normal myelin exhibits the highest degree of lipid packing (< S2 >= 0.32), which corresponds to the smallest aperture σ of the effective distribution function ≈ 80. The degradation of lipid packing in the myelin lamellar structure of swollen regions is manifested by a decrease down to < S2 >= 0.23, which correspond to an aperture σ of ≈ 100. In blebbed myelin, the averaged global order goes down to < S2 >= 0.14, which corresponds to an aperture σ of ≈ 120. Concerning myelin degeneration products, the outer membrane of not-filled debris exhibit an averaged order of < S2 >= 0.25, which is higher than for filled ones < S2 >= 0.17. All cases show significant differences between each others, except for not-filled debris which resemble normal myelin.

(a) General normalized histograms (over all measured pixels) of characteristic features of myelin degradation plotted for all measurements, regardless the clinical score of the EAE disease (about 1000 pixels per regions). Number of regions measured: normal myelin (N = 136), swollen (N = 91), blebbed (N = 82), debris filled (F) (N = 30), debris not-filled (NF) (N = 20). *** : p ≤ 0.001. (b) Corresponding standard deviations σS2 within each region, taken per category. Error bars are standard deviation values over all regions measured.
The heterogeneity of molecular order within these regions is seen to increase for degraded myelin, as compared to normal myelin (Fig. 4b). The standard deviation of S2 (σS2) shows that in normal myelin, a low standard deviation is measured (σS2 = 0.06). This value is not noise-limited (as visible in the low background value where σS2 = 0.03), but still characteristic of very homogeneous lipid packing. From normal to debris, this standard deviation increases with σS2 = 0.08 in swollen, blebbed myelin and not-filled debris, and σS2 = 0.09 in filled debris. The filled debris regions indeed exhibit a very wide histogram, mostly due to the fact that in these structures the inner membrane shows very disordered characteristics.
C. Evolution of lipid organization in the myelin sheath with the progression of EAE
The different myelin morphological features described above, which characterize demyelination, were visible in all samples independently of the EAE clinical score, even though their occurrences varied from score to score. In this Section, we evaluate how S2 in these different regions, depends on the clinical scores of EAE. This should allow an assessment of the finer evolution of myelin microscopic-scale properties during neurodegeneration. For each measured score, two spinal cords have been imaged with equal number of regions per spinal cord, except for score 4 where only one spinal cord was measured. Additionally, injection of complete Freund’s adjuvant (CFA sample) was produced in order to evaluate the consequence of the induction of an inflammation which is not specific to EAE.
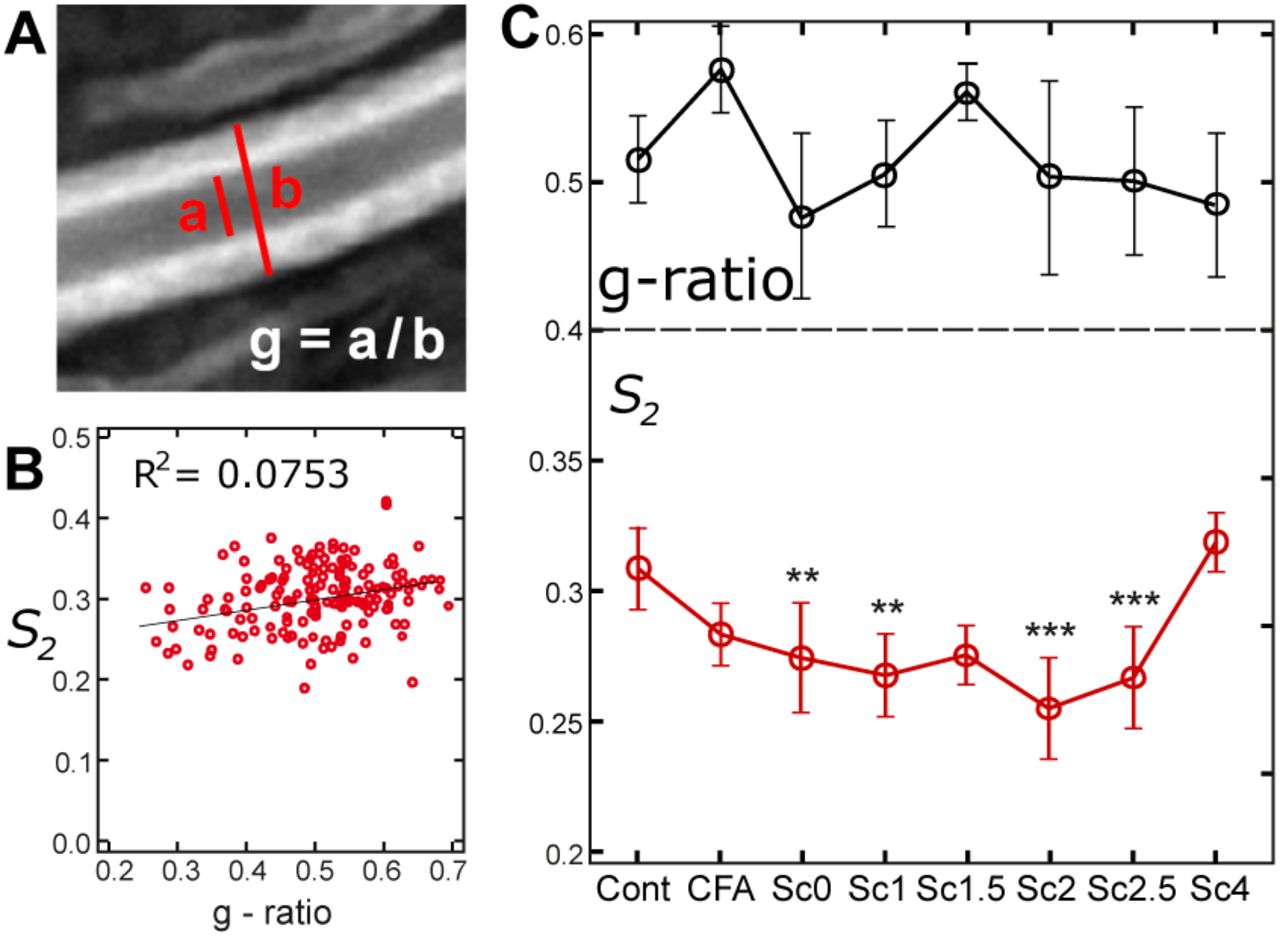
First, normal myelin can be classified depending on the thickness of its sheath. For this we quantified the g-ratio of all measured normal-looking myelin sheaths, defined by the ratio between the inner to the outer diameter of the myelin membrane (Fig. 5a). Values of g-ratio are found to be in the range from 0.3 to 0.65, which is consistent with what has been reported in the literature14,30,33. When plotting the g-ratio values versus < S2 > values measured in all studied cases independently of the EAE score, only a slight correlation between the two parameters is visible (Fig. 5b). We also plotted g-ratio values for the different clinical scores of EAE (Fig. 5c). The variation of g-ratio values was seen to be very large even inside a given score population (as visible by the large standard deviations). Note that the high value measured for CFA samples might be due to myelin swelling, as a result of the immune response to the injection. Contrary to previous works28,44 that observed the thinning of myelin sheath (decrease of the g-ratio), we do not observe drastic trend of dependence between g-ratio and normal-appearing myelin condition during the progression of EAE.

(a) Measurement of the g-ratio in the equatorial plane of a myelin sheath, using the total intensity image (a: inner diameter, b: outer diameter, g-ratio is the ratio between the inner and outer diameters). (b) Mean < S2 > values of all measurements versus g-ratio, with linear interpolation and correlation coefficient of the fit. (c) Top: mean g-ratio values versus the EAE score. Bottom: S2 values versus different scores of EAE, for the myelin regions of normal morphology (see text). Statistical analysis is shown relative to the control sample: * : p ≤ 0.05, ** : p ≤ 0.01, *** : p ≤ 0.001. Number of regions considered in the analysis: control (N = 26), CFA (N = 30), score 0 (N = 28), score 1 (N = 17), score 1.5 (N = 9), score 2 (N = 22), score 2.5 (N = 19), score 4 (N = 11). Error bars are standard deviation values.
In contrast, more pronounced variations were observed in S2 values measured in myelin sheaths of normal morphology for different EAE clinical scores (Fig. 5c). S2 in normal myelin morphologies decreases indeed progressively from 0.33 ± 0.02 (control sample) down to 0.27 ± 0.02 (score 2.5). All values show statistically significant changes as compared to the control and CFA sample, except scores 1.5 and 4 which are poorer in statistics. Note that score 4 contains a very low number of healthy-looking myelin sheaths, therefore the high S2 values measured are probably originating from the few robust myelin sheaths that survived the progression of the disease. These data show overall that molecular order in the myelin sheath of normal morphology decreases with the clinical signs of the EAE disease. Note that this trend is also visible when taking all myelin morphology types together, however in this case the S2 population might contain regions dominated by isotropic disorder present in myelin blebs and debris, making the error margins larger. Interestingly, the CFA sample shows no significant difference with the control sample, which suggests that pure immune reaction due to the injection does not provoke modifications of lipid order in myelin. In contrast, the observed loss of molecular order in EAE cases is thus seen to be specific to the disease.
IV. DISCUSSION
Measuring molecular order in the myelin sheath by PR-CARS clearly permits to assess features in tissues that are not visible by pure (non PR) CARS imaging. The measurements performed highlight in particular that in the EAE demyelination process, the lipid multilayers organization of the myelin sheath is perturbed at a molecular/nanometric scale (as seen on S2 images), especially in the inner membrane region of the myelin sheath and from normal to swelled/blebbed myelin. This brings new elements of information in the understanding of lipid membrane behaviors in neurodegenerative diseases, which has been a topic of strong interest for decades. It has been reported that in the EAE pathology, different factors can contribute to the demyelination process, that cover molecular composition modifications and nanometric scale morphological changes. Even though PR-CARS microscopy cannot distinguish between those two factors, quantitative elements can be gained from the measured modifications of lipid molecular order. First, lipid composition changes have been reported in EAE models but not intensively studied. The existing observations have shown that lipids integrity (charge, degree of saturation) is altered to lead to an increase in membrane fluidity, and to a decrease of myelin adhesion that provokes vesiculation11,13. Our PR-CARS analyzes on the other hand have shown that going from a liquid disorder phase (typically DOPC MLV at room temperature) to liquid order phases (typically DPPC at room temperature) can shift the measured order parameter S2 from 0.2 to 0.4. Observations in the myelin sheath show modifications along the same range of magnitude, which could partly be explained by local modifications of the lipid composition. Second, the membrane morphology of myelin is likely to be affected at the nanometric scale, as known from X-ray diffraction45 and electron microscopy studies1. Numerical models in PR optical microscopy have shown that increasing a single lipid membrane curvature can lead to significant changes in the read-out of the S2 parameter. Typically, a 10 nm height change within the diffraction limited spot of 200 nm leads to an increase of S2 of 0.146. Reported local folding in demyelination processes, using X-ray diffraction, show that the highest efficiency of the myelin sheath to transfer an electrical impulse is reached when the lipid bilayers are highly compact against one to another, with a spacing of ≈ 3−4 nm between lipid layers45. An increase of spacing between bilayers (≈ 6 − 7 nm) has been seen to occur during the swelling process45. Our data suggest a decrease of S2 from normal to swollen of about 0.1, that could be consistent with such a small morphological modification. It is in particular likely that the PR-CARS measurements probes perturbations from well parallel stacked layers in normal myelin (* in Fig. 3a) to partly folded inter-layer membrane regions in swollen myelin (*♯ in Fig. 3a), and finally to completely folded multi-layer membrane regions in blebbed myelin (♯ in Fig. 3a). Note that the fact that lipid orders in not-filled versus filled debris behave similarly as in DPPC MLVs tends to favor interpretations in the direction of modifications of the nanometric-scale membrane morphological changes. It is indeed probable that membrane folds are decreased due to higher membrane tensions, as already observed in cell membranes46.
More information can been gained from the averaged orientation of the CH bonds organization (φ2 images). Interestingly, even though molecular order can be strongly affected locally, the averaged orientation of molecular bonds still follows the macroscopic membrane direction. This means that even though the perturbation occurs at the molecular scale (lipids composition and interaction changes) or at the nanometric scale (sub-diffraction membrane folds), the membrane cohesion is preserved at the mesoscopic scale ( 100 nm pixel size) (Fig. 3b). Long persistence lengths of φ2 values are clearly visible whatever the degree of nanometric scale disorder in the local membrane, which could also explain the capacity of such local disruptions to create longer scale damage events (swelling, blebbing), that extend spatially at up to micrometers distances and ultimately lead to debris.
A striking feature of this study is that in apparently normal myelin sheaths, even though the macroscopic morphology is similar from score to score, molecular scale lipid disorder increases with the EAE disease progression. This result emphasizes the potential of PR-CARS to reveal features that are not visible at a macroscopic scale, which is particularly interesting in the context of the monitoring of the evolution of a pathology. Note that normal myelin can be easily identified regardless of the clinical score, and could thus serve ultimately as a convenient and robust assessment of the disease. This study also shows that in the context of EAE, the more traditionally used g-ratio factor, which is based on macroscopic-scale morphological information, seems less robust. Previous works have reported the use of g-ratio as an assessment of a neuronal condition following crush lesion28,44 or chemically induced demyelination29,47. In the first case, the thinning of myelin sheath (decrease of the g-ratio) was observed as a result of demyelination for the nerves of straight morphology, such as seen in the peripheral nervous system. In spinal cord or brain samples, however, axon morphologies can depart from straight features, especially at pathological states where a number of shape abnormalities are detected27. In such cases the measurement of g-ratio can be more delicate and easily biased. In the second case, the assessment of myelin health by the g-ratio upon a chemically induced demyelination seems to be very different from that seen in autoimmune induction (EAE). In chemically induced demyelination, the myelin sheath enlarges entirely and g-ratio increases as a result of degradation of internal membranes, while in EAE the degradation of myelin due to internal swelling and splitting of membranes seem to appear more locally, leaving some parts of the myelin sheath intact.
V. CONCLUSION
In this work we have shown the possibility to probe, by PR-CARS, lipid orientational organization at the molecular level within the myelin sheath of mice spinal cord tissues, in the frame of demyelination and neurodegeneration. Modifications of lipid order have been found in myelin structures that seem morphologically unaffected, emphasizing the possibility of the technique to decipher processes that occur at early stages of demyelination. The higher degradation of lipids order have been found in the processes of swelling and blebbing, especially at the inner interface of the myelin sheath, an effect that is strong enough to induce long range deformations of the whole myelin sheath. This supports early findings which addressed local lipid modifications by biochemical analyzes, and advantageously complements such studies by imaging, which provides a way to address those questions potentially in vivo. Although the data are at this stage not spectrally resolved within the CH-based lipids vibration bands, for instance to discriminate saturated versus unsaturated lipids, future directions can be envisioned to study more precisely the origin of the observed phenomena by adding chemical specificity, at the expense however of lower signal levels. Ultimately if applied in vivo, this methodology could serve as a early stage detection for demyelinating diseases progression.
VI. AUTHOR CONTRIBUTIONS
P.G. performed the experiments, prepared all MLV samples and analyzed data; A.J. and F.D. prepared all spinal cord samples; F.-Z. B. developed data analysis tools; N.B., H.B.A, J.D., P.F., and H.R. contributed to analysis tools and experimental developments; S.B. designed research and analytic tools; P.G., S.B. and F.D. wrote the manuscript.
VII. ACKNOWLEDGMENTS
We thank D. Côté and A. Gasecka (Université Laval, Quebec, Canada) for providing the spinal cord slices used for birefringent measurements described in the Supporting Material. This work has been supported by CNRS, contracts ANR-15-CE19-0018-01 (MyDeepCARS), ANR-10-INBS-04-01 (France-BioImaging), ANR-11-INSB-0006 (France Life Imaging), and Conseil Regional Provence Alpes Côte d’Azur. F.-Z.B. received a scholarship from the Erasmus Mundus Doctorate Program Europhotonics (grant no. 159224-1-2009-1-FR-ERA MUNDUS-EMJD).
Footnotes
↵* sophie.brasselet{at}fresnel.fr
References


