

Abstract
Noncoding regulatory variants play an important role in the genetics of complex traits. Although quantitative trait locus (QTL) mapping is a powerful approach to identify these variants, many genetic effects may remain unobserved when cells are sampled in only one of a large number of possible environments. Using a novel induced pluripotent stem cell-derived system, we mapped QTLs regulating chromatin accessibility and gene expression in macrophages in four conditions mimicking the interplay between interferon-gamma response and Salmonella infection. We found that approximately 50% of condition-specific effects on gene expression altered chromatin accessibility prior to stimulation. Furthermore, 6% of the chromatin accessibility QTLs regulated multiple neighbouring regions and these interactions were modulated by stimulation, occasionally producing condition-specific changes in gene expression. Profiling additional states also doubled the number of expression QTLs that could be confidently colocalised with disease associations. Thus, a substantial fraction of disease-associated variants may affect ‘primed’ regulatory elements in naive cells.
Main text
Genetic differences between individuals can profoundly alter how their immune cells respond to environmental stimuli, influencing the amount of cytokines that the cells produce (1) and their gene expression patterns (2–5). These differences in cellular behaviour can subsequently modulate an individual’s risk of developing complex immune-mediated disorders. Although many interactions between genotype and environment have been identified in primary immune cells (2–5), only a limited number of primary cells can be obtained from a single individual, limiting both the number of stimuli and phenotypes that can be studied. However, for any given cell type, there can be scores of relevant stimuli, combinations of stimuli or timepoints at which stimulus response can be measured, each state potentially revealing different sets of regulatory variants whose functions are otherwise hidden in the unstimulated cells.
The limitation of cell numbers does not apply to cultured cells, such as human lymphoblastoid cell lines (LCLs). LCLs have been profiled on multiple levels including RNA sequencing (6, 7), chromatin accessibility (8, 9) and histone modifications (10, 11), elucidating how the effects of genetic variation propagate from chromatin to gene expression in a single environment (8–10). However, since LCLs are immortalised by infection with Epstein-Barr virus, they are not a suitable model for studying response to immunological stimuli. A promising new approach is to differentiate induced pluripotent stem cells (iPSC) into the cell type of interest. Human iPSCs have recently been derived from large number of unrelated individuals (12, 13) and differentiation protocols for many cell types are available. Macrophages, phagocytic cells of the immune system that have evolved to respond to a wide range of environmental signals (14), can now be differentiated relatively robustly from iPSCs (15, 16). Furthermore, we and others have recently shown that iPSC and monocyte derived macrophages exhibit highly correlated transcriptional response to inflammatory stimuli (16, 17).
We obtained iPSC lines from 123 healthy donors from the HipSci project (12) and differentiated them to macrophages using an established protocol (15). After rigorous quality control, we obtained highly pure (fig. S1) macrophages from 86 individuals (table S1). We used RNA-seq to measure gene expression of the differentiated macrophages in four experimental conditions: naive (N),18 hours IFNɣ stimulation (I), 5 hours Salmonella enterica serovar Typhimurium (Salmonella) infection (S), and IFNɣ stimulation followed by Salmonella infection (I+S). We also profiled chromatin accessibility with ATAC-seq (18) in a subset of 31–42 donors in the same four conditions (Fig. 1A). We chose these stimuli because they activate distinct, well characterised signalling pathways (Fig. 1B) and pre-stimulating macrophages with IFNɣ prior to bacterial infection is known to lead to enhanced microbial killing and stronger activation of the inflammatory response (19, 20).
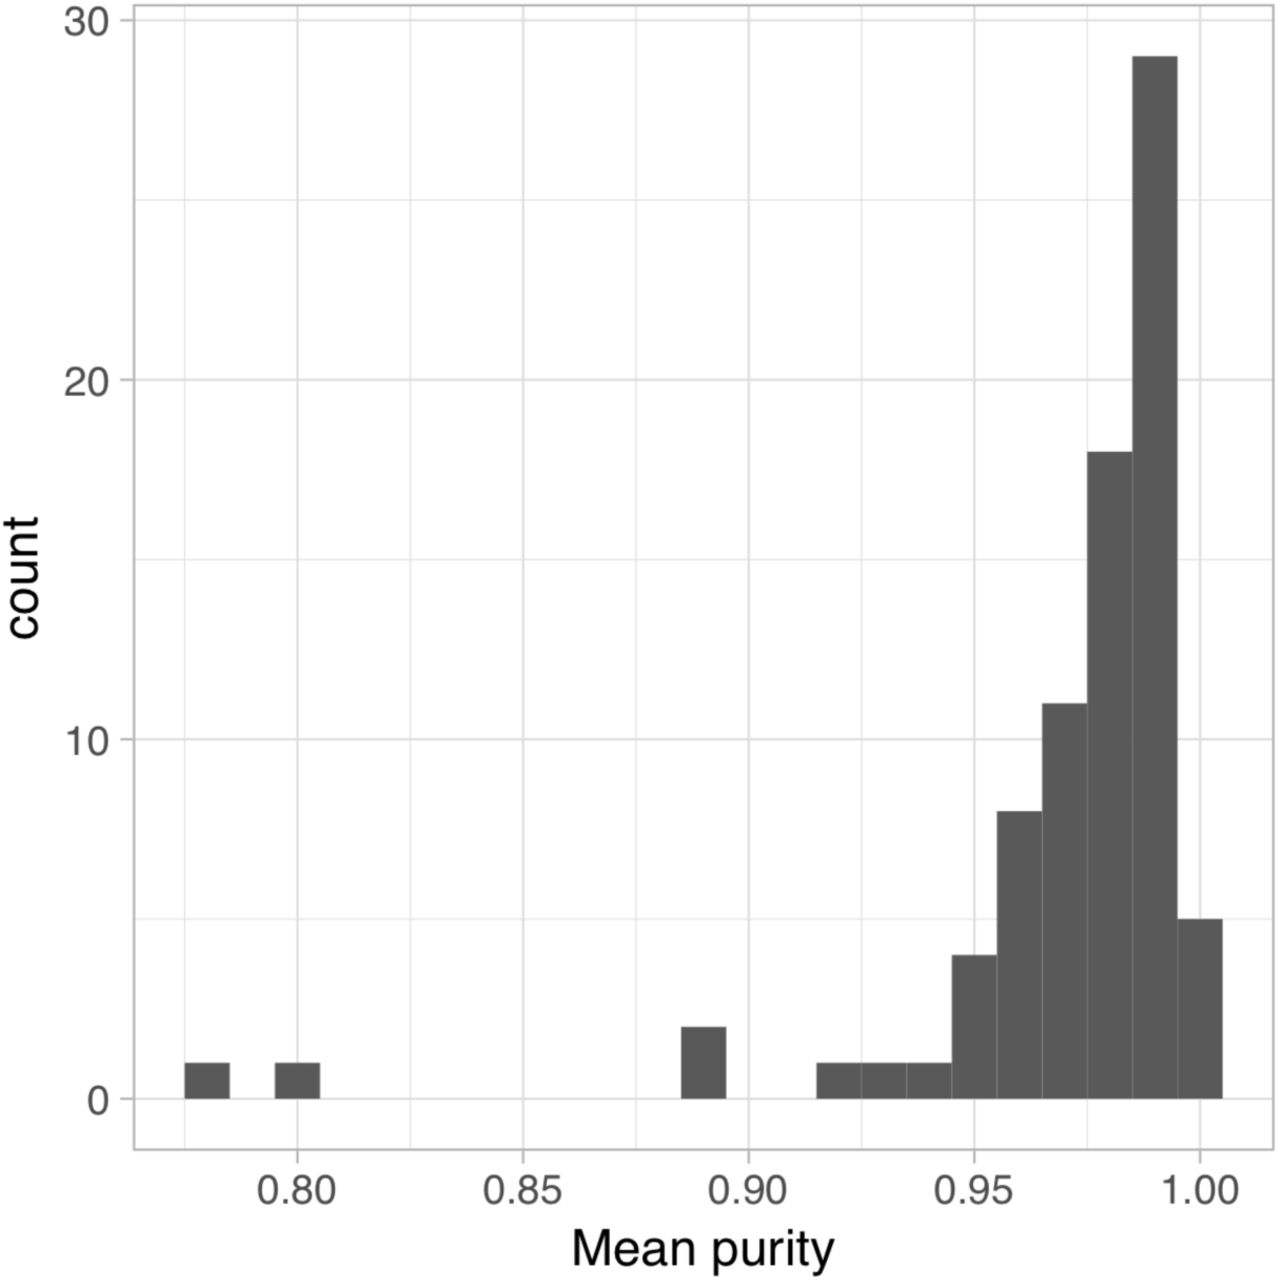
Purity of IPSC-derived macrophages. Macrophages were stained with antibodies for CD14, CD16 and CD206 and flow cytometry was used to estimate the proportion of cells stained positive for each of the three markers. The histogram shows the mean purity across the three markers.
First, we examined global changes in gene expression and chromatin accessibility to test the faithfulness of our iPSC-derived macrophages as a model to study immune response. The first two principal components separated the four experimental conditions, and explained 59% of the variance in gene expression and 44% of the variance in chromatin accessibility (fig. S2). Consequently, 8,758 genes (55% of those expressed) were > 2-fold differentially expressed between naive and at least one of the stimulated conditions. Similarly, the accessibility of 63,430 (22%) chromatin regions changed > 4-fold between the conditions, highlighting that both gene expression and chromatin accessibility are highly dynamic.
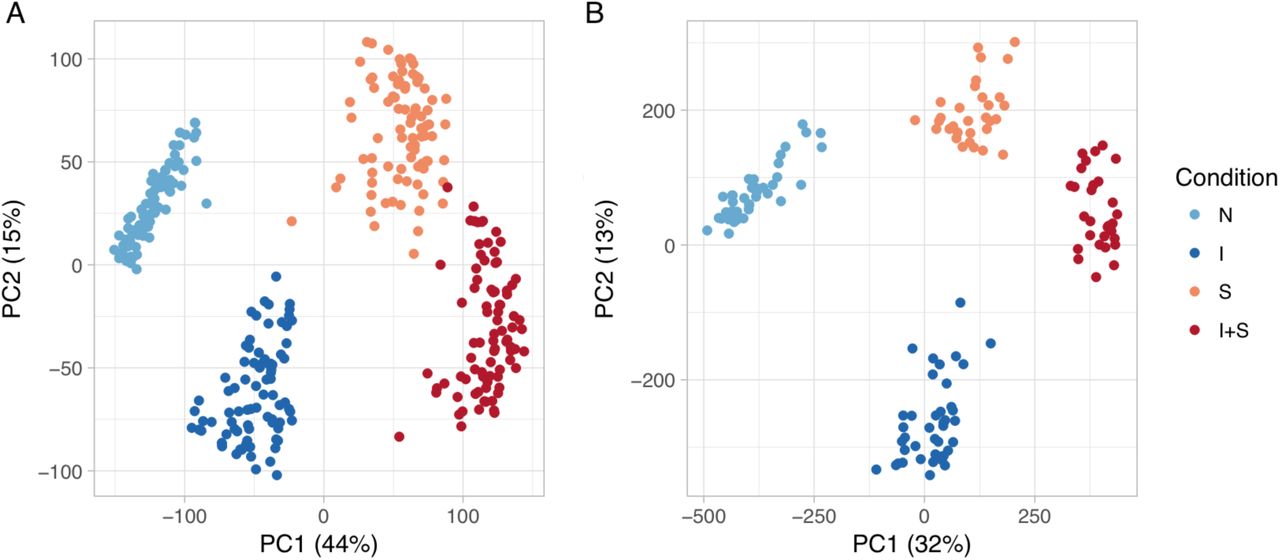
Global overview of the the datasets. (A) Principal component analysis of the gene expression data. (B) Principal component analysis of the chromatin accessibility data.
To better understand the response to different stimuli, we clustered the differentially regulated genes and accessible chromatin regions identified above into distinct activity patterns (Fig. 1C-D). We found that differential gene expression and chromatin accessibility patterns closely recapitulated known aspects of macrophage immune response. For example, genes upregulated by Salmonella (cluster 1, Fig. 1C) were enriched for tumor necrosis factor (TNF) signalling and cell death pathways whereas genes upregulated by IFNɣ (cluster 5, Fig. 1C) were enriched for IFNɣ response and antigen presentation pathways. Similarly, open chromatin regions in clusters 1 and 2 that became accessible after Salmonella infection were specifically enriched for NF-κB and AP-1 motifs (Fig. 1D), two main TFs activated downstream of toll-like receptor 4 (TLR4) signalling (21). In contrast, clusters 4 and 5 showed increased accessibility after IFNɣ stimulation and were enriched for IRF and STAT1 motifs, consistent with the activation of STAT1 and IRF1 downstream of IFNɣ signalling (22). An important biological role of macrophages enhanced by IFNɣ is presentation of antigens to adaptive immune cells. Consistent with this, we found that the master regulator of MHC class II genes, CIITA, was upregulated by IFNɣ (fig. S3) and open chromatin regions displaying increased accessibility after IFNɣ stimulation were enriched for experimentally measured CIITA binding sites in IFNɣ-stimulated monocytes (fig. S3) (23).

Regulation of MHC class II expression in iPSC-derived macrophages. (A) Gene expression level of CIITA gene in the four experimental conditions. (B) Enrichment of RFX5 and CIITA ChIP-seq peaks (23) from human monocytes stimulated with IFNɣ in macrophage open chromatin regions that were differentially accessible between conditions. Numbers 1-7 correspond to the seven differentially accessible peak clusters from Fig. 1D. Only clusters 4 and 5 that become more accessible after IFNɣ stimulation in iPSC-derived macrophages show enrichment for RFX5 and CIITA peaks, consistent with the upregulation of CIITA after IFNɣ stimulation (panel A).

(A) Overview of the experimental design. (B) TLR4 recognises lipopolysaccharide (LPS) on Salmonella cell wall and activates NF-κB, AP-1 and IRF3 TFs (21). IRF3 stimulates IFNβ production that culminates with the activation of STAT1-STAT2-IRF9 complex. IFNɣ binds to IFNɣ receptor and activates STAT1 and IRF1 TFs (22). (C) Left panel: heatmap of 8758 differentially expressed genes clustered into nine distinct expression patterns. Right panel: Selection of Gene Ontology terms enriched in each cluster. Only enrichments with p < 1×10⁻⁸ are shown in the figure. (D) Left panel: heatmap of 63,350 differentially accessible regions clustered into seven distinct patterns. Right panel: enrichment of TF motifs in four groups of similar clusters relative to all open chromatin regions.
Next, to identify common genetic variants that were associated with either gene expression (eQTLs) or chromatin accessibility (caQTLs), we used an allele-specific method implemented in RASQUAL (8) and compared it to a standard linear model. We found that RASQUAL detected 1.3-2x more QTLs at the same 10% FDR level (Fig. 2A, fig. S4). To assess the how condition-specific eQTLs and caQTLs were, we focussed on all genes (regions) that had a significant QTL in at least one condition. For each gene (region), we asked how often the same lead variant or one in strong linkage disequilibrium with it (R2 > 0.8) was detected in another condition, even if the p-value was below the significance threshold (see Methods). On average, 47% of eQTL lead variants and 73% of caQTL lead variants were shared between any two pairs of conditions (Fig. 2B). Next, we used a statistical interaction test followed by strict filtering on effect size to identify individual, condition-specific associations (see Methods). We identified 612 associations with gene expression and 2464 associations with chromatin accessibility that were hidden in the naive state and only appeared in one or more stimulated conditions (Fig. 2D). An example of an IFNɣ-specific genetic effect on NXPH2 expression is shown in Fig. 2C. Interestingly, while genes with condition-specific genetic effects showed similar mean expression across conditions, chromatin regions with stimulation-specific QTLs were predominantly inaccessible in unstimulated cells and became accessible only in the condition in which the genetic effect appeared (Fig. 2E, fig. S5), suggesting that they are at least partly driven by TFs that only bind to DNA after stimulation. Thus, even with a relatively small sample size we were able to identify thousands of QTLs that could only be detected in specific cellular states.

On each plot, the solid line corresponds to the expected distribution of p-values under the null model of no association. The FastQTL and RASQUAL p-values have been corrected for the number of independent variants tested using eigenMT (66). (A) Q-Q plots for eQTLs. (B) Q-Q plots for caQTLs.

Relationship between condition-specificity of QTLs and mean signal (gene expression or chromatin accessibility) of the corresponding features. (A) Distribution of mean gene expression in each of the six condition-specific eQTL clusters from Fig. 2D. (B) Distribution of mean chromatin accessibility in each of the six condition-specific caQTL clusters from Fig. 2D.
Previous studies have shown that most genetic effects on chromatin have no observable downstream consequences on gene expression (9–11). While limited statistical power often reduces the extent of overlap between QTLs, some genetic effects on chromatin may indeed be truly ‘non-functional’, reflecting for example redundant TF binding. Alternatively, some caQTLs may have downstream effects on gene expression that only manifest in specific cell states or conditions (11). Our data provided an unique opportunity to quantify the hidden functional consequences of genetic effects on chromatin accessibility. We found that for a surprisingly large fraction of genes (approximately 50%) with IFNɣ-specific and Salmonella-specific eQTLs the corresponding caQTL (see Methods) was already present before stimulation (Fig. 2F). For example, a genetic variant in an intron of NXPH2 modulated the accessibility of a regulatory element both in naive and stimulated cells, but became associated with gene expression only after IFNɣ stimulation (Fig. 2G, Fig. 2C).

(A) Number of eQTLs and caQTLs detected in each experimental condition using either a linear model (FastQTL) or RASQUAL. (B) Proportion of lead QTL variants shared between all pairs of conditions for both eQTLs and caQTLs. (C) IFNɣ-specific eQTL regulating the expression of NXPH2. (D) Six groups of condition-specific eQTLs and caQTLs identified by k-means clustering of the QTL relative effect sizes across conditions. (E) Distribution of mean gene expression (or chromatin accessibility) in the naive condition and in the condition where the condition-specific QTL had the largest relative effect size (marked by black rectangles on panel D). TPM, transcripts per million. (F) Comparison of relative effect sizes between condition-specific eQTLs and their corresponding caQTLs after IFNɣ stimulation (right panel) and Salmonella infection (left panel). Approximately 50% of the caQTLs are already active in the naive state. (G) Constitutive caQTL in the intron of NXPH2 that becomes associated with the expression of the gene after IFNɣ stimulation.
Recent evidence suggests that that single genetic variants can modulate the activity of multiple neighbouring regulatory elements within regions enriched for three-dimensional interactions (8, 10, 11, 24). One plausible mechanism for these broad associations is that a single causal variant may directly regulate the accessibility of a “master” region, which subsequently influences neighbouring “dependent” regions (Fig 3A) (8), potentially in a condition specific manner (25, 26). Our dataset provided an unique opportunity to discover these hierarchies between regulatory elements by studying the dynamics of master-dependent region relationships between conditions. First, we developed a heuristic approach to identify master and dependent regions from caQTL summary statistics. For each caQTL region, we defined its credible set of causal variants as those with R2 > 0.8 to the lead variant. We then classified the focal caQTL region as a master region (i - Fig 3A), if the credible set overlapped the region itself (Fig. 3A). Alternatively, if the credible set overlapped some other regulated region put not the focal region, then we classified it as a dependent region (ii - Fig. 3A). We also excluded ambiguous cases where the credible set overlapped either multiple regulated regions (iii - Fig 3A) or it did not overlap any regulated regions (iv-v - Fig. 3A).
With this approach, we identified 2934 master-dependent region pairs (Fig. 3A). While 77% of the master regions had a single dependent region (Fig. 3D) only a few kb away (Fig. 3F), the master caQTL in the NXPH2 locus had 18 dependent regions spanning a 100 kb stretch of DNA (Fig. 3D), six of which appeared only after IFNɣ stimulation (Fig. 3D). Notably, this caQTL also became an eQTL for NXPH2 after IFNɣ stimulation, together with the appearance of additional dependent regions (Fig. 3E). Using a linear model followed by strict filtering (see Methods), we found a total of 64 condition-specific dependent regions genome-wide, two of which are highlighted in Fig. S6. Thus, caQTL mapping in multiple conditions is a promising approach to uncover temporal hierarchical relationships between regulatory elements.

Two examples of condition-specific dependent peaks. (A) Dependent peak appears after Salmonella infection. (B) Dependent peak disappears after Salmonella infection.
The relatively short length of accessible regions (median 231 bp, fig. S7) suggests that they might aid fine mapping causal variants for caQTLs as well as colocalised eQTLs. We tested this hypothesis in the NXPH2 locus, where we noticed that only 2 of the top 10 most associated variants overlapped the master caQTL region and only one of them (rs7594476) was predicted to alter PU.1 TF binding in a direction consistent with the caQTL effect (Fig. 3F). Furthermore, the same region overlapped a PU.1 ChIP-seq peak in macrophages (27), suggesting that rs7594476 is the causal variant that alters chromatin accessibility of the region by disrupting PU.1 binding. To explore this systematically, we focused on master caQTL regions identified above (Fig. 3A) and found that 7,877 (72%) of them contained only a single associated variant and 10,558 (96%) contained up to three variants (Fig. 3G), suggesting that in those cases we might be able to identify a small set of plausible causal variants. To test accuracy of these predictions, we focussed on Salmonella-specific and IFNɣ-specific master caQTL regions, speculating that variants in those regions should be enriched for disrupting binding sites for TFs that are activated by the two stimuli (Fig. 1B). Consistent with this hypothesis, we found that variants overlapping Salmonella-specific caQTL master regions were enriched for disrupting NF-κB and AP-1 motifs whereas IFNɣ-specific variants were enriched for disrupting the IRF motif (Fig. 3H), compared to other master caQTL regions that did not belong to these clusters. Thus, a substantial fraction of the master caQTLs could be narrowed down to ≤ 3 plausible causal variants.

Distribution of ATAC-seq peak lengths.

(A) Classifying caQTLs into master regions (i), dependent regions (ii) and ambiguous cases where the credible set overlaps either multiple regulated regions (iii) or does not overlap any regulated regions (iv-v). (B) Histogram of the number of associated dependent regions for each master region. (C) Distribution of distance between master and dependent region pairs. (D) Multiple open chromatin regions regulated by a single caQTL at the NXPH2 locus. Master caQTL region is marked by the red dotted line and IFNɣ-specific dependent regions are highlighted by black arrows. FPM, fragments per million. (E) Master caQTL on panel D becomes associated with NXPH2 expression after IFNɣ stimulation. (F) Fine mapping the causal variant for the master caQTL. Only one of the two variants overlapping the master region is predicted to disrupt the PU.1 motif. None of the associated variants overlap the two IFNɣ-specific dependent regions (black arrows). Master caQTL region overlaps a PU.1 ChIP-seq peak from (27). (G) Histogram of the number of associated variants overlapping master caQTL regions. (H) Salmonella-specific contains master regions from clusters 2 and 3 in Fig. 2D while IFNɣ-specific contains master regions from clusters 5 and 6.
To explore the utility of iPSC-derived macrophages in interpreting GWAS associations, we first used GARFIELD (28) to identify immune-mediated disorders whose GWAS hits were enriched among macrophage QTLs. As a negative control, we used type 2 diabetes (T2D), reflecting our belief that macrophages are not likely to be the most relevant cell type for a metabolic disease. We found that both expression and chromatin accessibility QTLs were strongly enriched among GWAS hits for inflammatory bowel disease (IBD) (33 fold), rheumatoid arthritis (RA) (14 fold) and systemic lupus erythematosus (11 fold) (Fig. 4A, table S2), consistent with the reported role of myeloid cells in those disorders (29). In contrast, T2D together with type 1 diabetes, multiple sclerosis, narcolepsy and celiac disease showed only moderate enrichment (3-5 fold), which is probably driven by QTLs shared by multiple cell types (Fig. 4A).
Next, we quantified how many additional overlaps with GWAS hits we could find by including eQTLs from stimulated conditions. To avoid spurious overlaps in regions with a large number of linked variants, we used coloc (30) to identify cases where the gene expression and trait association signals were consistent with a model of a single, shared causal variant. In total, we identified 24 eQTLs (table S3) that showed evidence of colocalisation with at least one disease (see Methods). Consistent with the enrichment analysis above, we found the largest number of overlaps with IBD and RA (Fig. 4B). Interestingly, we found that only 11/24 of the colocalised eQTLs were detected in the naive cells and each additional stimulated state increased the number of overlap by approximately 30% (Fig. 4C). For example, we found an eQTL for TRAF1 that was undetectable in the naive cells but colocalised with a RA GWAS hit in the IFNɣ + Salmonella condition (Fig. 4D).
Finally, we focussed on colocalisation between caQTLs and GWAS hits. While we detected 23 caQTLs that colocalised with a GWAS hit (table S4), only two of them also colocalised with an eQTL (PTK2B eQTL with Alzheimer’s disease (fig. S8) and WFS1 eQTL with T2D), suggesting that most caQTLs might regulate gene expression in some other yet unknown cell type or condition. Fig. 4E highlights a constitutive caQTL near the ICOSLG gene that is colocalised with a GWAS hit for ulcerative colitis, but does not regulate the expression of any nearby genes. The lead GWAS variant (rs7282490) has previously been associated with the expression of ICOSLG in monocyte-derived dendritic cells (31), but in our data the lead eQTL variant was clearly independent from the GWAS signal (R2 = 0.14) with coloc assigning 99% of the posterior probability (PP3) to a model supporting two independent causal variants, suggesting that the colocalised caQTL might become an eQTL in some as of yet unknown condition. Although, 22/23 of the caQTL overlaps were detected in the naive condition (Fig. 4C), this is also confounded with a smaller ATAC-seq sample size in Salmonella and IFNɣ + Salmonella conditions that limited our power to detect colocalisation.
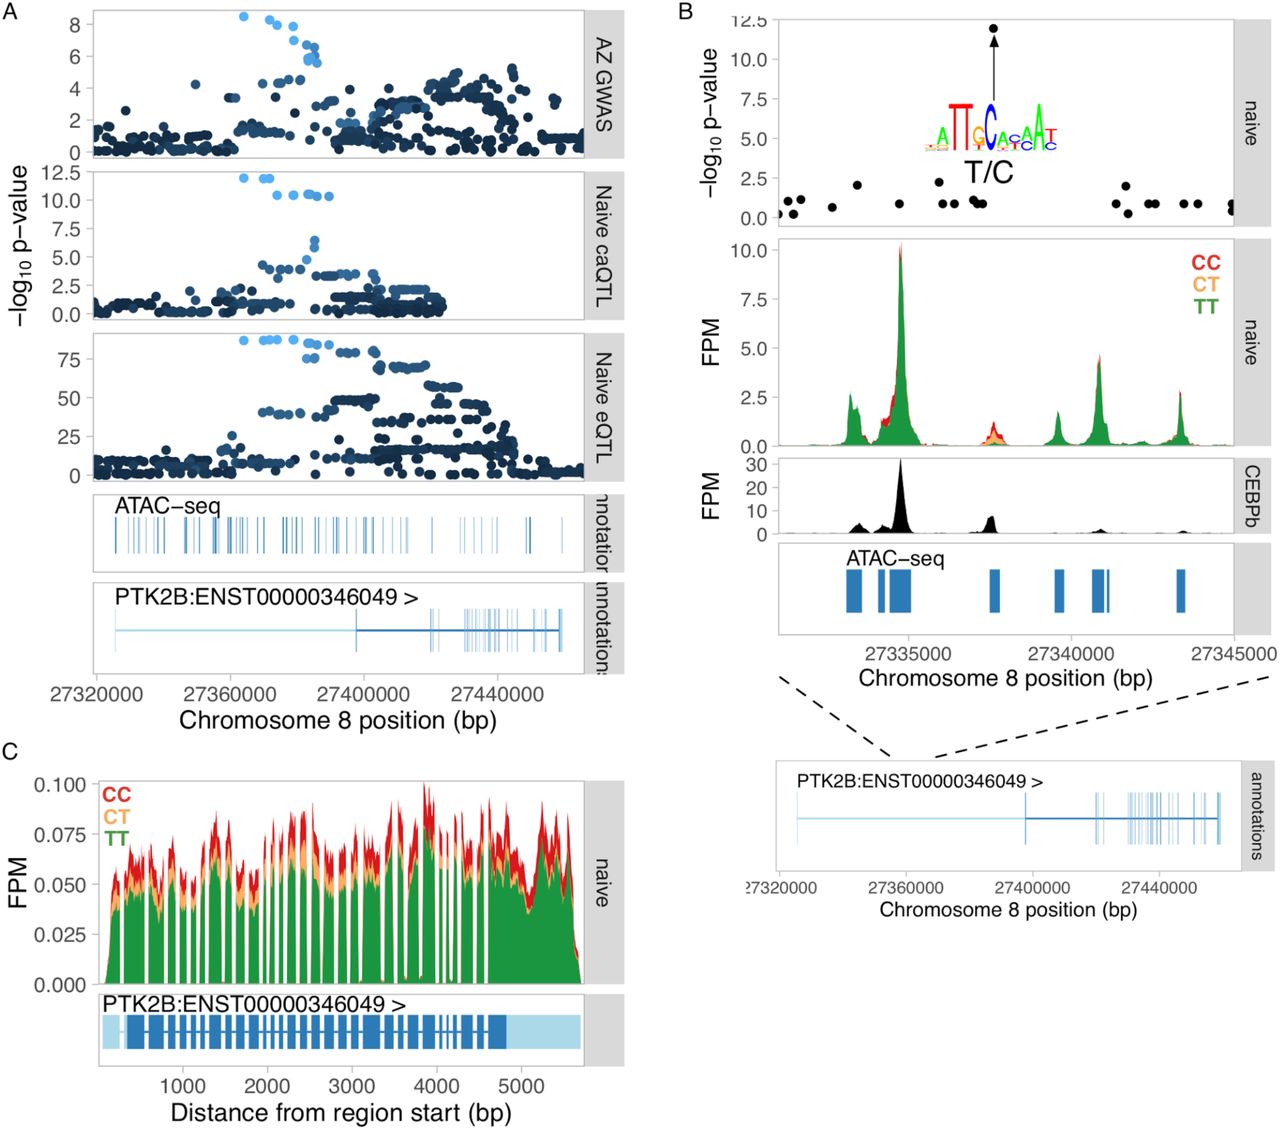
Dissecting the Alzheimer’s disease causal variant at the PTK2B locus. (A) Manhattan plots for the Alzheimer’s GWAS hit (top panel), colocalised caQTL (second panel) and colocalised eQTL for PTK2B gene (third panel). The bottom two tracks show all ATAC-seq peaks in the region as well was exons of the PTK2B gene. (B) ATAC-seq fragment coverage stratified by the lead caQTL and GWAS variant rs28834970. The lead variant was the only associated variant lying within the regulated caQTL peak, suggesting this is the most likely causal variant. The lead variant rs28834970 is a T/C polymorphism and the alternative C allele is predicted to increase the relative binding score of the CEBPβ TF motif (M2268_1.02 in CIS-BP (Weirauch et al., 2014)) from 0.86 to 0.97. This is consistent with increased chromatin accessibility at the C allele (middle panel) as well as increased expression of the PTK2B gene (panel C). Furthermore, the variant also overlaps experimental CEBPβ ChIP-seq peak in primary human macrophages (bottom panel) (61). Together, this evidence suggests that rs28834970 is the likely causal variant for Alzheimer’s disease risk that influences PTK2B expression by disrupting CEBPβ motif in an enhancer in the first intron of the gene. (C) RNA-seq read coverage plot at the PTK2B gene stratified by the rs28834970 genotype.

(A) Fold enrichment of eQTLs and caQTLs among GWAS hits for ten complex diseases. (B) Total number of colocalised GWAS hits identified for each of the 10 traits across four conditions. (C) Cumulative number of colocalised GWAS hits identified by starting with overlaps in the naive condition and sequentially adding IFNɣ, Salmonella and IFNɣ + Salmonella. (D) Salmonella-specific eQTL for TRAF1 colocalised with a GWAS hit for rheumatoid arthritis (RA). (E) TRAF1 expression in naive and IFNɣ + Salmonella conditions stratified by the lead GWAS variant. (F) GWAS hit for ulcerative colitis (UC) near ICOSLG that colocalises with a caQTL in all four conditions, but is independent from the constitutive eQTL of the same gene. FPM, fragments per million. Disease acronyms: IBD, inflammatory bowel disease; RA, rheumatoid arthritis; SLE, systemic lupus erythematosus; AD, Alzheimer’s disease; SCZ, schizophrenia; T2D, type 2 diabetes; MS, multiple sclerosis; NAR, narcolepsy; CEL, celiac disease; T1D, type 1 diabetes.
Multiple studies have highlighted that human disease loci identified in association studies are strongly enriched in regulatory elements (29, 32). Despite this, only a small fraction of GWAS hits can be explained by current eQTL mapping studies (33–35). Our results show that a large fraction of eQTLs, including those confidently colocalised with GWAS hits, remain hidden in the naive, unstimulated cells. Approximately 50% of these hidden eQTLs already manifest at the chromatin level in naive cells. Furthermore, we found a number of caQTLs that colocalised with GWAS hits but did not seem to regulate the expression of nearby genes. Thus, our results indicate that a fraction of GWAS hits influence the activity of primed enhancers, but their effect on gene expression might become apparent only in very specific cellular states or conditions.
The mechanisms by which genetic variants that only regulate chromatin accessibility in naive cells also start to influence gene expression following stimulation are not clear. One possible model is that cell-type specific pioneer TFs (such as PU.1 in macrophages) set up an accessible chromatin landscape that then guides the binding of TFs activated by stimulation and leads to activation of gene expression. There are multiple lines of evidence to support this model. For example, NF-κB activated by TLR4 signalling in mouse macrophages predominantly binds to enhancers that are already occupied by PU.1 before stimulation (36, 37) and genetic variants that disrupt NF-κB binding often do so indirectly by disrupting PU.1 binding in the naive cells (36). Similar hierarchies between cell type specific pioneer factors and signal-specific TFs have also been observed in TGFβ (38), BMP and Wnt signalling pathways (39). Furthermore, analysis of DNAse-seq data has shown that pioneer TFs (such as PU.1) have an intrinsic capacity to independently open up chromatin whereas the binding of other TFs (such as NF-κB) is largely determined by the accessible chromatin landscape of the cell (40).
However, hierarchical TF binding is not necessarily limited to single regulatory elements. For example, some regulatory elements can act as “seed” enhancers that allow other neighbouring enhancers to become activate after stimulation and lead to upregulation of gene expression (25). The concept of seed enhancers is consistent with our observation that some constitutive master caQTLs have dependent regions that only appear after stimulation, highlighting that prior accessibility of one regulatory element is required for the others to become accessible (Fig. 3D). For example, in the NXPH2 region we observed that the appearance of multiple additional dependent regions after IFNɣ stimulation correlated with the caQTL also becoming associated with gene expression. However, some clustered enhancers seem to act independently of each other (41) and it is not yet well understood, how common the seed enhancers are. Furthermore, testing potential seed enhancers using direct editing is currently not feasible genome-wide. Thus, better powered future caQTL mapping studies in multiple cell types and conditions have a potential to systematically identify these hierarchical relationships between enhancers without the need for exhaustive genome editing experiments.
Our study illustrates how pre-existing genetic effects on chromatin propagate to gene expression during immune activation, and highlights the relevance of these hidden genetic effects for deciphering the molecular architecture of disease-associated variants. A major implication of our results is that, while many risk variants may have constitutive effects on chromatin structure, downstream changes on gene expression are likely to be highly context-specific, perhaps requiring expression assays in scores of alternative cell states to identify. Finally, our study is also the first that we are aware of to utilise an iPSC-based cell culture system to study genetic effects in immune response. We believe a major future use of this system will be the systematic exploration of gene-environment interactions across large numbers of cell states. Furthermore, because iPSCs are readily engineered, the identity of causal variants and their downstream consequences can be directly tested in exactly the same cell types and conditions where they were discovered.
Supplementary Materials
Materials and Methods
Cell culture and reagents
Donors and cell lines
Human induced pluripotent stem cells (iPSCs) from 123 healthy donors (72 female and 51 male) (table S1) were obtained from the HipSci project (12). Of these lines, 57 were initially grown in feeder-dependent medium and 66 were grown in feeder-free E8 medium.
Feeder-free iPSC culture
Feeder-free iPSCs were grown on tissue culture treated plates coated with vitronectin (VTN-N) (Gibco, cat. no. A14700) in Essential 8 (E8) medium (Gibco). The cells were dissociated from the plates using Gentle Cell Dissociation Buffer (Stemcell Technologies, cat. no. 07174) and passaged every 3-5 days. Prior to macrophage differentiation, the feeder-free iPSCs were first transferred to feeder-dependent media and propagated for at least two passages. This step was necessary because multiple attempts to differentiate macrophage directly from feeder-free iPSCs with our protocol failed.
Feeder-dependent iPSC culture
Feeder-dependent iPSCs were grown on irradiated CF-1 mouse embryonic fibroblast (MEF) feeder cells (AMS Biotechnology) in Advanced DMEM-F12 (Gibco) supplemented with 20% Knock-Out Serum Replacement (KSR) (Gibco), 2mM L-glutamine (Sigma), 50 IU/ml penicillin (Sigma), 50 IU/ml Streptomycin (Sigma) and 50µM β-Mercaptoethanol (Sigma M6250). The media was supplemented with 4 ng/ml recombinant human fibroblast growth factor (rhFGF) basic (R&D, 233-FB-025) to maintain pluripotency and was changed daily. MEFs were seeded on 0.1% gelatine-coated tissue-culture treated plates (Corning 6-well or 10 cm plates) 24 hours prior to passaging iPSCs at a cell density of 2 million cells/6-well or 10-cm plate in Advanced DMEM-F12 supplemented with 10% FBS (labtech), 2mM L-glutamine (Sigma), 50 IU/ml Penicillin and 50 IU/ml Streptomycin (Sigma). Prior to passaging or embryoid body formation, iPSCs were dissociated from the plates using 1:1 mixture of collagenase (1 mg/ml) and dispase (1 mg/ml) (both Gibco).
Macrophage differentiation protocol
iPSCs were differentiated into macrophages using a previously published protocol (15) involving 3 stages: i) embryoid body (EB) formation, ii) generation of monocyte-like myeloid progenitors from the EBs and iii) terminal differentiation of the progenitors into macrophages. For EB formation, iPSC colonies were treated with 1:1 mixture of collagenase (1 mg/ml) and dispase (1 mg/ml) and intact colonies were transferred to low-adherence plates (Sterilin). The colonies were cultured in feeder-dependent iPSC medium without rhFGF for 3 days. On day 3, the EBs were harvested and transferred to gelatinised tissue-culture treated 10 cm plates in serum-free haematopoietic medium (Lonza X-VIVO 15), supplemented with 2 mM L-glutamine (Sigma), 50 IU/ml penicillin, 50 IU/ml streptomycin (Sigma), 50 µM β-Mercaptoethanol (Sigma M6250), 50 ng/ml macrophage colony stimulating factor (M-CSF) (R&D) and 25 ng/ml interleukin-3 (IL-3) (R&D). EBs were maintained in these plates with media changes every 3-5 days for 4-6 weeks until the progenitor cells appeared in the supernatant. Progenitor cells were harvested from the supernatant, filtered through a 40µm cell strainer (BD 352340), centrifuged at 1200 rpm for 5 minutes, counted, and plated in RPMI 1640 (Gibco) supplemented with 10% FBS (labtech), 2mM L-glutamine (Sigma) and 100 ng/ml hM-CSF (R&D) at a cell density of 150,000 cells per well on a 6-well plate and differentiated for another 7 days.
Differentiation outcomes
We performed 138 macrophage differentiation attempts from 123 distinct HipSci iPSC lines (table S1). We were able to differentiate macrophages from 101/123 (82%) of the iPSC lines. Successful differentiation means that we obtained at least some proportion of cells that exhibited characteristic spindle-like macrophage morphology. For 97/101 lines, we further confirmed the cell surface expression of CD14, CD16 and CD206 macrophage markers using flow cytometry. However, some of the differentiated lines did not produce enough macrophages to perform all of the experimental assays or the differentiated cells were not pure enough to be used in stimulation experiments. In total, we obtained high quality RNA-seq data from 89 differentiations corresponding to 85 unique donors and ATAC-seq data from up to 42 unique donors in up to four experimental conditions (table S1).
Salmonella infection and IFNɣ stimulation
Two wells of a 6-well plate were used per condition to ensure sufficient amount of RNA. On day 6 of macrophage differentiation, medium was changed for all wells with half of the wells receiving macrophage differentiation media (with M-CSF) and the other half of the cells receiving macrophage differentiation media supplemented with 20 ng/ml IFNɣ (R&D) and M-CSF. After 18 hours, cells from two wells of the naive and IFNɣ conditions were harvested for RNA extraction. The remaining two wells from each condition were additionally infected with Salmonella enterica serovar Typhimurium SL1344 (hereafter Salmonella) for 5 hours.
Two days before infection, Salmonella culture was inoculated in 10 ml low salt LB broth and incubated overnight in a shaking incubator (200 rpm) at 37°C. Next morning, the culture was diluted 1:100 into 10 ml of fresh LB broth and incubated again in a shaking incubator. In the afternoon the culture was diluted once more 1:100 into 45 ml of LB broth and kept overnight in a static incubator. In the morning before infection, the culture was centrifuged at 4000 rpm for 10 minutes, washed once with 4°C PBS and resuspended in 30 ml of PBS. Subsequently, optical density at 600 nm was measured and Salmonella was diluted in macrophage differentiation media (without MCSF) at multiplicity of infection (MOI) 10 assuming 300,000 cells per well. To infect the cells, old media was removed and replaced with 1 ml of media containing Salmonella for 45 minutes. Subsequently, the cells were washed twice with PBS and replaced in fresh medium with 50 ng/ml gentamicin (Sigma) to kill extracellular bacteria. After 45 minutes the medium was changed once again to fresh medium containing 10 ng/ml gentamicin.
For RNA extraction, cells were washed once with PBS and lysed in 300 μl of RLT buffer (Qiagen) per one well of a 6-well plate. Lysates from two wells were immediately pooled and stored at -80°C. RNA was extracted using RNA Mini Kit (Qiagen) following manufacturer’s instructions and eluted in 35 µl nuclease-free water. RNA concentration was measured using NanoDrop and RNA integrity was measured on Agilent 2100 Bioanalyzer using RNA 6000 Nano total RNA kit.
Flow cytometry
We used flow cytometry to measure the cell surface expression of three canonical macrophage markers: CD14, CD16 (FCGR3A/FCGR3B) and CD206 (MRC1). Macrophages were cultured in 10 cm tissue-culture treated plates and detached from the plates by incubation in 6 mg/ml lidocaine-PBS solution (Sigma L5647) for 30 minutes followed by gentle scraping. From each cell line we harvested between 300,000-500,000 cells. Detached cells were washed in media, centrifuged at 1200 rpm for 5 minutes and resuspended in flow cytometry buffer (2% BSA, 0.001% EDTA in D-PBS) and split into two wells of a 96-well plate. Nonspecific antibody binding sites were blocked by incubating cells with Human TruStain FcX (Biolegend) for 45 minutes and washing with flow cytometry buffer. Half of the cells were stained for 1 hour with the PE-isotype control (BD 555749) antibody. The other half of the cells were co-stained for 1 hour with the following three antibodies: CD14-Pacific Blue (BD 558121), CD16-PE (BD 555407), CD206-APC (BD 550889). After staining, the cells were washed three times. Resuspended cells were filtered through cell-strainer cap tubes (BD 352235) and measured on the BD LSRFortessa Cell Analyzer. The raw flow cytometry data has been deposited to Zenodo (doi: 10.5281/zenodo.234214).
RNA sequencing
All of the RNA-seq libraries were constructed using poly-A selection. The first 120 RNA-seq libraries from 30 donors were constructed manually using the Illumina TruSeq stranded library preparation kit. The TruSeq libraries were quantified using Bioanalyzer and manually pooled for sequencing. For the remaining 216 samples, we used an automated library construction protocol that was based on the KAPA stranded mRNA-seq kit. The KAPA libraries were quantified using Quant-iT plate reader and pooled automatically using the Beckman Coulter NX-8. The first 16 samples were sequenced on Illumina HiSeq 2500 using V3 chemistry and multiplexed at 4 samples/lane. All of the other samples were sequenced on Illumina HiSeq 2000 using V4 chemistry and multiplexed at 6 samples/lane. Sample metadata is presented in table S5.
RNA-seq pre-processing and quality control
RNA-seq reads were aligned to the GRCh38 reference genome and Ensembl 79 transcript annotations using STAR v2.4.0j (42). Subsequently, VerifyBamID v1.1.2 (43) was used to detect and correct any potential sample swaps and cross-contamination between donors. We did not detect any cross-contamination, but we did identify one sample swap between two donors. We used featureCounts v1.5.0 (44) to count the number of uniquely mapping fragments overlapping GENCODE (45) basic annotation from Ensembl 79. We excluded short RNAs and pseudogenes from the analysis leaving 35,033 unique genes of which 19,796 were protein coding. Furthermore, we only used 15,797 genes with mean expression in at least one of the conditions greater than 0.5 transcripts per million (TPM) (46) in all downstream analyses. We quantile-normalised the data and corrected for sample-specific GC content bias using the conditional quantile normalisation (cqn) (47) R package as recommended previously (48). To detect hidden confounders in gene expression, we applied PEER (49) to each condition separately allowing for at most 10 hidden factors. We found that the first 3-5 factors explained the most variation in the data and the others remained close to zero. Although we performed replicate macrophage differentiations and RNA-seq from four iPSC lines, for simplicity we decided to use only one of the replicates in downstream analysis. We further excluded samples from one donor (qaqx_1) from downstream analysis because they appeared as outliers on the PCA plot. The final dataset consisted of 336 RNA-seq samples from 84 donors.
Differential expression analysis
We included 15,797 genes whose mean expression in at least one of the conditions was greater than 0.5 TPM into our differential expression analysis. For each gene, we used likelihood ratio test (test = “LRT”) implemented in DESeq2 (50) v1.10.0 to test if a model that allowed different mean expression in each condition explained the data better than a null model assuming the same mean expression across conditions. Overall, 8758 genes with Benjamini-Hochberg FDR < 1% and fold change between naive and any one of the stimulated conditions greater than 2 were identified as differentially expressed.
To identify differentially expressed genes with specific expression patterns, we calculated mean quantile-normalised expression level in each condition and standardised the mean expression values across conditions to have zero mean and unit variance. Subsequently, we used c-means fuzzy clustering implemented in MFuzz v.2.28 (51) package with parameters ‘c = 9, m = 1.5, iter = 1000’ to assign the genes into 9 clusters. The number of clusters was chosen iteratively by trialing different numbers and observing which ones led to stable clustering results from independent runs. We ranked the genes in each cluster by their fold change between naive and highest expression conditions and used g:Profiler (52) R package with ‘max_set_size = 3000, ordered_query = TRUE, exclude_iea = TRUE’ options to identify pathways and Gene Ontology categories enriched in each cluster.
ATAC-seq
Experimental procedures
Approximately 150,000 cells were seeded into 1 well of a 6-well plate and treated identically to the RNA-seq samples. After stimulation, cells were washed once with ice-cold Dulbecco’s phosphate buffered saline without calcium and magnesium and incubated for 12 minutes on ice in 500 µl freshly-made sucrose buffer (10 mM Tris-Cl pH 7.5, 3 mM CaCl2, 2mM MgCl2, 0.32 M sucrose). After 12 minutes, 25 µl of 10% Triton-X-100 (final concentration 0.5%) was added and the cells were incubated for another 6 minutes to release the nuclei. The lysate was transferred to 1.5 mL microfuge tube, vortexed briefly, and centrifuged at 300 g for 8 minutes at 4°C. All traces of the sucrose lysis buffer were removed before immediately resuspending the nuclei pellet in 50 µL of Nextera tagmentation master mix (Illumina FC-121-1030), comprising 25 µL 2x Tagment DNA buffer, 20 µL nuclease-free water and 5 µL Tagment DNA Enzyme 1. The tagmentation reaction mixture was immediately transferred to a 1.5 mL low adherence microfuge tube and incubated at 37°C for 30 minutes. The tagmentation reaction was stopped by the addition of 250 µL Buffer PB (Qiagen). The tagmented chromatin was then purified using the MinElute PCR purification kit (Qiagen 28004), according to the manufacturer’s instructions, eluting in 10 µL of buffer EB (Qiagen). Finally, size selection was performed using agarose gel and SPRI beads (8). Five samples were pooled per lane and 75 bp paired end reads were sequenced on Illumina HiSeq 2000 using the V4 chemistry.
Read alignment
Illumina Nextera sequencing adapters were trimmed using skewer v0.1.127 (53) in paired end mode. Trimmed reads were aligned to GRCh38 human reference genome using bwa mem v0.7.12 (54). Reads mapping to the mitochondrial genome and alternative contigs were excluded from all downstream analysis. Picard 1.134 MarkDuplicates was used to remove duplicate fragments. We used verifyBamID (43) 1.1.2 to detect and correct potential sample swaps between individuals. Fragment coverage BigWig files were constructed using bedtools v2.17.0 (55).
Peak calling
We used MACS2 (56) v2.1.0 with ‘--nomodel --shift -25 --extsize 50 -q 0.01’ to identify open chromatin regions (peaks) that were enriched for transposase integration sites compared to the background at 1% FDR level. With these parameters we detected between 31,658 and 208,330 peaks per sample (table S6). We constructed consensus peak sets in each condition separately by pooling all of the peak calls from all of the samples. For each peak, we counted the number samples in which that peak was identified and calculated the union of all peaks that were detected in at least three samples. Finally, we pooled the consensus peaks from all four conditions to obtain the final set of 296,220 unique peaks that were used for all downstream analyses. We used featureCounts (44) v.1.5.0 to count the number of fragments overlapping consensus peak annotations in each sample.
Sample quality control
We used the following criteria summarised in table S6 to assess the quality of ATAC-seq samples:
Assigned fragment count - the total number of paired end fragments assigned to peaks by featureCounts.
Mitochondrial fraction - fraction of total fragments aligned to the mitochondrial genome.
Assigned fraction - fraction of non-mitochondrial reads assigned to consensus peaks. A measure of signal-to-noise ratio.
Duplicated fraction - fraction of fragments that were marked as duplicates by Picard MarkDuplicates.
Peak count - number of peaks called by MACS2.
Length ratio - # of short fragments (< 150 nt) / # long fragments (>= 150 nt). This measures if the read length distribution has characteristic ATAC-seq profile with clearly visible mono-nucleosomal and di-nucleosomal peaks.
We used these criteria to exclude 5 samples from downstream analysis (table S6). One sample was excluded because of very low assigned fraction (~10%) and peak count, two more were excluded because of extremely large length ratio (>7) and a fragment length distribution uncharacteristic for ATAC-seq library. The final two samples were excluded because they appeared to be outliers in the principal component analysis (PCA).
Differentially accessible regions
We used limma voom v3.26.3 (57) with TMM normalisation to identify 63,430 peaks that were more than 4-fold differentially accessible (FDR < 0.01) between naive and any one of the stimulated conditions. We only included high quality samples from 16 donors (64 samples) (table S6) in the analysis, because we noticed that limma voom was sensitive to additional noise in the lower quality samples. Subsequently, we quantile-normalised the peak accessibility data using cqn (47), calculated the mean accessibility of each peak in each condition and used Mfuzz v.2.28 (51) to cluster the peaks into seven distinct activity patterns.
Motif enrichment
We downloaded the CIS-BP (58) human TF motif database from the MEME website and used FIMO (59) to identify the occurrences of all TF motifs within the ATAC consensus peaks with FIMO threshold p-value < 1×10⁻⁵. We also performed the same motif scan for 2 kb promoter sequences upstream of 21,350 human genes (downloaded from the PWMEnrich (60) R package) and used this as the background set. We used Fisher’s exact test to identify motifs that occurred significantly more often in macrophage open chromatin regions compared to the background promoter sequences. Because the CIS-BP database contains many redundant motifs, we manually selected 21 representative motifs for downstream analysis corresponding to the major TFs important in macrophage biology: AP-1, IRF-family, ETS-family (PU.1, ELF1, FLI1), NF-κB, CEBPα, CEBPβ, ATF4, CTCF, STAT1, MAFB, MEF2A and USF1. We used Fisher’s exact test to identify motifs that were specifically enriched in each cluster of differentially accessible peaks compared to the background of all macrophage ATAC-seq peaks.
ChIP-seq data analysis
Human macrophage PU.1 ChIP-seq data (27) (75bp single-end reads) were downloaded from GEO (accession GSE66594), RFX5 and CIITA ChIP-seq data from naive and IFNɣ-stimulated monocytes (23) (51 bp paired-end reads) were downloaded from ArrayExpress (accession E-MTAB-2424) and macrophage C/EBPβ ChIP-seq data (61) (50 bp paired-end reads) were obtained from GEO (accession GSE54975). Single-end datasets were aligned to the GRCh38 reference genome using bwa aln v0.7.12 and paired-end datasets were aligned to the same reference using bwa mem v0.7.12 with the -M flag set. For paired-end datasets, only properly paired reads were used for downstream analysis. Duplicate reads were removed with Picard v1.134 MarkDuplicates with the ‘REMOVE_DUPLICATES=true’ parameter set. We used bedtools v2.17.0 (55) to construct genome wide read (single-end) or fragment (paired-end) coverage tracks in BigWig format. Finally, we called peaks using MACS2 v2.1.0 with ‘-q 0.01’ option.
Peak overlap analysis
We used a permutation-based approach implemented in the Genomic Association Test (GAT) (62) software to test if the overlap between two sets of genomic annotations (such as ATAC-seq peaks and CIITA TF ChIP-seq peaks) was larger than expected by chance.
QTL mapping
Preparing genotype data
We obtained imputed genotypes for all of the samples from the HipSci (12) project. We used CrossMap v0.1.8 (63) to convert variant coordinates from GRCh37 reference genome to GRCh38. Subsequently, we filtered the VCF file with bcftools v.1.2 to retain only bi-allelic variants (both SNPs and indels) with IMP2 score > 0.4 and minor allele frequency (MAF) > 0.05 in our 86 samples. The same VCF file was used for all subsequent analyses. The genotype data for 52 managed access lines is available from the European Genome-phenome Archive (EGA) (EGAD00010000773), the data for the remaining 34 open access lines is deposited in the European Nucleotide Archive (ENA) (ERP013161). The VCF file was imported into R using the SNPRelate (64) R package.
Quantifying allele-specific expression and chromatin accessibility
We used ASEReadCounter (65) from the Genome Analysis ToolKit (GATK) to count the number of allele-specific fragments overlapping each variant in the RNA-seq and ATAC-seq datasets. We used the following flags with ASEReadCounter: ‘-U ALLOW_N_CIGAR_READS -dt NONE - -minMappingQuality 10 -rf MateSameStrand’. We removed indels from the VCF file prior to quantifying allele-specific expression because they are not supported by the RASQUAL model.
Detecting QTLs using RASQUAL
We wrote a collection of python scripts and a rasqualTools R package to simplify running RASQUAL on large number of samples and work with large RASQUAL output files. This software is available on GitHub (https://github.com/kauralasoo/rasqual). We used the vcfAddASE.py script to add allele-specifc counts calculated in the previous step into the VCF file. We ran RASQUAL (8) independently for each experimental condition using sex and first two PEER factors as covariates (sex and first 3 PCs for caQTLs). In contrast to standard linear model, covariates seemed to have only a minor effect on the number of QTLs detected by RASQUAL. We only included variants that were either in the gene body or within +/-500 kb from the gene (+/- 50kb from the peak). We specified ‘--imputation-quality > 0.7’. As a result, variants with imputation quality of < 0.7 were used as feature SNPs in allele-specific analysis but were not considered as possible causal variants. We also used RASQUAL’s GC correction option to correct for sample-specific GC bias in the feature-level read count data. To correct for multiple testing, we picked one minimal p-value per feature, used eigenMT (66) to estimate the number of independent tests performed in the cis-region of each feature and then performed Bonferroni correction to obtain the corrected p-value. We also ran RASQUAL once with the ‘--random-permutation’ option to obtain empirical null p-values from data with permuted sample labels. We performed the same eigenMT multiple testing procedure on the permuted p-values and compared the true association p-values to the the empirical null distribution to identify QTLs with FDR < 10%.
Detecting QTLs using a linear model
We used linear regression implemented in the FastQTL (67) software to map cis QTLs in each experimental condition. We used the ‘--permute 100 10000’ option to obtain permutation p-values for each association. The size of the cis windows was set to +/-500 kb around each gene and +/- 50kb around each ATAC-seq peak. Prior to to QTL mapping, the read count data was quantile normalised using the cqn package with GC-content of the feature (gene or peak) included as a covariate. For eQTL analysis, we used sex and the first six PEER factors as covariates in the model. For caQTL analysis we used sex and the first three principal components (PCs) as covariates in the model. Although FastQTL reported feature-level permutation p-values, obtaining those was computationally not feasible for RASQUAL. Therefore, to be able to faithfully compare the number of QTLs detected by FastQTL and RASQUAL we decided to apply exactly the same multiple testing correction procedure (eigenMT + single permutation of sample labels) to both methods. We further restricted the comparison to features what were tested by both methods. This affected a small number of genes that were tested by FastQTL but filtered out by RASQUAL, because the raw read count was exactly zero in all samples.
Detecting condition-specific QTLs with a linear model
In each condition, we first identified all features (genes or peals) and corresponding lead variants that displayed significant association at 10% FDR level from RASQUAL. For each feature, we retained only independent lead variants (R2 < 0.8). Finally, we used all independent pairs of features and corresponding lead variants to test if the QTL effect size was significantly different between conditions. This was equivalent to testing the significance of the interaction term between condition and lead QTL variant for each feature. Specifically, we used ANOVA to compare two models for each feature and lead variant pair:
H0: expression ~ genotype + condition + covariates
H1: expression ~ genotype + condition + genotype:condition + covariates
We calculated the p-value of rejecting H0 and performed Benjamini-Hochberg FDR correction to identify condition-specific QTLs that were significant at 10% FDR level. For both gene expression and chromatin accessibility analysis we used the same normalised data sets and covariates that were used for QTL mapping in each condition separately.
Filtering and clustering QTLs based on effect size
Next, we focussed on all significant feature-variant pairs that were detected with the interaction test above. We extracted the RASQUAL QTL effect size estimates π for each feature-variant pair in each condition and converted them to log2 fold changes between the two homozygotes using the formula log2FC = -log2(π/(1-π)). For an eQTL to be considered condition specific we required the log2FC in the naive condition to be less than 0.59 (1.5-fold) and the difference in log2FC between naive and any one of the stimulated conditions to be greater than 0.32 (~1.25 fold). Since caQTL effect sizes were generally larger than eQTL effect sizes, we used slightly more stringent criteria for filtering caQTLs: naive log2FC < 0.59 and difference in log2FC between any two conditions > 0.59 (1.5-fold). We further required the log2FC to be greater than 0.59 in at least one condition. For both eQTLs and caQTLs, we divided the log2FC values in each condition by the maximal log2FC value observed across conditions. This scaling was necessary to make QTLs with different absolute effect sizes comparable to each other for the k-means algorithm. Finally, we used k-means clustering to identify six groups of QTLs that had similar activity patterns between conditions.
QTL replicability between conditions
To quantify the extent of QTL sharing between two conditions (e.g. A and B), we identified all features (genes or peaks) with the nominal p-value of the lead variant < 1×10⁻⁶ in condition A and then counted how often was a linked lead variant (R2 > 0.8) for the same feature detected in condition B, irrespective of its nominal p-value in condition B. We also repeated the analysis by starting with significant QTLs identified in condition B and replicating in condition A.
Motif disruption analysis
We limited motif disruption analysis to caQTL peaks that did not contain associated indels and had <= 3 overlapping SNPs in them. For each SNP and peak pair we focussed on the sequence +/- 25 bp from the SNP. We constructed both reference and alternative versions of the sequence and used TFBSTools v1.10.4 (68) to calculate the relative binding scores for both alleles (expressed as percentage between 0-100%). We considered the variant to be motif disrupting if the difference in relative binding score between the two alleles was > 3 percentage points. We also required the relative binding score for at least one of the alleles to be >= 85% of the theoretical maximum. This filter was necessary to exclude potential motif disruption events in very weak motif matches that are not likely to correspond to binding in vivo and is similar to the default recommended by TFBSTools. We used Fisher’s exact test to identify motifs that were significantly more often disrupted in one of the six condition-specific caQTL clusters compared to all caQTLs.
Identifying condition-specific dependent peaks
To identify condition-specific dependent peaks, we tested if the effect size of the caQTL changed differently for master and dependent peaks between two pairs of conditions. This was equivalent to testing the significance of a three-way interactions between genotype, peak (master or dependent) and condition. We implemented this as the comparison of two standard linear models in R:
H0: y ~ peak + condition + peak*condition + genotype*peak + genotype*condition + covariates
H1: y ~ peak + condition + peak*condition + genotype*peak + genotype*condition + genotype*condition*peak + covariates
Similarly to condition-specific caQTL analysis, we used the first three principal components calculated separately for each condition as covariates in the model. We identified all master-dependent peak pairs that showed significant interaction at 10% Benjamini-Hochberg FDR level. We used the log2FC from RASQUAL as the measure of caQTL effect size. To identify true condition-specific dependent peaks, we further filtered the results by requiring the absolute log2FC of the master peak to be > 0.59 (1.5-fold) in the naive condition and the change in the log2FC for the dependent peak between the naive and stimulated condition to be > 0.59.
Linking condition-specific eQTLs to caQTLs
First, we identified eQTLs that appeared either after IFNɣ stimulation or Salmonella infection by using similar log2FC cut-offs that we used for clustering eQTLs. Specifically, we required the log2FC in the naive condition to be < 0.59 and the difference in log2FC between naive and the stimulated (either IFNɣ or Salmonella) conditions to be > 0.32. We also required the absolute log2FC in the stimulated condition to be > 0.32. Next, for each gene with a condition-specific eQTL, we used RASQUAL to test for association between the lead eQTL variant and all ATAC-seq peaks within +/-100 kb window from the lead variant. We performed the association test in the condition in which the eQTL was active (i.e. IFNɣ for IFNɣ-specific eQTLs and Salmonella for Salmonella-specific eQTLs). We used Bonferroni correction to account for multiple peaks tested per gene and filtered the peak-gene pairs at Benjamini-Hochberg FDR < 10%. For each condition-specific eQTL we retained only one peak that had the lowest association p-value. Finally, we required the lead eQTL and caQTL variants to be in high LD with each other (R2 > 0.8). With this approach, we identified a corresponding caQTL for 58/164 (35%) IFNɣ-specific eQTLs and 82/323 (25%) Salmonella-specific eQTLs. The smaller relative overlap with Salmonella-specific eQTLs was likely due to smaller ATAC-seq sample size and less caQTL identified in the Salmonella condition.
Overlap with genome-wide association studies
We obtained full summary statistics for ten immune-mediated disorders: inflammatory bowel disease (IBD) including ulcerative colitis (UC) and Crohn’s disease (CD) (69), Alzheimer’s disease (AD) (70), Rheumatoid arthritis (RA) (71), systemic lupus erythematosus (SLE) (72), type 1 diabetes (T1D) (73), Schizophrenia (SCZ) (74), multiple sclerosis (MS) (75), celiac disease (CEL) (76) and narcolepsy (NAR) (77). In addition, we used summary statistics from type 2 diabetes (T2D) (78) as a negative control for a trait that should not be specifically enriched in macrophages. Summary statistics for T1D, CEL, IBD, RA, AD, MS and SLE were downloaded in 2015. SCZ, T2D and NAR were downloaded in 2016. T2D summary statistics were converted from GRCh36 to GRCh37 coordinates using the LiftOver tool, all of the other summary statistics already used GRCh37 coordinates.
Summary statistics for Alzheirmer’s disease were downloaded from International Genomics of Alzheimer’s Project (IGAP). IGAP is a large two-stage study based upon genome-wide association studies (GWAS) on individuals of European ancestry. In stage 1, IGAP used genotyped and imputed data on 7,055,881 single nucleotide polymorphisms (SNPs) to meta-analyse four previously-published GWAS datasets consisting of 17,008 Alzheimer’s disease cases and 37,154 controls (The European Alzheimer’s disease Initiative – EADI the Alzheimer Disease Genetics Consortium – ADGC The Cohorts for Heart and Aging Research in Genomic Epidemiology consortium – CHARGE The Genetic and Environmental Risk in AD consortium – GERAD). In stage 2, 11,632 SNPs were genotyped and tested for association in an independent set of 8,572 Alzheimer’s disease cases and 11,312 controls. Finally, a meta-analysis was performed combining results from stages 1 & 2.
Enrichment analysis
In each of the four conditions, we took all variants that were associated with either gene expression or chromatin accessibility with nominal p-value < 1×10⁻⁵ and used that set of variants as a custom annotation track. We then used GARFIELD (28) to test if GWAS hits for the ten traits described above were enriched among the QTL variants. We excluded the MHC region (GRCh37: 6:20,000,000-40,000,000) from the GWAS summary statistics prior to enrichment testing, because this region was found to significantly inflate estimates of fold enrichment. In the main text, we reported fold enrichment at 1x10⁻⁵ GWAS significance threshold.
Colocalisation analysis
We used coloc v2.3-1 (30) to test for colocalisation between molecular QTLs and GWAS hits. In the colocalisation analysis we used summary statistics from the linear model (rather than RASQUAL), because RASQUAL summary statistics could not be easily converted to approximate Bayes factors required by coloc. We ran coloc on a 400kb region centered on each lead eQTL and caQTL variant that was less than 100kb away from at least one GWAS variant with nominal p-value < 1x10⁻⁵. We then applied a set of filtering steps to identify a stringent set of eQTLs and caQTL that colocalised with GWAS hits. Similarly to what was done in (35), we first removed all cases where PP3 + PP4 < 0.8, to exclude loci where we were underpowered to detect colocalisation. We then required PP4/(PP3+PP4) > 0.9 to only keep loci where coloc strongly preferred the model of a single shared causal variant driving both association signals over a model of two distinct causal variants. We excluded all colocalisation results from the MHC region (GRCh38: 6:28,510,120-33,480,577) because they were likely to be false positives due to complicated LD patterns in this region. We only kept results where the minimal GWAS p-value was < 10-6. Finally, we manually excluded 11 potential eQTL overlaps and 6 potential caQTL overlaps where on visual inspection the LD block exceeded the 400kb window that we used for colocalisation testing.
Software used
Most figures were made in R using ggplot2 (79) and wiggleplotr (https://github.com/kauralasoo/wiggleplotr) was used to produce RNA-seq and ATAC-seq read coverage plots. List of software used in this study is presented below.
Data availability
All of the experimental data has been deposited in the following repositories:
Supplementary Tables
Table S1: Metadata for all iPSC to macrophage differentiation attempts.
Table S2: GARFIELD fold enrichments and p-values for 10 different GWAS traits.
Table S3: List of eQTLs colocalised with GWAS associations.
Table S4: List of caQTLs colocalised with GWAS associations.
Table S5: Metadata for the RNA-seq samples.
Table S6: Metadata for the ATAC-seq samples.
Acknowledgements
We thank Leopold Parts, Jeremy Schwartzentruber, Chris Wallace and Lili Milani for helpful comments on the manuscript. We thank Rachel Nelson for assistance and early access to HipSci iPSC lines. We also thank WTSI DNA Pipelines and Cytometry Core Facility for their sequencing and flow cytometry services. This work was supported by the Wellcome Trust grant #098051. K.A. was supported by a PhD fellowship from the Mathematical Genomics and Medicine programme from the Wellcome Trust. The iPSC lines were generated at the Wellcome Trust Sanger Institute, under the Human Induced Pluripotent Stem Cell Initiative funded by a strategic award (WT098503) from the Wellcome Trust and Medical Research Council. We also acknowledge Life Science Technologies Corporation as the provider of cytotune.
References
- 1.↵
- 2.↵
- 3.
- 4.
- 5.↵
- 6.↵
- 7.↵
- 8.↵
- 9.↵
- 10.↵
- 11.↵
- 12.↵
- 13.↵
- 14.↵
- 15.↵
- 16.↵
- 17.↵
- 18.↵
- 19.↵
- 20.↵
- 21.↵
- 22.↵
- 23.↵
- 24.↵
- 25.↵
- 26.↵
- 27.↵
- 28.↵
- 29.↵
- 30.↵
- 31.↵
- 32.↵
- 33.↵
- 34.
- 35.↵
- 36.↵
- 37.↵
- 38.↵
- 39.↵
- 40.↵
- 41.↵
- 42.↵
- 43.↵
- 44.↵
- 45.↵
- 46.↵
- 47.↵
- 48.↵
- 49.↵
- 50.↵
- 51.↵
- 52.↵
- 53.↵
- 54.↵
- 55.↵
- 56.↵
- 57.↵
- 58.↵
- 59.↵
- 60.↵
- 61.↵
- 62.↵
- 63.↵
- 64.↵
- 65.↵
- 66.↵
- 67.↵
- 68.↵
- 69.↵
- 70.↵
- 71.↵
- 72.↵
- 73.↵
- 74.↵
- 75.↵
- 76.↵
- 77.↵
- 78.↵
- 79.↵
- 80.


